Gamma-ray Fluxes in Oklo Natural Reactors
Abstract
-
Background: Uncertainty in the operating temperatures of Oklo reactor zones impacts the precision of bounds derived for time variation of the fine structure constant . Improved 176Lu/175Lu thermometry has been discussed but its usefulness may be complicated by photo excitation of the isomeric state 176mLu by 176Lu() fluorescence.
-
Purpose: We calculate prompt, delayed and equilibrium -ray fluxes due to fission of 235U in pulsed mode operation of Oklo zone RZ10.
-
Methods: We use Monte Carlo modeling to calculate the prompt flux. We use improved data libraries to estimate delayed and equilibrium spectra and fluxes.
-
Results: We find -ray fluxes as a function of energy and derive values for the coefficients that describe burn-up of 176Lu through the isomeric 176mLu state.
-
Conclusion: The contribution of the () channel to the 176Lu/175Lu isotopic ratio is negligible in comparison to the neutron burn-up channels. Lutetium thermometry is fully applicable to analyses of Oklo reactor data.
pacs:
06.20.Jr, 07.05.Tp, 25.20.Dc, 25.85.Ec, 28.20.Gd, 28.41.Kw1. Introduction.
Studies of the 235U fission product isotopic ratios from Oklo Nau91 have been undertaken by many groups investigating whether the fine structure constant has changed over the 2 GY period since the reactors operated. As first pointed out by Shlyachter Shl76 , the samarium isotopic ratios are sensitive to the value of through the overlap of the 149Sm E0=97.3-meV neutron resonance with the thermal and epithermal portions of the neutron flux in the reactor. While the majority of Oklo analyses Fuj00 ; Dam96 ; Chris06 ; Petr06 ; Oneg10 , have been consistent with no shift in the resonance energy, and therefore no change in , a change has been argued for from astronomical observations Webb11 .
All Oklo analyses make assumptions about the operating temperatures of the reactors. But there is as yet no agreement on what these temperatures actually were. Utilizing the 176Lu/175Lu isotope ratio method to determine temperatures was recently revisited by Gould and Sharapov Gould012 . The method is based on the temperature dependence of the large thermal neutron capture cross section of 176Lu (natural abundance 2.599 % NNDC ), and on knowing with certainty the (small) ground state branching ratio for thermal neutron capture on the more abundant lutetium isotope, 175Lu (natural abundance 97.401 %). The dominant capture branch leads to a short lived isomeric state in 176mLu, while only a minor branch leads to the ground state of 176Lu. The data from Oklo show clearly that 176Lu is depleted in the reactor zones. But as concluded in ref. Gould012 , the degree of depletion will be a reliable indicator of the temperature only if an improved measurement of is performed, and if alternate explanations Gould012 for depletion are ruled out.
One alternate explanation for 176Lu depletion lies in the possibility of processing of the lutetium isotopes in Oklo due to photo excitation of the isomeric state in 176mLu by 176Lu() fluorescence. Such a process is well known in astrophysics and is an important channel for burning 176Lu in stellar environments Thra010 ; Mohr09 . The isomeric state decays to 176Hf with a half-life of 3.6 hr, and therefore provides an alternate path for removing 176Lu. Here we explore whether this could have been be an effect in the -ray fluxes in the reactors, taking advantage of newly developed data libraries for fission decay chains.
In 235U thermal neutron fission, about 6.6 MeV is released in the form of prompt rays, about 6.5 MeV as rays, and about 6.3 MeV as rays following emission. The sum of the delayed and energy released during the decay of fission products is called decay heat and varies as a function of time, , after a single fission event at t=0.
Beginning with the work of Way and Wigner Way48 , many calculations and measurements of have been performed, see Tobias Tobi80 and Dickens Dick86 for reviews. Typically, is found for times greater than several seconds 111Note this is not the same as the time dependence of decay heat following shutdown of a long-running reactor Glass81 .. With the development of more comprehensive nuclear data libraries based on level schemes derived from high resolution Ge-detector data, summation method calculations became widely accepted. These calculations gave good agreement with measurements except at the shorter times associated high Q-value decays. High Q-values feed levels at high excitation that can decay by emission of weak and (or) high energy rays easily missed in Ge-detector measurements. As a result, the libraries were incomplete. Recently, Total Absorption Gamma Spectrometer (TAGS) data have been included in libraries. This has eliminated the discrepancies. In particular, Algora et al. algora10 were able to report 239Pu decay heat calculations in excellent agreement with experiments for shorter times.
We follow this approach for calculating 235U decay heat -spectra Sonz011 , converting to fluxes using standard energy deposition conversion coefficients. We apply Monte Carlo modeling to calculate the prompt -ray flux in the Oklo reactor zone.
With these fluxes in hand, and a model of how the reactor operated, we can then estimate photo-excitation constants
for burning 176Lu through the isomeric state 176mLu.
2. Prompt fission -ray flux in Oklo reactor zone RZ10.
The MCNP code MCNP4 allows modeling of neutron transport and also provides the energy dependence of the prompt -ray flux. We use the same input for the Oklo zone RZ10 as in our previous work Chris06 . The model of a reactor zone is a flat cylinder of 70 cm height, 6 m diameter, surrounded by a 1 m thick reflector consisting of water saturated sandstone. As for any reactor, Oklo criticality is determined by the geometry and the composition of the active zone. Oklo reactor zones include uraninite , gangue (oxides of different metals with water of crystallization) and water. The total density of the active core material at ancient times was about 3 g cm-3 for RZ10 with only 30 wt. % of UO2 in the RZ10 dry ore. The hydrogen to uranium atomic ratio in our model was and the multiplication coefficient of the fresh core was keff=1.036. Detailed composition and neutronic parameters of the RZ10 reactor zone are given in Chris06 . The rate of fission can be deduced from the Hidaka and Holliger model Hida98 , which found an average RZ10 neutron fluence of 0.65 kb-1 over a time duration of 160 kyr.
From analysis of xenon isotope abundances in Oklo grains of aluminum phosphate, Meshik et al. Mesh04 concluded the reactors operated cyclically, with reactor-on periods of about 0.5 hr (1800 s), separated by dormant reactor-off periods of 2.5 hr (9000 s). We use this periodicity in calculating absolute fluxes. Adapting to the pulse mode, we find fissions for the 1800 s the reactor is on, with a thermal power of about 18 kW. We include only 235U fission here since 238U and 239Pu fission was found by Hidaka and Holliger to contribute less than ten percent to the neutron yields.
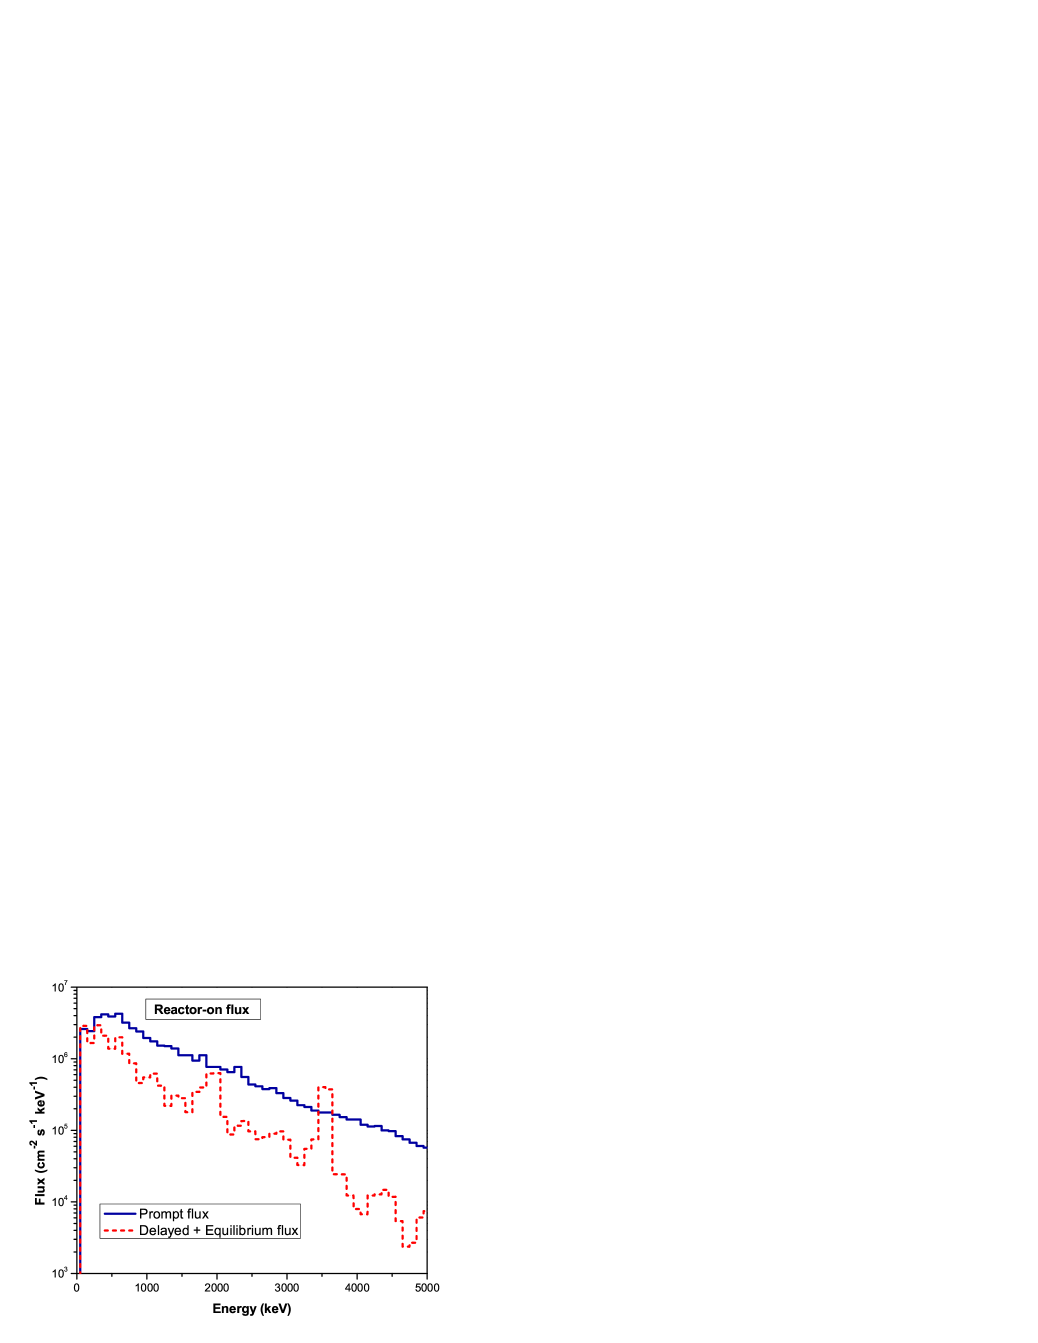
The prompt -ray flux during the reactor-on period is shown as the upper line in Fig. 1. The other flux shown refers to the delayed heat and is discussed in the next sections. The total prompt -ray flux is about cm-2 s-1. The electromagnetic energy per fission corresponds to about 14.7 MeV, greater than the 6.6 MeV of prompt -ray fission energy due to neutron capture on the materials of the reactor.
3. Decay heat -ray spectra from fission
A large number of radioactive nuclides are produced from the fission of an actinide target such as 235U. Of relevance in describing the time evolution of the decay network are the longer-lived levels, ground states and isomers, here called materials. While the reactor is operating, the materials population satisfies the following set of linearly-coupled differential equations:
| (1) |
where the decay constant of the material is , is the half-life for the material , is the probability that the material will populate in its decay the material , is the fission rate and is the independent fission yield for the material . When the reactor is not operating, the equations for are the same but with =0.
For each material, we have obtained the Ge-detector -ray spectrum from the ENDF/B-VII.1 decay data sub-library endfb71 , using a detector resolution of 2 keV (FWHM) for discrete lines and a =0.5 keV binning. The spectrum is defined so that gives the absolute probability of observing -rays with energies in the , interval per decay of the material .
During the period , , the -ray spectrum obtained by adding the contribution of all the radioactive nuclides in the core is given by:
| (2) |
which can be integrated over time to obtain:
| (3) |
The mean electromagnetic energy (EEM), and average energy of the spectrum are calculated as:
| (4) |
| (5) |
Equations (1) were solved numerically using the fission yields from the JEFF-3.1 library jeff and the decay data from the ENDF/B-VII.1 library endfb71 .
To confirm the correctness of our procedure, we first calculated delayed -ray spectra for time intervals =1-1800 s and =1-9000 s following a single fission event at =0. These time intervals match the cycling times in our reactor model. Our values are shown in the second column of Table 1. In columns three through five, we compare to values obtained by numerical integration of as given in Refs Dick86 ; jeff ; endfb71 . The last column is an average of these three reference values. Our values are about 0.40 MeV lower because they are derived from point-wise -ray spectra. If we use the values in the ENDF/B-VII.1 library, which includes the latest TAGS measurements, we obtain =4.03 MeV and =4.77 MeV, in agreement with the average of other results. Because of the pandemonium effect Hardy77 , it is a well-known fact that one obtains a lower value when using point-wise spectra, in this case about 10%.
| Time interval, s | Present work | ENDF/B-VII.1endfb71 | DickensDick86 | JEFF-3.1jeff | Average value |
|---|---|---|---|---|---|
| 11800 | 3.60 | 4.12 | 4.10 | 4.00 | 4.07 |
| 19000 | 4.34 | 4.84 | 4.74 | 4.70 | 4.76 |
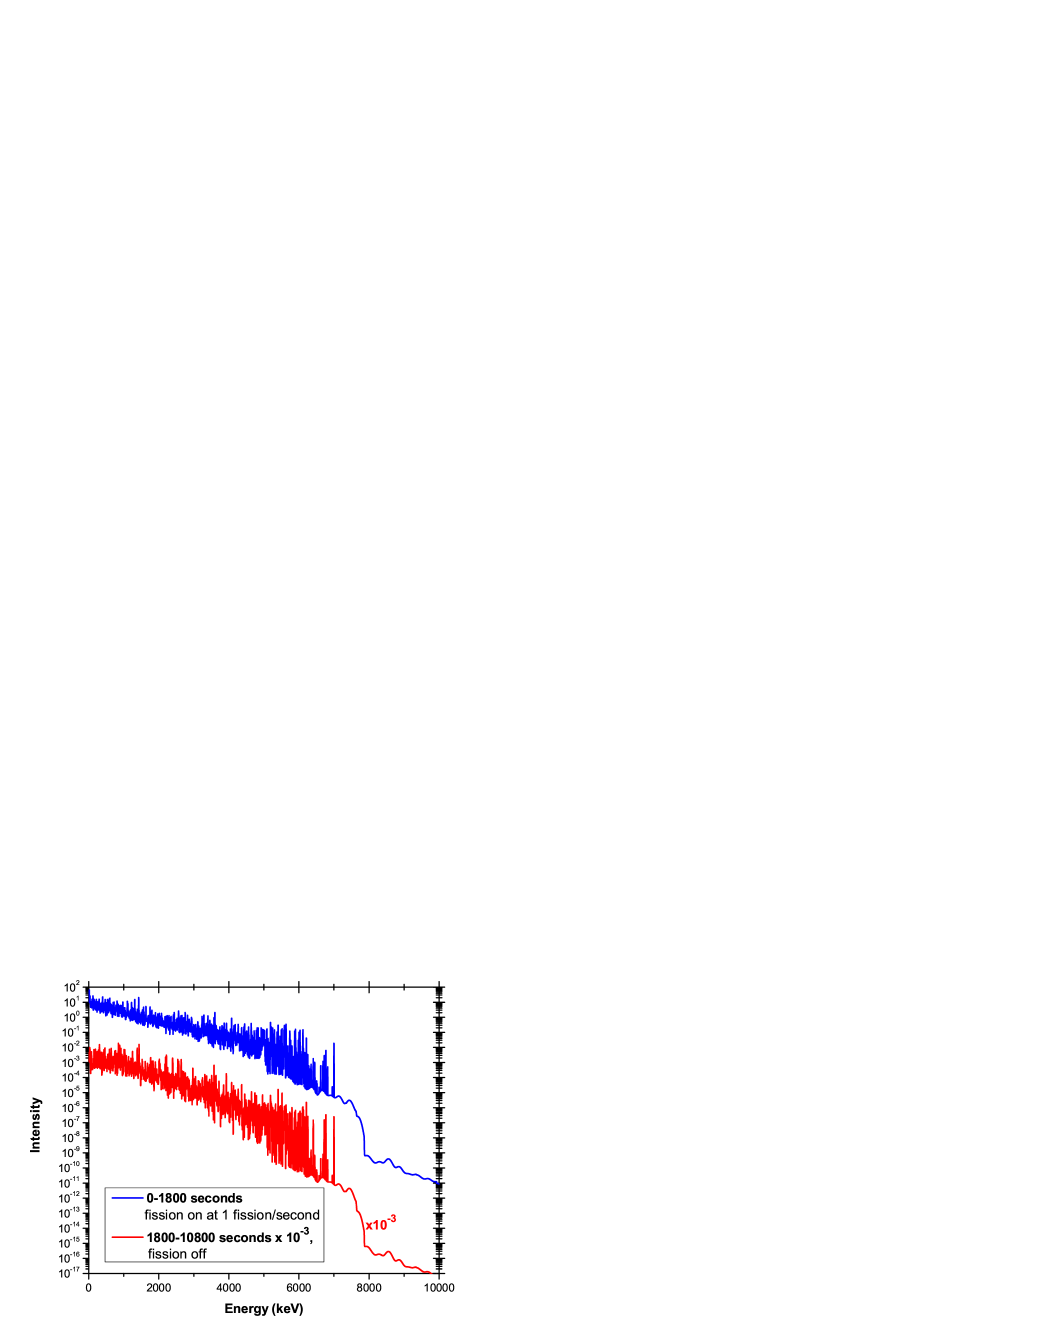
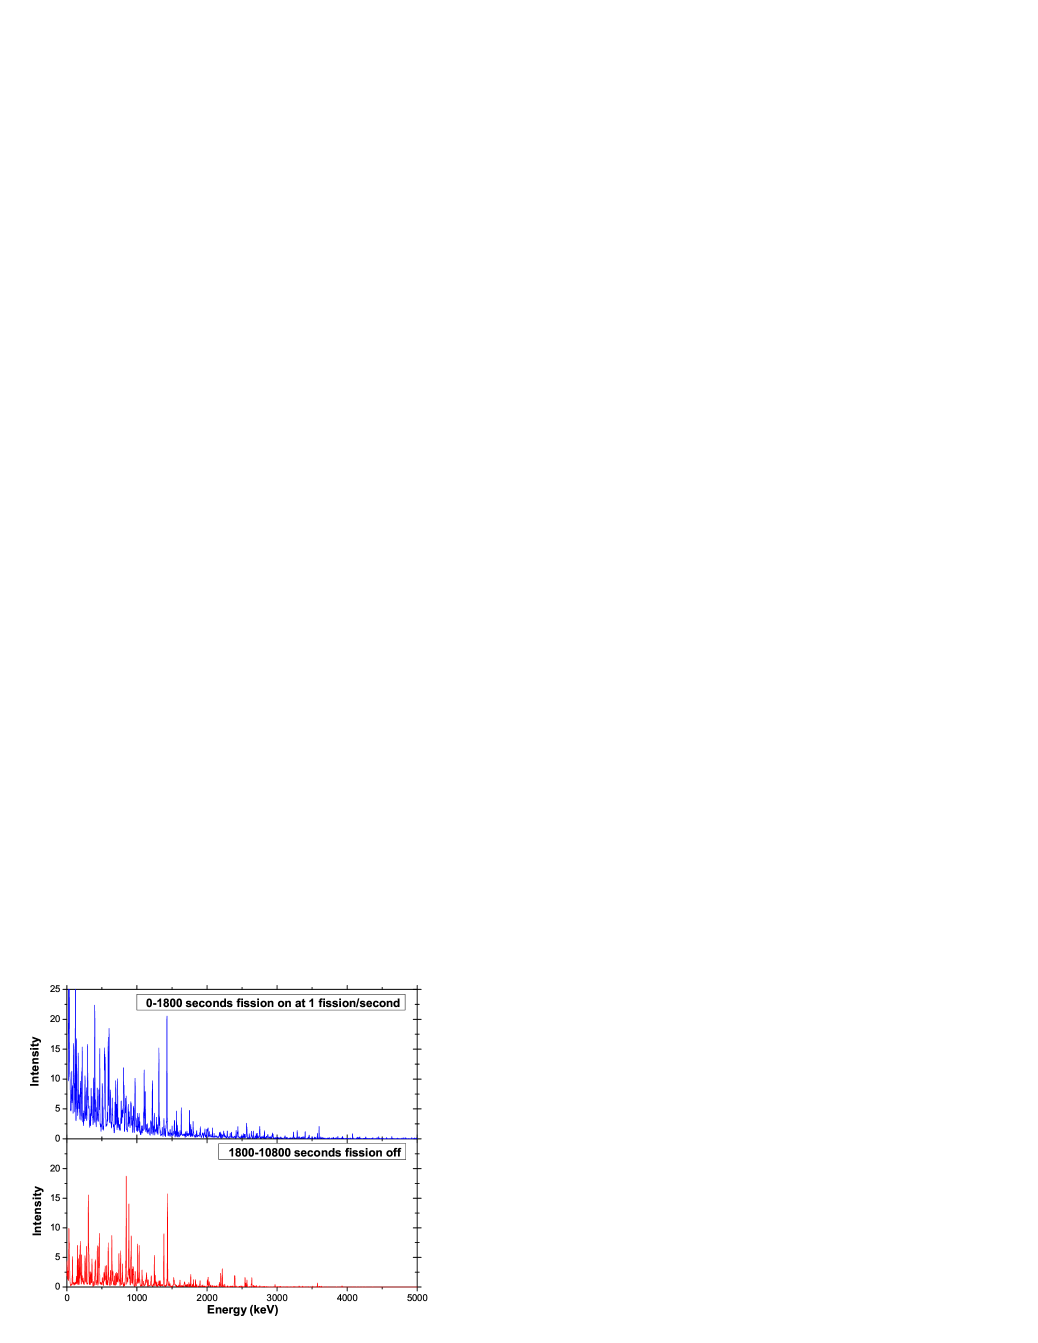
We are interested in the -ray flux in the pulsed cycling mode of the reactor operation, not just for a fission event at . We therefore calculated next the -ray spectra during the 0.5 hr pulse (1800 s) and during the 2.5 hr (9000 s) cooling period, assuming one fission per second during the reactor-on pulse. In these calculations we took =0, that is, a fresh core. The spectra for a 0.15 to 10 MeV energy range are shown in Figs. 2 and 3, the former on a log scale, and the latter on a linear scale to show the fine structure of the lower energy portion of the spectrum. The value for the reactor-on 0-1800 s spectrum is 3.49 MeV/fission, with equal to 0.732 MeV. For the reactor-off 1800-10800 s spectrum, is equal to 1.24 MeV/fission and is slightly higher, 0.813 MeV. Adding the spectra gives = 4.73 MeV.
Using these EEM values and knowing the number of fissions per pulse, we can now calculate the prompt, delayed and equilibrium components of the electromagnetic energy for the reactor-on and reactor-off time intervals. These values are shown in columns two through four of Table II. The prompt entry corresponds to the energy from prompt fission and neutron capture -rays. This is zero when the reactor is off. The delayed entries are derived from the -ray decay values given earlier. Both prompt and delayed components originate from one single reactor-on pulse of power 18 kW. In addition to these components, there will also be equilibrium decay heat associated with fission from the N previous pulses (N 1). For our purposes this can be estimated over short periods of time simply by using the standard relation for the power of the after heat compared to the power of the reactor: Pheat = 0.066Pav Glass81 . Taking the average thermal power in our model to be Pav=3 kW, and noting only half the energy in the after heat is electromagnetic, we then have Pγ = 0.033Pav, which leads to the values shown in column four. We see the equilibrium flux within the pulse will be a factor of 1.12/3.59 = 0.31 smaller than the delayed flux within the pulse.
The last column is the energy release per unit time summed over all electromagnetic components. Assuming similar spectral shapes of the components, these latter quantities will be proportional to the total -ray flux during the reactor-on and reactor-off pulses. We conclude that the flux in time intervals between pulses (180010800 s) will be about 7% of the flux during the 1800-s reactor-on pulse.
| , s | prompt | delayed | equilibrium | energy rate, MeV/s |
|---|---|---|---|---|
| 01800 | 15.14 | 3.59 | 1.12 | 11.03 |
| 180010800 | 1.28 | 5.62 | 0.77 |
4. Conversion of the delayed -ray spectra to -ray fluxes
To estimate the photo-excitation parameters in 176Lu it is necessary to know -ray fluxes, not simply Ge-detector spectra. The prompt flux is obtained directly as output of MCNP MCNP4 . We get the delayed flux using the -ray dose to photon fluence conversion factors published by the International Commission on Radiological Protection (ICRP) ICRP . Our conversion assumes that all -rays produced in Oklo reactors are absorbed by the active core materials, both fertile and nonfertile.
The conversion coefficients k(E), are listed in Table III, where the absorbed dose is in units of erg g-1 and the photon fluence is in units of cm-2. A polynomial fit to these data gives with E in MeV.
| , keV | 100 | 200 | 300 | 400 | 500 | 600 | 800 | 1000 | 1500 | 2000 | 3000 | 4000 |
|---|---|---|---|---|---|---|---|---|---|---|---|---|
| , 10-8 erg g-1/ cm-2 | 0.37 | 0.86 | 1.38 | 1.89 | 2.38 | 2.84 | 3.69 | 4.47 | 6.14 | 7.55 | 9.96 | 12.10 |
For the Oklo zone RZ10, the total
mass is 60 tonne. To convert the reactor-on spectrum of Fig. 2 to a flux, we therefore multiply by the energy , divide by
, divide by the total mass of the reactor zone and the 1800 s accumulation time,
and normalize to the 235U fission rate .
We multiply this flux by 1.31 to take into account the contribution of the equilibrium flux.
The resulting reactor-on delayed + equilibrium flux, binned in 100-keV intervals, is shown in Fig 1 and can now be compared to the prompt flux.
We see it is typically an order of magnitude smaller. However, at a few energies it does actually exceed the prompt flux.
5. Implications of -ray flux estimates for 176Lu/175Lu thermometry.
Lutetium thermometry is based on the dependence of the 176Lu/175Lu isotopic ratio on the operating temperature of a reactor in which 176Lu is burned (and partially restituted) by neutron capture reactions. As detailed in Ref. Gould012 , this process is not described by a single exponential decay constant. However, to set a time scale for judging the impact of the -ray flux, we can introduce an effective constant s-1 (effective half-life of 60 kY) based on the factor 6.4 reduction in the isotopic ratio over the 160 kY operating time of RZ10 Chris06 . Then we write the total constant for disappearance of 176Lu as , where the second term corresponds to the photo-excitation process as an alternate explanation for 176Lu depletion. We omit the beta decay constant for 176Lu s-1 because it is by six order of magnitude less than .
Experimental data Thra010 ; Mohr09 confirm that long lived 176Lu in the photon bath of celestial bodies can be partially transformed into metastable 176mLu by photons with energies around 880, 1060, 1330, and 1660 keV. Higher energy photons may also contribute Carr91 . These photon energies correspond to excited states of 176Lu with specific spins and parities which allow them to act as mediators for photo excitation of the isomeric state. The rate of photo excitation of the isomeric state 176mLu in photon inelastic scattering through an intermediate state (IS) at energy is given by
| (6) |
Here is the differential photon flux at energy having units of keV-1 cm-2 s-1, and is the integrated cross section for the IS. When several IS contribute, will be a sum over the individual IS contributions.
In writing the rate on the right as the product of two factors we are implicitly assuming the flux is continuous, and varying slowly over the narrow resonance energy . This is true in stellar environments, and for example, in bremsstrahlung experiments. It is not necessarily the case in our situation where the photon spectra are made up from a sum over many discrete -ray lines. However, our fluxes propagate in the dense environment of the Oklo reactors, and as discussed by von Neumann-Cosel et al. vN91 , Compton scattering can broaden otherwise discrete spectra quite significantly. The MCNP code models Compton scattering, pair-production and electron bremsstrahlung fully, leading to the continuous prompt spectrum shown in Fig. 1. The delayed spectra show more structure, but for purposes of estimating upper bounds on the photo-excitation process we assume our 100 keV averaging procedure will serve as a useful approximation.
Reported values of the photo excitation cross sections given in the literature include =33.4 mbeV for =839 keV (this is an upper limit in Ref. Mohr09 , for a laboratory environment, as opposed to a fully ionized environment), and higher values =140 mbkeV and 350 mbkeV, for 4- and 6-MeV bremsstrahlung irradiations respectively, with an assumed IS energy of 2.125 MeV Carr91 .
With these cross sections, and the fluxes of Fig. 1 at hand, we can now calculate for Oklo reactor RZ10. Taking into account the pulse structure, we use a weighted average flux consisting of 1/6 of the sum of the prompt, delayed and equilibrium fluxes while the reactor is on, and 5/6 of 7% of this sum while the reactor is off.
The option of =839 keV, with a total spectral flux of cm-2 s-1 keV-1, leads to s-1 which is negligible. The 6-MeV bremsstrahlung option with = 2.1 MeV, has a total spectral flux of cm-2 s-1 keV-1 and gives s-1. However, even this value is less than the by seven orders of magnitude. We conclude that destruction of 176Lu in the Oklo reactors is not influenced by any part of the reactor-on photon flux.
After complete shutdown, the power of the -ray decay heat decreases approximately as Glass81 , reaching about 1% of the equilibrium value after a year. At this point it can be ignored. We conclude therefore that the decay heat is also not able to change the lutetium isotopic ratio even over the long period the reactor has been shut down.
The particular values we have found are specific to the uniform pulsed
mode of operation that we have assumed.
However, the burn rate for steady state reactor
operation will not be much different since our result is
determined mainly by the prompt flux, which scales
inversely with the live time of the reactor.
Absent a many orders of magnitude larger photo-excitation cross section through
as yet undetermined levels,
we see the photon intensities in the reactor are insufficient to
alter the 176Lu/175Lu
isotopic ratios associated with neutron transmutation.
6. Conclusions
We have developed realistic models of the prompt and delayed -ray fluxes in Oklo natural nuclear reactors, taking advantage of recent releases of the databases and methodology that accurately represent short time decay heat in fission processes. We have compared 176Lu transmutation rates associated with photo excitation to transmutation rates associated with neutron capture processes. In contrast to astrophysical processes, we find 176Lu/175Lu isotopic ratios in Oklo are not influenced by decay heat electromagnetic radiation, either during reactor operation, or after reactor shutdown. Lutetium thermometry, as recently studied Gould012 , is therefore applicable to analyses of Oklo reactor data.
Acknowledgements.
This work was supported by the US Department of Energy, Office of Nuclear Physics, under Grant No. DE-FG02- 97ER41041 (NC State University), and under contract No. DE-AC02-98CH10886 with Brookhaven Science Associates (NNDC).References
- (1) R. Naudet, Oklo: des Rèacteurs Nuclèaires Fossiles (Eyrolles, Paris, 1991).
- (2) A. Shlyakhter, Nature 264, 340 (1976).
- (3) Y. Fujii, A. Iwamoto, T. Fukahori, T. Ohnuki, M. Nakagawa, H. Hidaka, Y. Oura, and P. Moeller, Nucl. Phys. B573, 377 (2001), revisited in arXiv:hep-ph/0205206, 19 May 2002.
- (4) T. Damour and F. Dyson, Nucl. Phys. B480, 37 (1996).
- (5) C. R. Gould, E. I. Sharapov, and S. K. Lamoreaux, Phys. Rev. C 74, 024607 (2006).
- (6) Yu. V. Petrov, A. I. Nazarov, M. S. Onegin, V. Yu. Petrov, and E. G. Sakhnovsky, Phys. Rev. C 74, 064610 (2006).
- (7) M. S. Onegin, arXiv:1010.6299v1 [nucl-th], 29 Oct 2010.
- (8) J. K. Webb, J. A. King, M. T. Murphy, V. V. Flambaum, R. F. Carswell, and M. B. Bainbridge, Phys. Rev. Lett. 107, 191101 (2011).
- (9) C. R. Gould, E. I. Sharapov, Phys. Rev. C 85, 024610 (2012).
- (10) Abundance and lifetime data from the National Nuclear Data Center www.nndc.bnl.gov
- (11) K. Thrane, J. N. Connelly, M. Bizzarro, B. S. Meyer and L.S. The, Astrophys. J 717, 861 (2010)
- (12) P. Mohr, S. Bisterzo, R. Gallino, F. Käppeler, U. Kneissl, and N. Winckler, Phys. Rev. C 79, 045804 (2009).
- (13) K. Way, E.P. Wigner, Phys. Rev. 73, 1318 (1948).
- (14) A. Tobias, Progress in Nuclear Energy 5, 1 (1980).
- (15) J.K. Dickens, Conf-860906-9, Oak Ridge National laboratory, Oak Ridg 1986.
- (16) Samuel Glasstone and Alexander Sesonske, Nucler Reactor Engineering, 3rd edition (Van Nostrand Reinhold, New York, 1981).
- (17) Algora,A./Jordan,D./Tain,J.L./Rubio,B./Agramunt,J./Perez-Cerdan,A.B./Molina,F./Caballero,L./Nacher,E./Krasznahorkay,A./Hunyadi,M.D./Gulyas,J./Vitez,A./Csatlos,M./Csige,L./Aysto,J./Penttila,H./Moore,I.D./Eronen,T./Jokinen,A./Nieminen,A./Hakala,J./Karvonen,P./Kankainen,A./Saastamoinen,A./Rissanen,J./Kessler,T./Weber,C./Ronkainen,J./Rahaman,S./Elomaa,V./Rinta-Antila,S./Hager,U./Sonoda,T./Burkard,K./Huller,W./Batist,L./Gelletly,W./Nichols,A.L./Yoshida,T./Sonzogni,A.A./Perajarvi,K./, Phys. Rev. Lett. 105, 202501 (2010).
- (18) T.D. Johnson, A. Sonzogni, E. McCutchan, Bull. Am. Phys. Soc 56, no. 12 (2011).
- (19) J. F. Briesmeister, ed. “MCNPTM A General Monte Carlo N-Particle Transport Code”, Version 4C, LA-13709-M (Los Alamos National Laboratory, Los Alamos, 2000).
- (20) H. Hidaka and P. Holliger, Geochimica et Cosmochimica Acta, 62, No. 1, 891 (1998).
- (21) A. P. Meshik, C. M. Hohenberg, O. V. Pravdivtseva, Phys. Rev. Lett. 93, 182302 (2004).
- (22) M.A. Kellet, O. Bersillon, R.W. Mills, OECD NEA 6287 report (2009)
- (23) M.B. Chadwick, M. Herman, P. Oblozinsky, et al: 52 authors, Nucl. Data Sheets 112, 2887 (2011).
- (24) J.C. Hardy, L.C. Carraz, B. Jonson, P.G. Hansen, Physics Letters B 71, 307 (1977).
- (25) Annals of the ICRP, 26-3, 159 (1996).
- (26) J. J. Carroll, M. J. Byrd, D. G. Richmond, T. W. Sinor, K. N. Taylor, and W. L. Hodge, Y. Paiss, C. D. Eberhard, J. A. Anderson, and C. B. Collins, E. C. Scarbrough, and P. P. Antich, F. J. Agee, D. Davis, G. A. Huttlin, K. G. Kerris, M. S. Litz, and D. A. Whittaker, Phys. Rev. C 43, 1238 (1991).
- (27) P. von Neumann-Cosel, A. Richter, J. J. Carroll, and C. B. Collins, Phys. Rev. C 44, 554 (1991).