Investigation on the contribution of the particle mass to the interaction measure
Abstract
Collective phenomena from RHIC and LHC experiments indicate a strongly coupled quark gluon plasma. Finite temperature lattice QCD calculations show the interaction measure, , is sizeable over a considerable range of temperatures above the deconfinement temperature, which may also indicate that the plasma is strongly interacting. For the ideal gas with massless particles, the interaction measure is zero. A nonzero value is probably due to either the interaction or the mass. In order to see the contribution of the particle mass to the interaction measure, in this paper we study a system without any interactions, i.e., an ideal gas with massive particles. After assembling the standard formulas of the quantum statistics with relativistic energy, we calculate the energy density, the pressure and the interaction measure. We find that their dependences on temperature reproduce the qualitative features of the lattice result. The interaction measure is nonzero for an ideal gas, which demonstrates that the particle mass contributes to the interaction measure. By our estimate, in the interaction measure obtained by the lattice calculation, quark mass contributes less than (40-50)%. There are sizeable residue interactions in the deconfined phase.
1 Introduction
A new state of matter, the quark gluon plasma (QGP), has been expected since the 1970s of last century [1, 2, 3]. Its experimental production in heavy ion collisions is later well established by the evidences at RHIC [4, 5, 6, 7]. Many discussions have been focused on the question whether this plasma is weakly or strongly coupled [8].
The Hard Thermal Loop effective theory (HTL) is based on a physical picture of the QGP as a gas of weakly coupled quasi-particles — quarks or gluons with temperature dependent effective masses and couplings. It can well reproduce the thermodynamics from lattice data above , where is the deconfinement temperature [9, 10, 11, 12, 13, 14]. Even an ideal gas with thermal gluon mass can describe the gluon lattice data for thermodynamical quantities[15]. Thus, the thermodynamics obtained by lattice QCD appears to be consistent with a weak coupling picture of the QGP. However, the elliptic flow results at RHIC and the LHC suggest a rapid thermalization and a very small value of the viscosity-over-entropy-density ratio , which is inconsistent with the weak coupling calculations based on kinetic theory [8]. Such a small ratio can be obtained by the AdS/CFT correspondence at strong coupling[16, 17]. Thus, the small value of supports a strongly coupled QGP (sQGP).
It is intriguing that one system can be estimated as weakly coupled for some phenomena while strongly coupled for others. It is still conceivable since the coupling constant runs with the typical momenta exchanged in the interactions on different space-time scales [8].
The interaction measure, , defined in terms of the energy density and the pressure , is usually used to measure the interaction between partons in the lattice QCD. For an ideal gas with massless particles, energy density is equal to 3 times pressure and . It is thought that sizeable may indicate strong interaction. The lattice QCD calculations indeed find that is sizeable at temperature region [18], and it appears to support a strong coupling picture for the QGP. However, a non-interacting quasi-particle description with only temperature-dependent effective mass can also well explain the behavior of the interaction measure from lattice [15, 19, 20]. The aim of the present study is to give another explanation on the interaction measure obtained by lattice. We study a system without any interactions, i.e., an ideal gas with massive particles. We first calculate the energy density, the pressure and the . We find that their dependences on temperature reproduce the qualitative features of the lattice result. is nonzero for an ideal gas, which demonstrates that the particle mass contributes to the interaction measure. We then further show that, in contrary to [15, 19, 20], in our study the particle mass can not fully explain the interaction measure obtained by lattice. There are sizeable residue interactions in the deconfined phase. It may give us some new insight into the nature of the plasma above the deconfined point.
2 Thermodynamics of an ideal gas with massive particles
Since both the interaction and the particle mass contribute to the interaction measure, in this section we will study a system without any interactions, i.e., an ideal gas with massive particles, to separate their contributions. The reason we use an ideal gas is that we want to see the pure contribution of the particle mass when there are not any interactions.
For an ideal gas with particle mass at an equilibrium state described by , the standard formulas of the quantum statistics give the energy density
| (1) |
and the pressure
| (2) |
where is the degeneracy factor, and stands for the single-particle distribution function with
| (3) | |||
| (4) |
Using the relativistic dispersion relation , we obtain
| (5) |
The above equation tells us that the presence of mass always reduces the pressure below . It is easy to understand because massive particles move slowly at a given temperature and thus the thermal pressure reduces. The interaction measure is then
| (6) |
In the following we fix the chemical potential for comparison with lattice results. At , the pressure in equation (2), the energy density in (1) and the interaction measure in (6) are only functions of and . In this paper the integrals for the quantum statistics are done numerically.
Besides, we also do a Boltzmann statistics, i.e., the quantum distributions are replaced by the Boltzmann distribution in the above equations, which can be analytically done. For the pressure, a technique of integrating by parts with the relation is used. Finally we obtain
| (7) | |||
| (8) | |||
| (9) |
with .
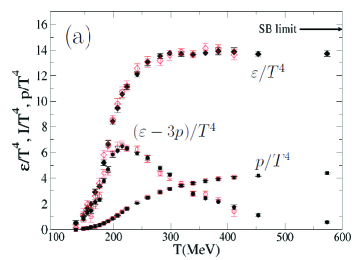
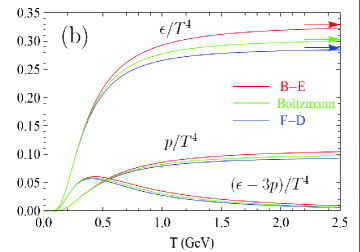
At fixed mass, e.g. GeV, , and are shown in figure 1(b), for both quantum statistics and Boltzmann statistics. For easy of comparing, the lattice results are shown in figure 1(a). The lattice studies the equation of state of a real QCD matter at . In figure 1(a), a continuous increase of the energy density and the pressure is seen, indicating a crossover between the hadron gas and the quark gluon plasma, which is confirmed by later reference [21]. There are more recent results [22, 23, 24] on the QCD equations of state than shown in figure 1(a) from reference [18]. In the temperature region (MeV), the interaction measure, denoted as in figure 1(a), is sizeable and does not vanish.
The analysis is as follow:
-
1.
In figure 1(b), and are increasing with and saturate at high temperature. At high temperature limit, and approach Stefan-Boltzmann limits marked as arrows in the figure. (The SB limits are given in Appendix A.) is nonzero and peaks at the temperature region where the pressure and the energy density increase rapidly, which is similar to the lattice result. It is interesting that, even an ideal gas has the similar trend as the lattice results for the QGP thermodynamics. Besides, another kind of a more complicated weak-coupling calculations from the kinetic theory[9, 10, 11, 12, 13, 14] can describe the lattice data not only the trend but also quantitatively. In addition, an ideal gas with temperature-dependent mass also leads to good agreement with lattice [15, 19, 20]. The system used here is quite simple, which only reproduce the qualitative features of thermodynamic quantities. The aim of this paper is to investigate how much the particle mass contributes to the interaction measure. By comparing our results with the lattice results, we can obtain the pure contribution of the particle mass. A quantitative analysis will be given in the subsequent paragraphs.
-
2.
As discussed before, for an ideal gas with massless particles, . In figure 1(b), it can be seen that is nonzero for an ideal gas with massive particles. The only difference between the two systems is the particle mass. Thus, the lesson we learn from here is that, a nonzero does not certainly mean strong coupling since the particle mass contributes to this quantity.
-
3.
Here we use GeV as an example to show the behavior of the interaction measure. Similar to the lattice result, there is a peak at the temperature region where the energy density and the pressure grow fast. By changing the particle mass, the curve of the interaction measure will shift its position, as shown in figure 2. The peak shifts to low for small mass and to high for large mass. And the peak height is independent on mass for an ideal gas. This statement is valid for an ideal gas with either quantum statistics or Boltzmann statistics.
-
4.
In figure 1(b), the peak height of for the ideal gas is 0.057 (this value is for Fermi-Dirac statistics, 0.059 for Boltzmann statistics, 0.061 for Bose-Einstein statistics), which is much smaller than the lattice calculation. In figure 1(a), the peak height is about 6.5, while newer results from HotQCD collaboration favor a value of about 5.0 for the peak height [22], and the continuum extrapolated result of the Wuppertal-Budapest collaboration indicates a peak height of about 4.1 [23]. The great disparity in peak height between figure 1(a) and figure 1(b) can be partly attributed to the number of degrees of freedom of constituent particles. The degeneracy factor in the ideal gas system in figure 1(b). However, in the QCD matter considered by lattice refers to a large number of degrees of freedom, including gluon and three flavor quark, anti-quark which further count color, spin degeneracy.
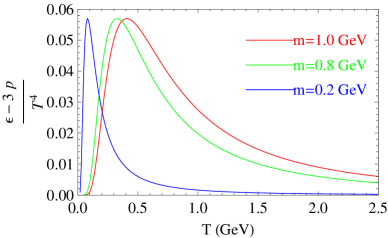
Figure 2: The mass dependence of the interaction measure. Red, green, blue lines are for mass 1.0, 0.8, 0.2 GeV respectively. This plot is calculated from Fermi-Dirac statistics.(Color online) Taking the pressure for an example. In an ideal multicomponent gas, the partial pressure of one component is , where the particle degeneracy factor represents the number of the internal degrees of freedom for the particle with mass , represents the pressure without any internal degrees of freedom. The total pressure of an ideal multicomponent gas can be expressed as
(10) Similarly,
(11) and the interaction measure is
(12) In lattice calculations, only quark mass contributes to the interaction measure since gluon is massless, according to equation (6). For three flavor QCD, there are two masses: and . for these two masses are peaks at different positions. According to (12), for the mixed gas will be a double-peak curve.
The maximum value of in equation (12), denoting as , is less than
(13) where represents the peak height of the curve with fixed mass . Since the peak height is independent on mass for an ideal gas, then . Thus we can infer that
(14) where for three flavor QCD, with the quark degeneracy [25]. Finally we get
(15) The value at the right hand side of the above equation is about 40% of the lattice result 5.0 reported by HotQCD Collaboration [22], and about 50% of the lattice result 4.1 reported by Wuppertal-Budapest Collaboration [23]. Therefore, from our analysis we can conclude that the pure contribution of the particle mass is not larger than (40-50)%.
In this paper, we only focus on the peak height which depends on the interaction. The peak position may also shift by additional interaction. Thus the peak position, i.e., the temperature where the interaction measure gets maximum, for an ideal gas can not be used to compare with that of the lattice QCD.
3 Conclusions
We use an ideal gas with massive particles to calculate the energy density, the pressure and the interaction measure, and compare them with that of the lattice results. An ideal gas has the similar trend as the lattice results for the QGP thermodynamics. We reproduce the qualitative features of the lattice results on the energy density, the pressure and the interaction measure by an ideal gas with massive particles. The interaction measure is nonzero for an ideal gas, which demonstrates that a nonzero does not certainly mean strong coupling. Particle mass can make the interaction measure nonzero. The measured in the lattice QCD includes the contribution from the particle mass because they indeed use quark mass in the lattice calculation [18, 26]. After counting the degeneracy number of the QGP, contributed by the particle mass explains less than (40-50)% of the lattice result. We infer that the other contribution comes from interaction. That means nonzero from lattice calculation does not mean strong coupling but does not exclude a strong coupling picture of QGP. It is still hard to know how strong is the coupling since it is hard to know the relation of the interaction measure with the coupling. The question how strong is the coupling needs further study.
Appendix A Stefan-Boltzmann limits
Stefan-Boltzmann limit is the value for a non-interacting gas with massless particles.
For Boltzmann particles, since for , equation (7)(8) becomes
| (16) | |||
| (17) |
Therefore,
| (18) |
as marked in figure 1(b).
References
References
- [1] Lee T D and Wick G C 1974 Phys. Rev. D 9 2291
- [2] Lee T D 1975 Rev. Mod. Phys. 47 267
- [3] Collins J C and Perry M J 1975 Phys. Rev. Lett. 34 1353
- [4] Arsene I et al(BRAHMS Collaboration) 2005 Nucl. Phys. A 757 1
- [5] Back B B et al(PHOBOS Collaboration) 2005 Nucl. Phys. A 757 28
- [6] Adams J et al(STAR Collaboration) 2005 Nucl. Phys. A 757 102
- [7] Adcox K et al(PHENIX Collaboration) 2005 Nucl. Phys. A 757 184
- [8] For a review, see Iancu E 2012 QCD in heavy ion collisions arXiv:1205.0579[hep-ph].
- [9] Andersen J O, Leganger L E, Strickland M and Su N 2011 J. High Energy Phys. JHEP08(2011)053
- [10] Kajantie K, Laine M, Rummukainen K and Schroder Y 2003 Phys. Rev. D 67 105008
- [11] Blaizot J P, Iancu E and Rebhan A hep-ph/0303185
- [12] Kraemmer U and Rebhan A 2004 RPP 67 351
- [13] Blaizot J, Iancu E and Rebhan A 1999 Phys. Rev. Lett. 83 2906
- [14] Andersen J O, Braaten E and Strickland M 1999 Phys. Rev. Lett. 83 2139
- [15] Peshier A et al1994 Phys. Lett. B 337 235
- [16] Policastro G, Son D T and Starinets A O 2001 Phys. Rev. Lett. 87 081601
- [17] Kovtun P, Son D and Starinets A 2005 Phys. Rev. Lett. 94 111601
- [18] Bernard C et al2007 Phys. Rev. D 75 094505
- [19] Engels J, Fingberg J, Redlich K, Satz H and Weber M 1989 Z. Phys. C 42 341
- [20] Goloviznin V and Satz H 1993 Z. Phys. C 57 671
- [21] Aoki Y et al2006 Nature (London) 443 675
- [22] Bazavov A (for HotQCD Collaboration) talk given in Quark Matter, August 16, 2012, and PoS(Lattice 2011)182
- [23] Borsanyi S et al2010 J. High Energy Phys. JHEP11(2010)077
- [24] Bazavov A et al(HotQCD Collaboration) 2009 Phys. Rev. D 80 014504
- [25] Wong C Y 1994 Introduction to High-Energy Heavy-Ion Collisions (World Scientific) p 165
- [26] Karsch F (for the RBC-Bielefeld Collaboration) hep-ph/0701210