The quasi-resonant variability of the massive LMC system BI 108
Abstract
The early B supergiant LMC star BI 108 is photometrically variable with a unique light curve; two strong periods are present in an almost precise 3:2 resonance. We collected spectroscopic data at VLT/UVES, sampling the supercycle of 10.733 days in ten epochs. We find spectral signatures for a SB2 system consisting of two massive B1 supergiants orbiting at the orbital period of 5.366 days. The shorter periodicity resembles the light curve of an eclipsing binary with periodicity 3.578 days that is not detected in the data. We discuss possible causes for the short periodicity and conclude that the quadruple system is the more plausible hypothesis.
keywords:
stars: early-type, stars: evolution, stars: binaries: close, stars: variables-others1 Introduction
The object LMC SC9-127519 (OGLE 051343.14-691837) was discovered as a variable star with unique photometric properties during our multiperiodicity search in the OGLE-II database (Szymanski 2005). Independently this object was announced as two binary systems in 3:2 resonance by Ofir (2008). With the coordinates, the magnitude () and the color (), the star was identified as BI 108 in the list of Brunet et al. (1975), for which they give a spectral type of b1-2111Spectral classes are written in lower-case letters when they have been determined from multicolor photometry.. Schmidt-Kaler et al. (1999) list b1:II: for the same star.
BI 108, in fact a binary or multiple system rather than a single star, is likely one of the brightest members of a young open cluster; NGC 1881 ( 6.7, Pietrzynski & Udalski 2000). Although the resonance is not absolutely perfect, such a near resonant and long-term stable period relation is very rare. In order to investigate the photometric behavior of BI 108 all available photometric data were used, as well as a set of 20 UVES observations to determine the spectroscopic behavior. Brief reports of our advances in the understanding of BI 108 were presented in recent conferences (Kołaczkowski et al. 2010; Rivinius et al. 2011).
2 Spectroscopic observations and archival data
We secured 20 spectra of BI 108 between October 1, 2008 and January 3, 2009, with the ESO VLT/UVES. The instrument was used in the 437/760 setting, covering most important Hei and Balmer lines and several other transitions of particular interest for hot stars. At a total of ten epochs two subexposures were taken with sec each, with a slit width of 0.8 arcsec, giving an effective resolving power of about 60 000. The resulting typical is between 90 and 100 for both arms of the instrument.
The UVES standard pipeline ran smoothly on our spectra providing wavelength calibrated 1-D spectra virtually free of instrumental artifacts. The spectra were continuum normalized and heliocentric corrected. The observing log is given in Table 1.
Apart from OGLE-II, data were extracted as well from the MACHO (MACHO object ID 79.5378.25) and the OGLE-III database (Udalski et al. 2008, LMC 111.2.62038). The MACHO data span seven and a half years (HJD 2 448 826.14 to 2 451 541.96), the OGLE-II data almost four years (HJD 2 450 457.76 to 2 451 872.75), and the OGLE-III data over almost eight years (HJD 2 452 167.64 to 2 454 951.52).
The photometric data of all three databases were joined for the analysis. Since the bands are slightly different, this was done the following way: for the time series analysis presented in Sect. 3.1 the mean magnitude was subtracted from each dataset. For the MACHO data, only observations where simultaneous blue and red points exist were accepted. The two measurements were averaged to reduce the individual uncertainty. Note that this combined dataset was only used to determine the periods, not for any other analysis. For the actual disentangling of the light curve we chose the OGLE-II data set only, in order to avoid problems due to the different filter bands of each dataset.
3 Photometric properties of the system

3.1 Time series analysis and disentangling
The time series analysis returns two very strong periods, given in Table 2. For reasons that will be shown later, the longer one will be called the orbital period () and the shorter one the resonant period (). From the light curve alone, however, this is by no means obvious. For none of the two periods is the associated variation sinusoidal in shape, for both the minima are more pronounced and sharper than the maximum associated variations. In fact both variations are of double wave nature.
| Spectrum | HJD | superphase | phase () | phase () |
|---|---|---|---|---|
| (label) | (-2 450 000) | 10.73 d | 3.58 d | 5.37 d |
| BI108-01 | 4 834.63285 | 0.0031 | 0.9318 | 0.0077 |
| BI108-02 | 4 834.65057 | 0.0047 | 0.9368 | 0.0110 |
| BI108-03 | 4 742.76051 | 0.4434 | 0.2546 | 0.8882 |
| BI108-04 | 4 742.77823 | 0.4450 | 0.2595 | 0.8915 |
| BI108-05 | 4 746.83997 | 0.8234 | 0.3947 | 0.6483 |
| BI108-06 | 4 746.85768 | 0.8251 | 0.3997 | 0.6516 |
| BI108-07 | 4 803.60272 | 0.1120 | 0.2593 | 0.2255 |
| BI108-08 | 4 803.62044 | 0.1137 | 0.2642 | 0.2288 |
| BI108-09 | 4 761.66650 | 0.2048 | 0.5386 | 0.4111 |
| BI108-10 | 4 761.68422 | 0.2065 | 0.5435 | 0.4144 |
| BI108-11 | 4 796.80764 | 0.4789 | 0.3601 | 0.9594 |
| BI108-12 | 4 796.82536 | 0.4806 | 0.3651 | 0.9627 |
| BI108-13 | 4 744.75145 | 0.6289 | 0.8110 | 0.2592 |
| BI108-14 | 4 744.76917 | 0.6305 | 0.8160 | 0.2625 |
| BI108-15 | 4 741.79717 | 0.3536 | 0.9853 | 0.7087 |
| BI108-16 | 4 741.81489 | 0.3553 | 0.9902 | 0.7120 |
| BI108-17 | 4 745.76182 | 0.7230 | 0.0934 | 0.4475 |
| BI108-18 | 4 745.77953 | 0.7246 | 0.0983 | 0.4508 |
| BI108-19 | 4 747.72260 | 0.9057 | 0.6414 | 0.8128 |
| BI108-20 | 4 747.74031 | 0.9073 | 0.6464 | 0.8161 |
The stronger variation is associated with the shorter period, d, with a peak-to-peak amplitude of about 0.18 mag. From the shape alone it is tempting to attribute it to an eclipsing binary nature (Fig. 1, lower curve in the upper panel), however, we will show later that at least spectroscopy shows no sign of any binary with that period.
The longer period shows weaker variations, with about 0.05 mag peak-to-peak, and has the value of d (Fig. 1, upper curve in the upper panel). In the case of the two half waves are indistinguishable in photometry, however, and the double wave nature is shown by spectroscopy.
The most interesting feature of both periods is that they have extremely similar superperiods, i.e. they are almost fully resonant with a ratio of , or d. Using the law of propagation of uncorrelated errors we find . This differs from 3/2 = 1.500000 by 0.000117 0.000006, i.e. at the 117/6 = 19.5 sigma level. The difference between the two superperiods is significant but so tiny, that we will come back to it in the discussion, but ignore it for the rest of this work. Instead, we use our OGLE-II superperiod of d (Rivinius et al. 2011) to analyze variability with the supercycle. The combined light curve phased with that superperiod is shown in the lower panel of Fig. 1. The minima of the combined curve are governed by the stronger variation with , while only modulates these minima, i.e. making them more or less deep. We choose the date of a deepest minimum as epoch, so that the ephemeris for the superperiod is
and the ephemerides for orbital and resonant period are
and
respectively.
| period | superperiod | amplitude | |
|---|---|---|---|
| [d] | [d] | [mag] | |
| 0.172, 0.171, 0.178 | |||
| 0.050, 0.047, 0.054 |
3.2 Stellar parameters
Using (for NGC 1881, Pietrzynski & Udalski 2000) and the interstellar extinction law derived by Schlegel et al. (1998), we calculated (indicating b0 II/III, Fitzgerald 1970), and mag. The corresponding figures for a b1 I b star are mag, , and mag, respectively (Fitzgerald 1970; Koornneef 1983). Although variability could affect some of these measurements (though not the MACHO colors, which are taken simultaneously), it is difficult to avoid the conclusion that the infrared colors are bluer than those of a typical b1 (or even b0 or late o type) supergiant.
If we use for the whole system, and assume two equal stellar components, we get for a single star. Using the distance modulus for the LMC of 18.5 mag (Pietrzyński et al. 2009), and the NGC 1881 reddening (Pietrzyński & Udalski 2000), we obtain . Using a bolometric correction of for a star with km s-1 and (Lanz & Hubeny 2007), as representative for BI 108, we get an absolute bolometric magnitude of . From the evolutionary tracks for stars by Maeder & Meynet (2001) this luminosity implies a total mass for the system of about 40 . The same exercise with four stars gives a total mass of about 60 .
The MACHO color term, , does not show any periodic signature, except a signal with a period of 23h56m, i.e. clearly related to Earth’s rotation, and apart from this no other variability at all above the statistical error, which is 0.01 mag.
Photometric data were retrieved from 2MASS and Spitzer observational databases and converted to fluxes using the virtual observatory tool VOSA222http://www.laeff.inta.es/svo/theory/vosa/ (Bayo et al. 2008), and compared to published spectral energy distributions. There is no evidence for any IR excess in BI 108, i.e. a significant flux contribution from a cooler component in the visual range is firmly excluded.
4 Spectroscopic variations
4.1 Spectral classification of the components
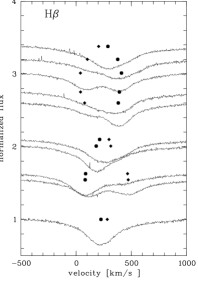
In the spectra the system obviously has SB2 nature and contains two similar components with spectral features of B1 Ib-II stars. Although both spectra are virtually identical in terms of lines present and , in the combined light one component produces, on average, slightly weaker lines (and as will be seen from the RV curve is as well less massive). In the following, this star as being the secondary of the current configuration, will be denoted star #2, while the other one will be star #1.
At quadratures the spectral lines are almost separated and can easily be compared to synthetic and other template spectra. A comparison with the B1Ib-II galactic star HD 54 764 gives an almost perfect match between line profiles (even in km s-1).
The line ratio HeI 4387/OII 4416 is a useful luminosity indicator.333http://nedwww.ipac.caltech.edu/level5/Gray/frames.html The average value is for star #1 and for star- #2, in agreement with a luminosity class I/II derived from the visual classification above.
In spite of what is said above about one star on average being brighter than the other, in some of the quadrature phases the two spectra appear of almost equal strength, i.e. the relative contributions from each star to the equivalent width (EW) are variable. This behavior is discussed in detail below, here it is sufficient to say that the spectral types, understood as defined by spectral line ratios, for instance Hei 4471/Mgii 4481, do not change significantly with the variable EW.
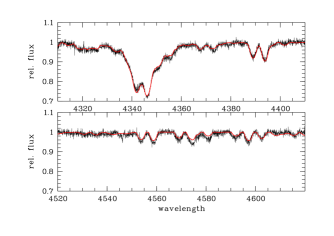
In order to obtain individual stellar parameters for both components, the combined spectrum was modeled using the grid of synthetic spectra published by Lanz & Hubeny (2003, 2007)444http://nova.astro.umd.edu/Tlusty2002/tlusty-frames-models.html. A multi-parameter fit of those models was done to the UVES data taken at good separation of both components (HJD 2 454 747, ). The fit parameters were effective temperature, surface gravity (in the range 25 kK – 30 kK, 3 – 4), radial velocities and for each component, as well as the relative flux contribution of secondary component, fixed as unity for the primary (see Table 3). The calculations were done for models with the average LMC metallicities and microturbulence velocities and km s-1. While the hydrogen and helium lines are rather insensitive, the higher microturbulence gives the better fit for the metal lines (Fig. 2).
| Parameter | star #1 | star #2 |
|---|---|---|
| [K] | 27 500 250 | 27 500 250 |
| 3.75 0.05 | 3.5 0.05 | |
| [km s-1] | 116 5 | 116 5 |
| [km s-1] | 401 2 | 75 2 |
| relat. flux contrib. | 1.0 0.02 | 0.88 0.02 |
| Property | Value | Property | value |
|---|---|---|---|
| 0.75 | 19 | ||
| 0.08 | 14.5 | ||
| 93 | 33.5 | ||
| 41.5 |
4.2 Time series analysis and disentangling
We measured RVs for both components by finding line centers with deblending algorithms, as well by cross correlation of selected spectral regions with templates, but by far the best result was obtained by Fourier disentangling the spectra with the virtual observatory program KOREL555http://www.asu.cas.cz/ had/korel.html (Hadrava 1995; Škoda & Hadrava 2010). Although robust in spectral disentangling and binary parameter determination, KOREL does not provide the zero point of velocity neither meaningful errors for the system parameters.
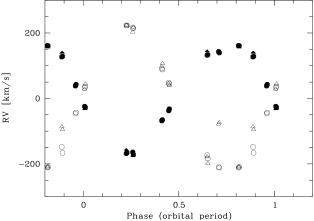
The corresponding velocities show that d is clearly a binary orbital period and suggests a near circular orbit (Fig. 3). The period = 3.577 d is actually not present in the RVs. The fit for H RVs gives km s-1 and km s-1, i.e. a mass ratio of about 0.75.
The analysis gives a small non-zero eccentricity of about with a longitude for the periastron of degree. Similar figures were obtained by using the strongest Siiii lines, providing extra confidence on the above results. While this small eccentricity is compatible with plus non-zero noise, we note the system is relatively young, so a not fully completed circularization is entirely possible. Residual radial velocities, corrected for orbital motion with these parameters, are not sorted with , i.e. that period does not reflect in the orbital dynamics of the binary system. The entire set of derived parameters is given in Table 4.
We calculated independent system parameters with PHOEBE (Prsa et al. 2011) using the disentangled orbital light curve and assuming = = 27500 , = 5.36654 d, = 0.75, = 0 and no third light. Also we assumed a detached configuration and synchronous rotation of both components. We find = 47 , = 60.3 degree, stellar potentials 3.95 and 4.15 for the gainer and donor, respectively. This solution implies = 27.7 , = 20.8 , = 15 , = 11.8 . These photometrically derived masses and orbital separation are consistent with the spectroscopic values given in Table 4 for an inclination angle of 62 degree.
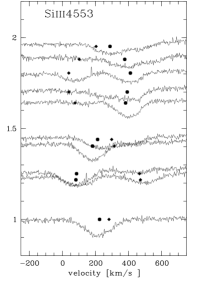
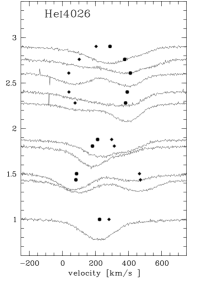
The equivalent widths of lines of both stellar components are highly variable and roughly anticorrelated. The sum of both does vary as well, but with much lower amplitude. Unfortunately, with the available data it cannot be decided whether or does sort the data better. Similarly, the line widths are variable (see Fig. 4), with no clear preference for one of the two periods.
5 Discussion
Ofir (2008) originally suggested a quadruple star in (Aa+Ab)+(Ba+Bb) configuration to explain the light curve of BI 108. Similarly, the light curve of CzeV343 was modeled as a double eclipsing binary with periods near a 3:2 ratio (Cagaš & Pejcha 2012). These authors speculate that this resonance might be the result of Kozai cycles and tidal friction during the evolution of a quadruple system, but recognize the lack of theoretical work to confirm this conjecture and that a simple coincidence cannot be discarded. In the case of BI 108, the proximity to perfect resonance is 0.008% (compared with 0.1% for CzeV343) but the circularity of the orbit is in principle inconsistent with Kozai cycles; they tend to increase the ellipticity of central binaries in multiple systems.
For BI 108 the absence of color variations would require the Ba+Bb system has equal components. To make Ba+Bb as dim as possible (in order to hide eventual spectral features), one has to demand that the eclipse in the light-curve is total, such that the entire Ba+Bb subsystem contributes about 20% to the total flux as indicated by the photometric variability. Under such assumptions the individual magnitudes would be 14.3 for Aa and Ab each, and 15.8 for Ba and Bb each, i.e. the subsystem A providing about 80% of the total light in the -band light curve. Rapid rotation (beyond corotation of the order of 200 km s-1) for both components of Ba+Bb would still be required in order to hide spectral features from this pair from detection in the high data. Taking all the above together, such a quadruple system cannot be ruled out and in spite of the lack of theoretical understanding, this will still turn out to be the hypothesis matching the requirements of Occam’s razor.
Another possible multiple system would consist of three stars in non-hierarchical orbits A+B+C, where is the result of eclipses of the brighter component A by both B and C. Indeed some stable solutions exist for the unrestricted three body problem, for instance those found by Lagrange where three bodies orbit at the vertices of a rotating equilateral triangle. However, this would not only require a parameter fine-tuning beyond belief, but probably would still not be stable in a real stellar system undergoing stellar evolution.
If there would be only two stars, they would show variability somehow resonantly synchronized with the orbit. Whatever this mechanism is, to achieve it, the two components must exert force on each other. This could be done through magnetic fields modifying the chemical element distribution on the stellar surfaces, hence producing line and continuum flux variability (Krtička et al. 2007). Historically, it has been assumed that magnetic fields in OB stars are very rare if not absent. However, according to Petit (2011), “… the increasing discoveries of fields in early B-type stars on the main sequence and pre-main sequence and in both young and evolved O-type stars show convincingly that fossil fields can and do exist in stars with masses as large as 45 solar masses“. However, in BI 108 magnetic fields can be excluded with high probability, due to the missing signatures of chemical inhomogeneities in the spectral lines.
It has been shown that excitation of resonant non-radial -mode pulsations should be a common phenomenon during tidal evolution of eccentric double main sequence binaries and it is also an effective mechanism for orbital decay (Witte & Savonije 1999, 2001). Although this is a promising mechanism for explaining the variability in principle, it is difficult to imagine how it could generate the amplitude observed in the light curve. This would require strongly perturbed stars, the visible stellar surface in the system varying by as much as 20 % between maximum and minimum. Thus, other than for the double binary hypothesis, there is a theoretical framework for the variability, however the observed strength of the variation goes far beyond what has been explored in this framework. For this reason we consider it a less likely option than the double binary hypothesis, but note that neither can it be firmly ruled out.
6 Conclusions
We have presented the first spectroscopic study of the LMC system BI 108 showing an unique 3:2 resonant photometric variability. The immediate goal of the study was to determine which of the two periods (if not both) was due to an eclipsing binary. From the shape of the light-curves, it was originally expected that would turn out to be the binary period. Surprisingly the radial velocities point to a SB2E system orbiting with orbital period instead.
The mechanism responsible for remains unknown, but with the present data we exclude a system with three components and magnetic interaction between two binary components. The 3:2 resonant tidal bulge would require amplitudes beyond what can realistically be expected from such a mechanism. The remaining suggestion, a double binary system seen by chance (or eventually by still unknown dynamical reasons) with a period ratio near 3:2, remains as the most plausible hypothesis.
Acknowledgments
We acknowledge an anonymous referee for helping to improve a first version of this manuscript. ZK acknowledges support by Polish NCN grant 2011/03/B/ST9/02667. REM acknowledges support by Fondecyt grant 1110347 and BASAL PFB–06/2007. We acknowledge Dr. Moffat for useful comments on a first version of this manuscript. We also thank Igor Soszynski for reading the manuscript and Daniela Barría for running PHOEBE.
References
- Bayo et al. (2008) Bayo A., Rodrigo C., Barrado Y Navascués D., Solano E., Gutiérrez R., Morales-Calderón M., Allard F., 2008, A&A, 492, 277
- Cagaš & Pejcha (2012) Cagaš P., Pejcha O., 2012, A&A, 544, L3
- Fitzgerald (1970) Fitzgerald M. P., 1970, A&A, 4, 234
- Hadrava (1995) Hadrava P., 1995, A&AS, 114, 393
- Kołaczkowski et al. (2010) Kołaczkowski Z., Mennickent R., Rivinius T., 2010, in Prša A., Zejda M., eds, Binaries - Key to Comprehension of the Universe Vol. 435 of Astronomical Society of the Pacific Conference Series, The Study of Resonant Variability Observed in the Massive LMC System BI 108. p. 403
- Koornneef (1983) Koornneef J., 1983, A&A, 128, 84
- Krtička et al. (2007) Krtička J., Mikulášek Z., Zverko J., Žižńovský J., 2007, A&A, 470, 1089
- Lanz & Hubeny (2003) Lanz T., Hubeny I., 2003, ApJS, 146, 417
- Lanz & Hubeny (2007) Lanz T., Hubeny I., 2007, ApJS, 169, 83
- Maeder & Meynet (2001) Maeder A., Meynet G., 2001, A&A, 373, 555
- Ofir (2008) Ofir A., 2008, Information Bulletin on Variable Stars, 5868, 1
- Petit (2011) Petit V., 2011, in Neiner C., Wade G., Meynet G., Peters G., eds, IAU Symposium Vol. 272 of IAU Symposium, Observations of magnetic fields in hot stars. pp 106–117
- Pietrzyński et al. (2009) Pietrzyński G., Thompson I. B., Graczyk D., Gieren W., Udalski A., Szewczyk O., Minniti D., Kołaczkowski Z., Bresolin F., Kudritzki R., 2009, ApJ, 697, 862
- Pietrzynski & Udalski (2000) Pietrzynski G., Udalski A., 2000, Acta Astron., 50, 337
- Prsa et al. (2011) Prsa A., Matijevic G., Latkovic O., Vilardell F., Wils P., 2011, Astrophysics Source Code Library, p. 6002
- Rivinius et al. (2011) Rivinius T., Mennickent R. E., Kołaczkowski Z., 2011, in Neiner C., Wade G., Meynet G., Peters G., eds, IAU Symposium Vol. 272 of IAU Symposium, The resonant B1II + B1II binary BI 108. pp 541–542
- Schlegel et al. (1998) Schlegel D. J., Finkbeiner D. P., Davis M., 1998, ApJ, 500, 525
- Schmidt-Kaler et al. (1999) Schmidt-Kaler T., Gochermann J., Oestreicher M. O., Grothues H., Tappert C., Zaum A., Berghöfer T., Brugger H. R., 1999, MNRAS, 306, 279
- Szymanski (2005) Szymanski M. K., 2005, Acta Astron., 55, 43
- Udalski et al. (2008) Udalski A., Szymanski M. K., Soszynski I., Poleski R., 2008, Acta Astron., 58, 69
- Škoda & Hadrava (2010) Škoda P., Hadrava P., 2010, in Prša A., Zejda M., eds, Binaries - Key to Comprehension of the Universe Vol. 435 of Astronomical Society of the Pacific Conference Series, Fourier Disentangling Using the Technology of Virtual Observatory. p. 71
- Witte & Savonije (1999) Witte M. G., Savonije G. J., 1999, A&A, 350, 129
- Witte & Savonije (2001) Witte M. G., Savonije G. J., 2001, A&A, 366, 840