Towards an optimized design
for the Cherenkov Telescope Array
Abstract
The Cherenkov Telescope Array (CTA) is a future instrument for very-high-energy (VHE) gamma-ray astronomy that is expected to deliver an order of magnitude improvement in sensitivity over existing instruments. In order to meet the physics goals of CTA in a cost-effective way, Monte Carlo simulations of the telescope array are used in its design. Specifically, we simulate large arrays comprising numerous large-size, medium-size and small-size telescopes whose configuration parameters are chosen based on current technical design studies and understanding of the costs involved. Subset candidate arrays with various layout configurations are then selected and evaluated in terms of key performance parameters, such as the sensitivity. This is carried out using a number of data analysis methods, some of which were developed within the field and extended to CTA, while others were developed specifically for this purpose. We outline some key results from recent studies that illustrate our approach to the optimization of the CTA design.
Keywords:
gamma-rays: observations, instrumentation: detectors:
95.45.+i, 95.55.-n, 95.55.Ka, 95.75.-z, 95.85.Pw1 Performance of the Candidate Arrays
We evaluate the performance of CTA candidate arrays, which are compared in Fig. 1 in terms of their differential sensitivity, calculated using our baseline analysis Bernlohr et al. (2012). The candidate array layouts comprise varying numbers of large-size (LSTs), mid-size (MSTs) and small-size (SSTs) telescopes that are selected according to a fixed estimated total cost from a large telescope configuration known as production 1 (prod). Part of the simulations were performed by using a distributed approach within the European Grid Initiative Komin et al. (2011). For the upcoming prod, a Grid-based simulation and analysis pipeline is being prepared. Arrays E and I are so-called balanced arrays (balanced in terms of the distribution resources across energy range of CTA), and thus are well-suited for evaluating the effects of different analysis methods or telescope designs.
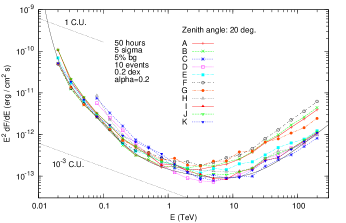
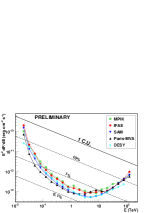
We verify that configurations selected to be optimal using the baseline analysis also reach close to the optimal sensitivity when employing alternative analysis methods (see descriptions in Bernlohr et al. (2012); Becherini et al. (2012)). Fig. 1 illustrates the effect of these methods on sensitivity for the array I, which consists of 3 LSTs each with field of view (FoV), 18 MSTs with FoV, and 56 SSTs with FoV. While most methods are under development, some already approach differential sensitivity levels of 2 milli-C.U. 111 (Crab Unit) in the core range around 1 TeV. This minimum detectable flux is determined conservatively, using bins per decade in energy and demanding, for a given bin, a minimum detection (using Eq. 17 from Li & Ma Li and Ma (1983) and 5 background control regions), -ray events, and that the -ray excess be greater than of the residual background.
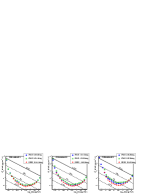
We are also investigating the off-axis performance of CTA. Fig. 2 shows the off-axis differential sensitivity for offset angles out to calculated using two analyses for array E, which comprises 4 LSTs with FoV, 23 MSTs with FoV, and 32 SSTs with FoV. While the off-axis analysis algorithms are expected to have room for improvement, these results indicate that the point-source differential sensitivity in the energy range of GeV to TeV may be well below C.U. out to offsets of at least off-axis.
2 LST optics and camera design
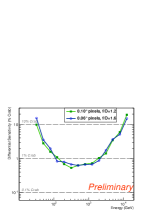
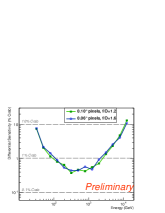
The LSTs are simulated in prod with a parabolic dish shape of focal length and area , coupled with pixels. Mechanical constraints of the envisaged LST structure impose a maximum . In a dedicated study, we simulate an alternative design with and pixels, and use an intermediate dish shape to mitigate the degradation of the optical PSF given by the reduced , where is the mirror diameter. We also simulate an idealized design with , and pixels. Results show that the mean Hillas width Hillas (1985) of small gamma-ray images, with Hillas sizes of around 100 p.e., are 20% smaller for the idealized case. However, this does not translate to an improvement in gamma-hadron separation power, as indicated in Fig. 3, which compares the realistic and idealized designs of two LST arrays.
The LST and FoV parameters are being tuned for prod by using a toy model, which estimates the relative sensitivity in the LST-dominated energy range of GeV, at a fixed LST array cost. The model is based on prod simulations and assumes that the background control region size depends on the angular distance between the source position and camera center, and that sensitivity scales as , where is the number of LSTs. Based on the relative sensitivity tradeoff between and FoVs, we find, for point-like sources, that optimal values are close to and . For extended sources (), the optimal values become larger: , .
3 Observations under partial moonlight
Observations under moonlight conditions permit to extend the observing time by as much as 30%, based on experience with MAGIC Britzger et al. (2009) and VERITAS, and are important for the detection of transient phenomena. To estimate the performance of CTA under moonlight conditions, MC simulations with a factor 4.5 higher night sky background (NSB) have been performed. This corresponds to nights with the Moon above the horizon, illuminated at . In the core energy range around 1 TeV, analysis results indicate a similar performance to the one for dark sky conditions, in terms of sensitivity, angular resolution and energy resolution. However this is not the case for the low energy regime. Here, due to the higher noise levels, the energy thresholds are generally a factor of 2 higher, although this number depends on the array layout.
4 Readout simulations
A number of tools exist to simulate the optical and electronic designs being evaluated within CTA (see Bernlohr et al. (2012) for a brief overview). Here we outline ongoing studies that focus on the design of the camera readout. One such study Vorobiov et al. (2011) aims to optimize the pixel integration time window, which, given the short time scale of Cherenkov light flashes, can minimize the error in collected pixel signal charge over NSB fluctuations. For short integration times, the pixel charge resolution degrades due to Cherenkov light fluctuations, while for longer times the NSB dominates. A dynamic integration window, whose duration varies as a function of signal amplitude, may improve charge resolution over a fixed duration window. Under dark sky conditions, any improvements are expected to be very small, as the Poissonian fluctuations of the Cherenkov signal dominate. However under partial moonlight or Galactic plane observations more significant improvements can be envisaged. A complementary study Naumann et al. (2011) proposes a flexible readout scheme in which only the pixels around the core of the shower image are recorded, with the aim of reduced data rates and effective dead times. The scheme would employ lower threshold local trigger information to define regions of interest in the camera and follow the shower temporal development, while a higher threshold trigger would trigger the camera readout.
References
- Bernlohr et al. (2012) K. Bernlöhr et al, upcoming Special Issue on CTA of Astropart. Phys. (2012).
- Komin et al. (2011) N. Komin et al., http://hal.archives-ouvertes.fr/hal-00653017 (2011)
- Becherini et al. (2012) Y. Becherini, B. Khélifi, S. Pita, M. Punch et al., Advanced analysis and event reconstruction for the CTA Observatory, these proceedings (2012).
- Li and Ma (1983) T.P. Li & Y.Q. Ma, ApJ 272 317 (1983).
- Hillas (1985) A.M. Hillas, Proc. 19 ICRC Vol. 3, 445 (1985)
- Britzger et al. (2009) D. Britzger et al., Proc. 31 ICRC 2009 (arXiv:0907.0973)
- Vorobiov et al. (2011) S. Vorobiov, et al., NIM A, DOI : 10.1016/j.nima.2011.10.048 (2011).
- Naumann et al. (2011) C. L. Naumann et al, NIM A, DOI : 10.1016/j.nima.2011.11.008 (2011).