On the Branching in the Emission Relations of Ca ii lines in Solar Prominences
Abstract
Spatially well resolved spectra of the emission lines Ca ii K, Ca ii 8542 and H are analyzed in solar prominences. It is confirmed that the branching in the emission relations of Ca ii versus H correlates with the magnitude of non-thermal (turbulent) broadening.
keywords:
Prominences, Quiescent, Ca ii emission, branching1 Introduction
High precision spectroscopy of spatially and spectrally well resolved emission lines in quiescent prominences indicates that the simple concept of an average state for prominence matter can only be considered as a first-order approximation. The ratio of the integrated line intensity (’radiance’) and shows a noticeable increase in fainter (outer) parts of prominences.
Other examples are the significant differences (’branching’) in the relations (a) of the radiance E(Ca ii K) vs E(Ca ii 8542) found by Landman and Illing (1977); (b) of the radiance E(Ca ii K, H) vs ) found by Stellmacher (1978); and (c) of the central line intensity (Ca ii K) vs (H) found by Engvold (1978).
The branching in the Ca ii H&K radiance is accompanied by a concomitant variation of the widths of the Balmer lines relative to those of the Ca ii H&K lines (Stellmacher 1979). It has been conjectured whether magnetic field coupling may produce selective non-thermal broadening of the Ca ions. However, such an effect was not found in the analysis by Landman et al. (1977).
In the present work we discuss the branching in the emission relations of Ca ii K on the basis of new observations of the three emission lines Ca ii K, H, and Ca ii 8542 (’IR’), obtained at good spatial and spectral resolution.
2 Observations
A set of spectra of the three lines was obtained photographically using a new type of proximity focused image intensifier (PROXITRONIC, Germany; single-stage) in the focal plane of the Czerny-Turner spectrograph at the Locarno station of the Göttingen Observatory (cf. Wiehr et al, 1980). The linear dispersion amounts to 0.115, 0.145, and 0.227 Å/mm for Ca ii K, H and Ca ii IR, respectively.
| 09:00 | east limb, N | 2.65 | ||||
| 09:27 | west limb, S | 0.89 | ||||
| 12:20 | west limb, S | 5.01 | ||||
| 12:40 | east limb, N | 5.28 | ||||
| 12:50 | east limb, S | 9.71 |
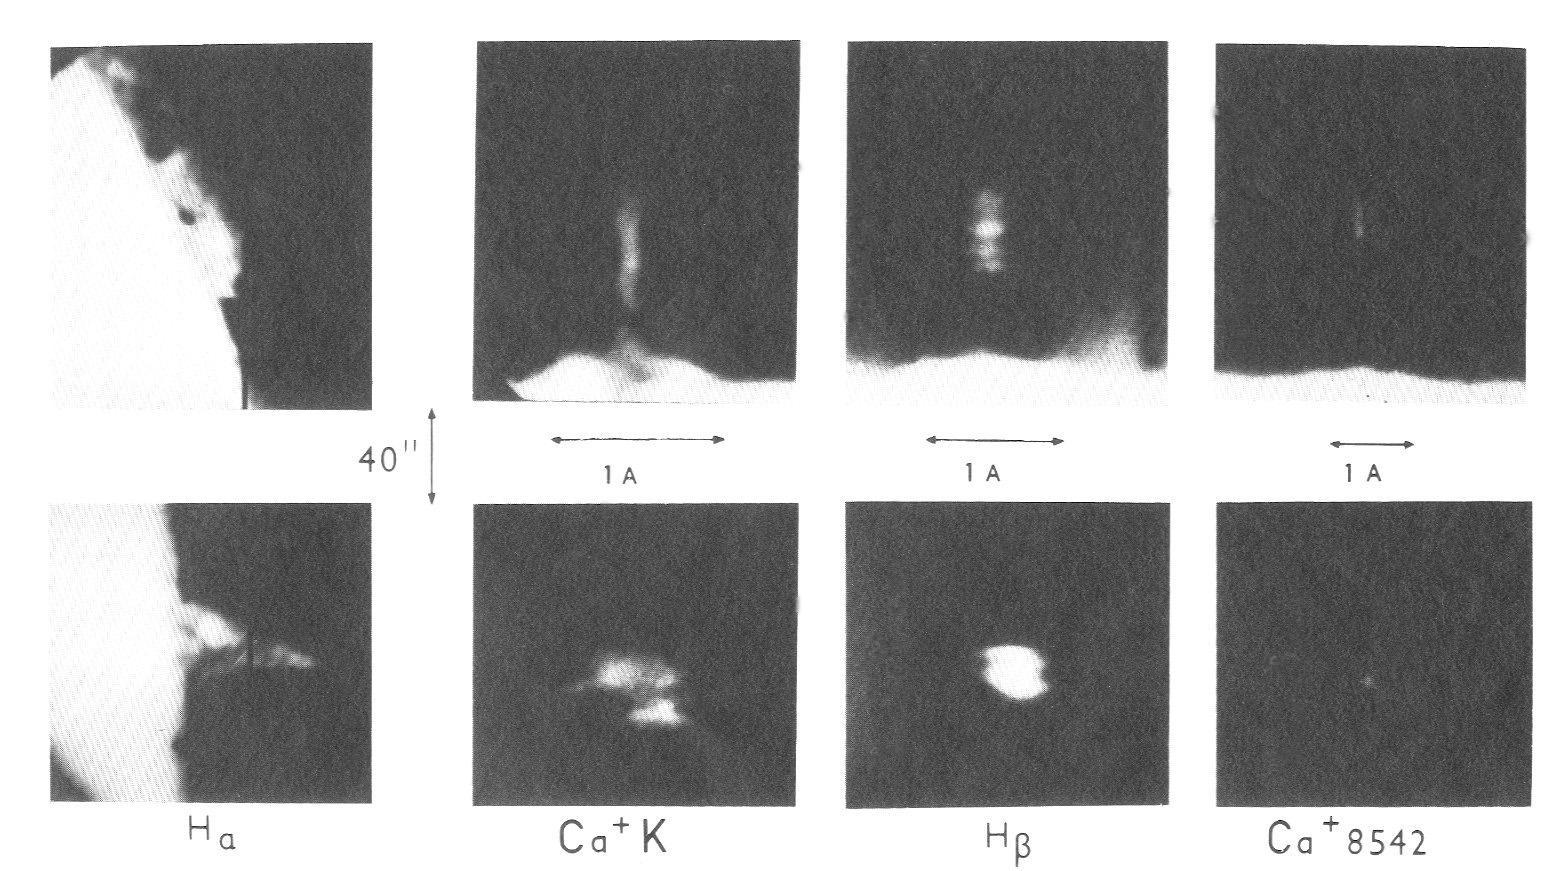
The spectra were taken with an exposure time of sec for the two Ca ii lines, while the typical exposure time for H was sec; a total set of the three lines was obtained in min. H slit-jaw images were taken for each set of spectra on Kodak SO-392 film. A slit width of was used, corresponding to a spatial resolution of 1.24 arcsec.
For the photometric calibration of the spectra we placed a wedge in front of the entrance slit, illuminated by a (de-focused) quiet region at disk-center. The absolute prominence emission was deduced from disk-center spectra calibrated with the reference continua given by Labs and Neckel (1968). For the K-line we used the value of 0.82 given by White and Suemoto (1968) for Å relative to an assumed continuum window at Å.
The micro-photometry was performed with the photometer of the Institut d’Astrophysique de Paris (Brückner 1961). The properly scaled scattered-light intensity-profiles were subtracted from each scan of the prominence emission lines. All spectra were observed on July 18, 1979, a day with stable seeing conditions. The observed prominences are listed in Table 1. Two examples of a complete set of emission spectra are shown in Figure 1.
3 Line Widths
If we suppose that for optically thin prominence emissions, the thermal and non-thermal line broadening constitute the only significant mechanism, we may deduce mean values of the kinetic temperature, , and the non-thermal broadening, from the observed line profiles: those from atoms of small mass (e.g. H with ) depend mostly on , while those from atoms with large mass (e.g. Ca with ) are dominated by non-thermal broadening.
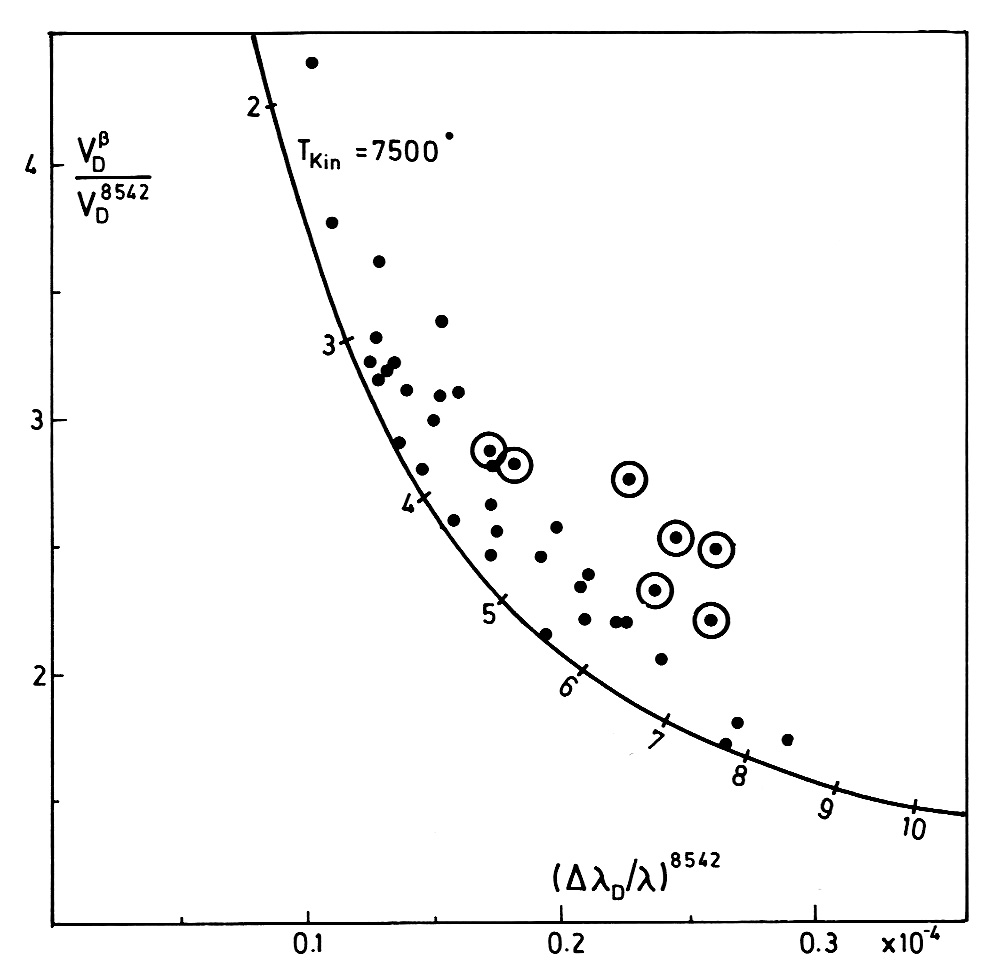
In Figure 2 we give the ratio of the reduced Doppler widths, , for H and Ca ii IR as a function of (Ca ii IR). [In the case of non Gaussian profiles is defined as half width at .] It can be seen that the observations follow the general trend of a calculated curve:
with parameters K and 3 km/s km/s adapted to the lower limit of the data. These well agree with those by Hirayama (1978), who obtained 4500 K K and 3 km/s km/s. Similar values were also deduced by Landman et al. (1977) from their analysis of the widths of H, He D3 and Ca ii IR.
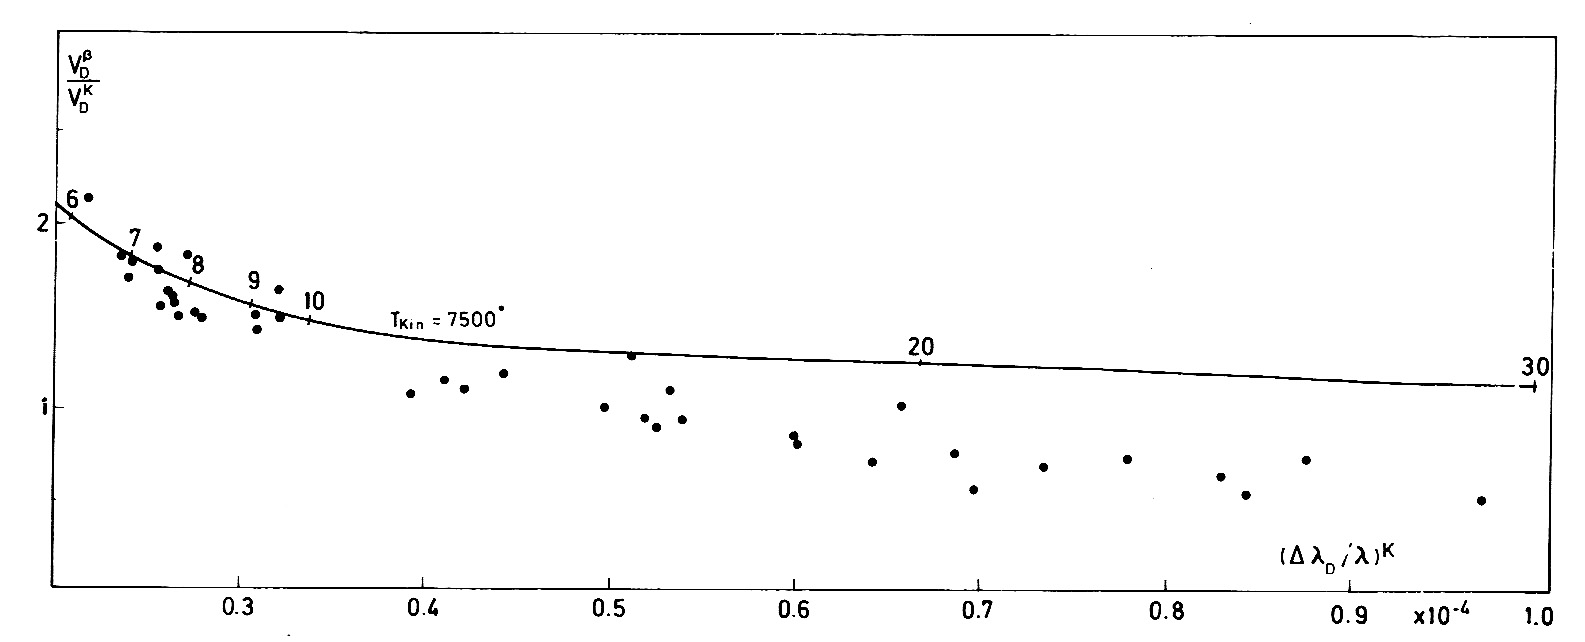
A corresponding plot for the observed widths of H and Ca ii K (Figure 3) shows stronger deviations from the calculated curve in the sense of additional broadening of the Ca ii K lines. This may be due to self-absorption, but also to unresolved macro-shifts, visible in some Doppler-shifted emission ejecta (see also Engvold and Malville, 1977).
4 Emission Relation
The emission relations of Ca ii H, K and H, H show a branching that depends on the widths of the Ca ii lines (Stellmacher 1979). The non-thermal broadening, , widens the profiles and reduces their central intensity, ; the integrated intensity (’line radiance’) remains unchanged, except for the optically thick case.
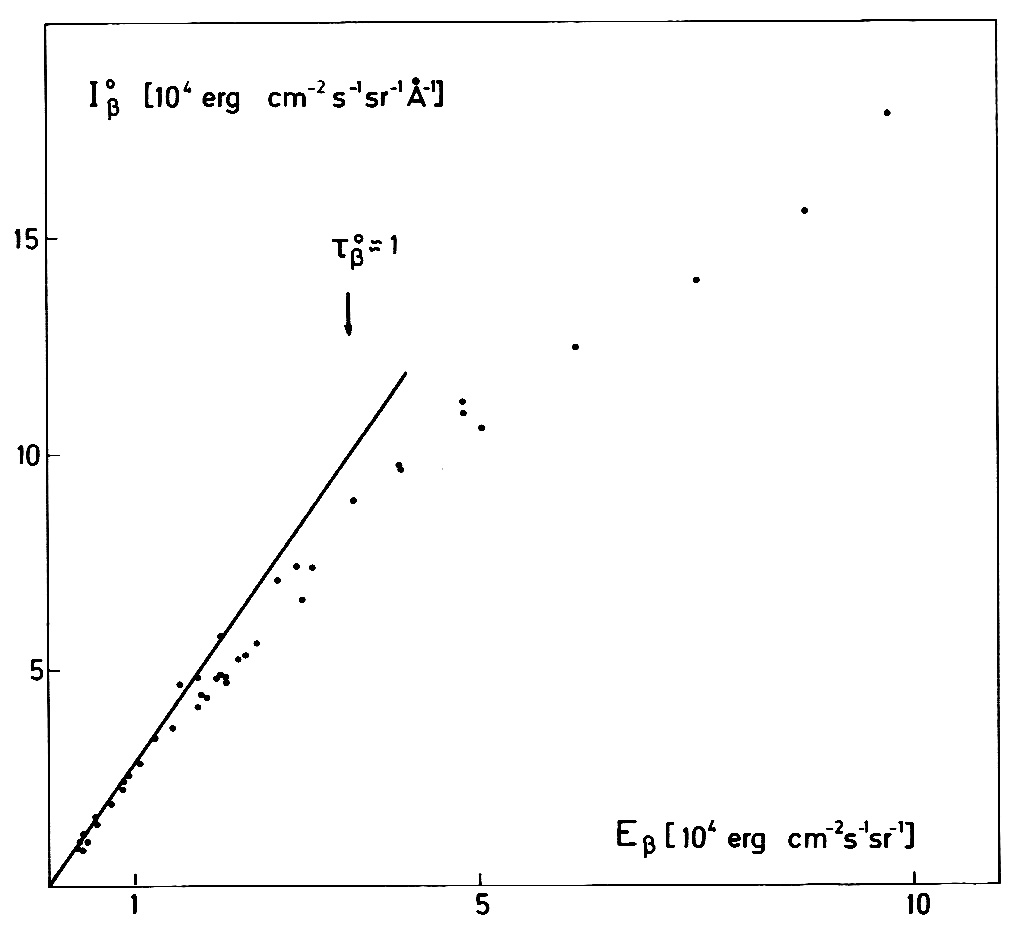
For an optically thin line with pure Gaussian profile it is . The relation of observed and shows for H (Fig. 4) a smaller scatter than for Ca ii IR (Fig. 5). This reflects the strong dependence of the latter on the non-thermal broadening, , which varies by more than a factor of three (cf., Figure 2), whereas H depends mostly on the (much less varying) . The tight relation of and (Figure 4) allows one to use as a measure for the total thickness of the prominence (i.e. its number-density).
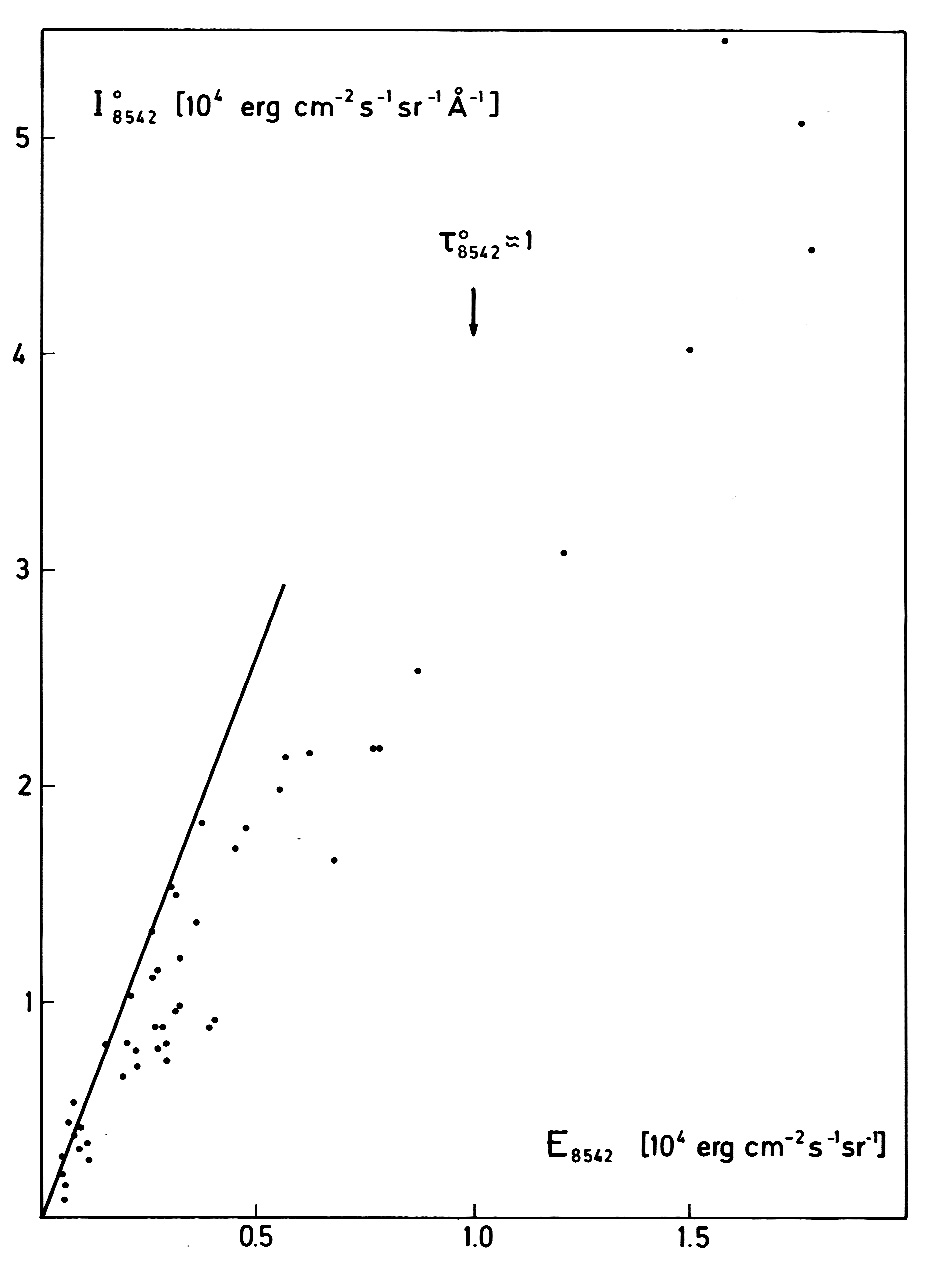
The steepest slopes in the two plots correspond to narrowest reduced widths and , respectively. Inserted into formula 1 these give K and km/s. We note that for Ca ii IR our relation versus well agrees with the one given Landman (1979).
The bending in the observed relation vs E (Fig. 4) shows that saturation becomes effective for the H emission. For an estimate of the H optical thickness, we use the H optical thickness, , which Stellmacher (1969) gives for erg/(s cm2 ster). With , we deduce a corresponding H optical thickness of . Based on this value, we can now determine for a mean H radiance erg/(s cm2 ster). [Similar values are obtained on the basis of the analysis by Landman and Mongillo (1979).] The widths of the seven broadest H lines in Figure 4 with erg/(s cm2 ster), where saturation becomes important, are encircled in Figure 2.
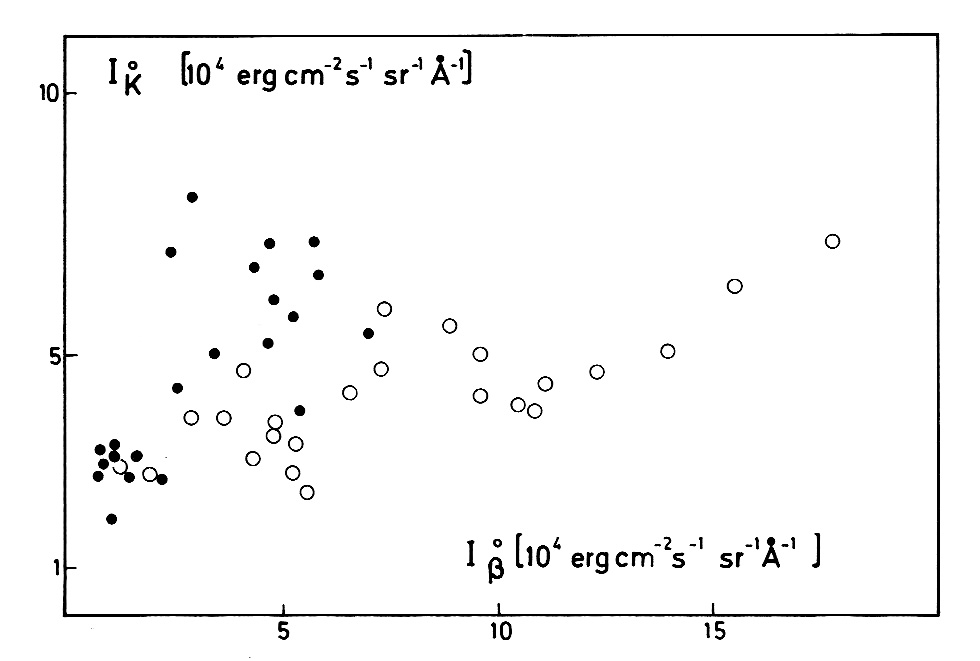
Figure 6 shows the central intensity of the observed Ca ii K line versus that of the corresponding H line, (the latter giving the total prominence thickness as argued above). The observed relation can be separated into two distinct branches defined by the ratio of their reduced Doppler width from Figure 3. The upper branch (full dots in Fig. 6) contains data with , which are characteristic for narrow Ca ii K profiles ( in Fig. 3). The lower branch (open circles in Fig. 6) contains data with , which are characteristic for broad the Ca ii K profiles in Figure 3. Hence, the difference in the central Ca ii K intensity for a given reflects their strong sensitivity to non-thermal broadening.
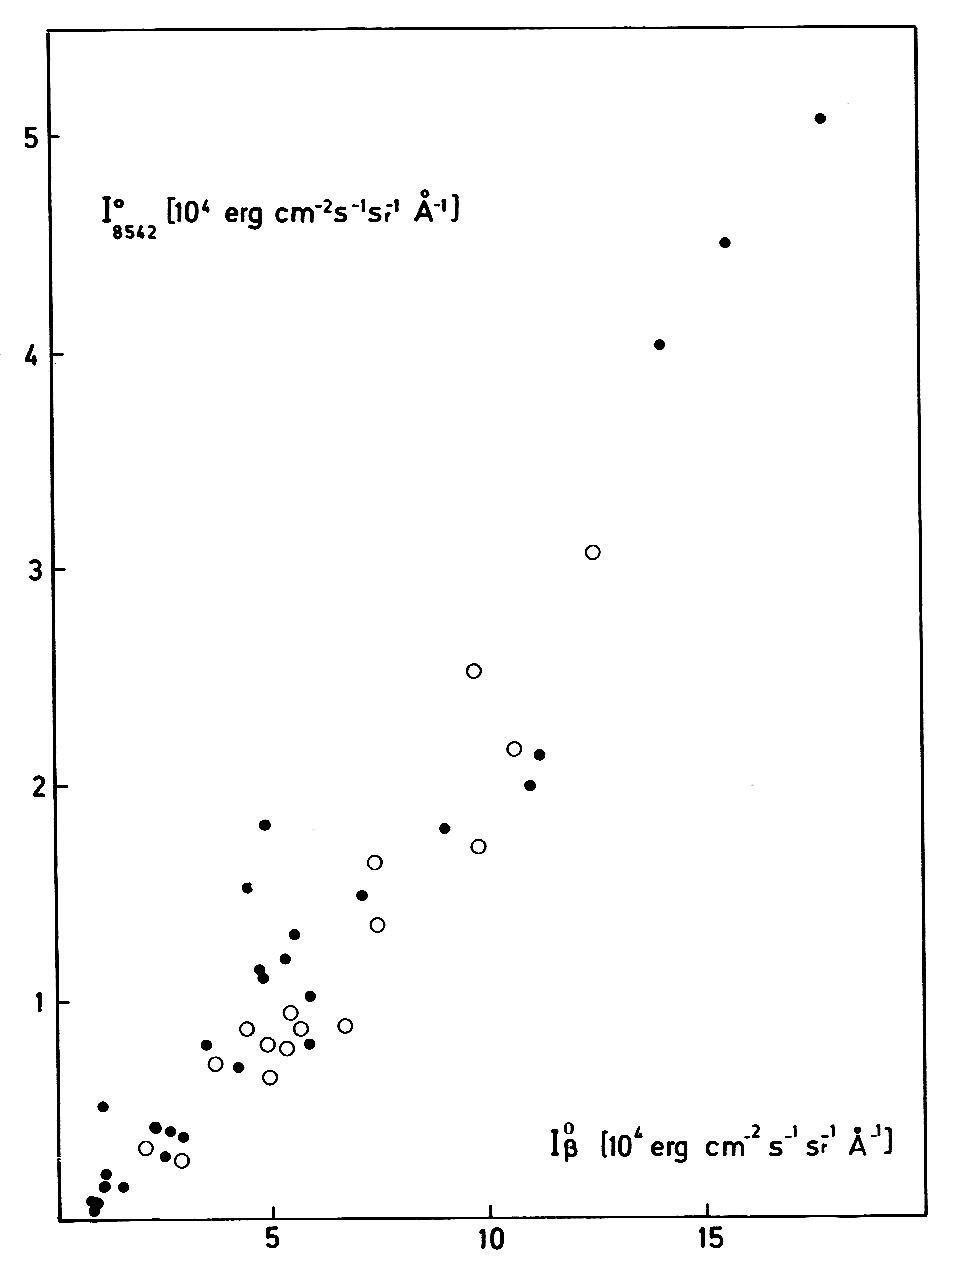
A similar relation, but for the observed Ca ii IR and H line is shown in Figure 7. Here, the branching is much less pronounced. For optical thin layers with central intensities erg/(s cm2 ster Å) in Figure 7, we find a slight indication that narrow Ca ii IR profiles with (cf., Fig. 2) tend to follow the upper part of the relation (full dots in Figure 7).
5 Conclusions
We confirm that the branching in the Ca ii versus Balmer emission correlates with the non-thermal line broadening, . The importance of that parameter for the transfer problem of the Ca ii lines was discussed by Heasley and Milkey (1978). Comparison of their calculated relation E(Ca ii K) vs E(Ca ii H) with observations by Landman and Illing (1977) gave small values km/s. Stellmacher (1979) obtained km/s, being compatible with values he obtained from higher Balmer lines and He D3.
The line-width method (through Equation (1)) may be reliable, if the widths of the hydrogen, helium and metal lines give single values for and . However, the time variation of the prominence structure (’threads’) suggests that large scale motions may affect a line broadening in addition to the thermal and non-thermal velocities.
Corresponding calculations have been carried out by Kawaguchi (1966) for the Balmer line profiles. He assumed different laws for the distribution of the thread velocities (independent of the position along the line of sight) and constant thermal and non-thermal (Maxwellian) broadening within each optically thin thread. He obtained (apart from a Gaussian distribution law, which again results in Gaussian profiles) non-Gaussian shapes for the additional line broadening.
Hence, the structure of the prominence itself influences the line width and the total emission by convolution of the internal Maxwellian broadening with the (macro-) velocity distribution function of threads along the line of sight. Side-on and edge-on observations of prominences may then be spectroscopically distinct; a possible example was discussed by Landman and Illing (1977) in context with the branching of their Ca ii K versus Ca ii IR emission relation. Similarly, differences in E(Ca ii K)/E(H) ratio found by Engvold et al. (1978) between ordinary prominence structures and edge structures with ’ejecta’ may be related to such a modified line broadening.
References
- [] Brückner, G.: 1961, Z. f. Astrophys. 51, 187
- [] Engvold, O.: 1978, Solar Phys. 56, 87.
- [] Engvold, O. and Malville, J. M.: 1977, Solar Phys. 52, 369.
- [] Engvold, O., Malville, J. M., and Livingston, W.: 1978, Solar Phys. 60, 57,
- [] Heasley, J. N. and Milkey, R. W.: 1978, Astrophys. J. 221, 677.
- [] Hirayama, T.: 1978, in E. Jensen. P. Maltby, and F. Q. Orrall leds.), ‘Physics of Solar Prominences’, IAU Colloq. 44, 4.
- [] Kawaguchi, I.: 1966, Publ. Astron. Soc. Japan 18, 362.
- [] Labs, D. and Neckel, H.: 1968, Z. Astrophys. 69, 1.
- [] Landman, D. A. and Illing, R. M. E.: 1977, Astron. Astrophys. 55, 103.
- [] Landman, D. A., Edberg, S. J. and Laney, C. D.: 1977, Astrophys. J. 218, 888.
- [] Landman, D. A. and Mongillo, M,: 1979, Astrophys. J. 230, 581.
- [] Landman, D. A.: 1979, preprint.
- [] Stellmacher, G.: 1969, Astron. Astrophys. 1, 62.
- [] Stellmacher, G.: 1978, in E. Jensen, P. Maltby, and F. Q. Orrall leds.l, Phvsics of Solar Prominences’, IAU-colloq. 44, 33.
- [] Stellmacher, G,: 1979, Solar Phvs. 61, 61.
- [] White, O. R. and Suemoto, Z.: 1968, Solar Phys. 3, 523.
- [] Wiehr, E., Wöhl, H., and Wittmann, A.: 1980, Solar Phys. 68, 207.