The Horizontal Branch of NGC 1851: Constraints from its RR Lyrae Variables
Abstract
We use the pulsational properties of the RR Lyrae variables in the globular cluster NGC 1851 to obtain detailed constraints of the various sub-stellar populations present along its horizontal branch. On the basis of detailed synthetic horizontal branch modeling, we find that minor helium variations (0.248-0.280) are able to reproduce the observed periods and amplitudes of the RR Lyrae variables, as well as the frequency of fundamental and first-overtone RR Lyrae stars. Comparison of number ratios amongst the blue and red horizontal branch components and the two observed subgiant branches also suggest that the RR Lyrae variables originated from the progeny of the bright subgiant branch. The RR Lyrae variables with a slightly enhanced helium (0.270-0.280) have longer periods at a given amplitude, as is seen with Oosterhoff II (OoII) RR Lyrae variables, whereas the RR Lyrae variables with 0.248-0.270 have shorter periods, exhibiting properties of Oosterhoff I (OoI) variables. This correlation does suggest that the pulsational properties of RR Lyrae stars can be very useful for tracing the various sub-populations and can provide suitable constraints on the multiple population phenomenon. It appears of great interest to explore whether this conclusion can be generalized to other globular clusters hosting multiple populations.
Subject headings:
globular clusters: general — globular clusters: individual(NGC 1851) stars: abundances, distances, Population II1. Introduction
Especially following the detection of two distinct subgiant branches (SGBs) in the color-magnitude diagram (CMD) of NGC 1851 (Milone et al., 2008), attempts to piece together the formation history of this cluster have become alluring. One promising explanation of the split between the bright SGB (SGBb) and faint SGB (SGBf) is that the two subpopulations differ in age by about 1 Gyr, and this scenario has been discussed in a number of studies (Milone et al., 2008; Carretta et al., 2011a, b; Gratton et al., 2012a). Another valid explanation is that the SGB splitting is due to differing C+N+O contents and that the two SGBs are nearly coeval (Cassisi et al., 2008; Ventura et al., 2009). The horizontal branch (HB) of NGC 1851 is also bimodal, with both a prominent red HB clump and a blue tail. From the morphology of the HB and the main sequence (MS), strong helium variations within the cluster do not seem likely (Salaris et al., 2008; D’Antona et al., 2009), and recent spectroscopy of the blue HB stars suggests minor helium enhancements (Gratton et al., 2012a). Lastly, the red giant branch (RGB) is known to harbor different populations (Grundahl et al., 1999; Calamida et al., 2007; Lee et al., 2009; Han et al., 2009).
The stellar distribution along the HB of globular clusters is commonly used to understand their formation and evolution (Gratton et al., 2010; Dotter et al., 2010), and previous papers dealing with the modeling of the HB of NGC 1851 (Salaris et al., 2008; Gratton et al., 2012a) used synthetic HB models to obtain scenarios of the formation this clusters bimodal horizontal branch. In this paper we will approach a more detailed investigation of the portion of the HB dealing with the instability strip (IS), by discussing the case of the RR Lyrae period distribution in NGC 1851.
Period distributions of RR Lyrae stars have been shown to place strong constraints in the framework of canonical HB evolution. For example, the problem of the peaked distribution of the RR Lyrae periods in M3 (Castellani & Tornambe, 1981; Rood & Crocker, 1989) has challenged model predictions as nicely described by Catelan (2004). Recent studies have come to explain both the M3 period distribution and HB morphology as the consequence of a range of initial He together with a uniform total RGB mass loss (with a very small spread) (Caloi & D’Antona, 2008), or a suitable bimodal mass-loss efficiency along the RGB but a single initial He abundance (Castellani et al., 2005).
The RR Lyrae properties of NGC 1851 have been used to describe this cluster as “truly an unusual Oosterhoff type I object” (Downes et al., 2004). This is largely because NGC 1851 is at the extreme end of the OoI-type clusters, with its RR Lyrae variables having not only a longer than average period for its Oosterhoff class, but also a ratio of first overtone RR Lyrae (RR1) to fundamental mode RR Lyrae (RR0) stars more in line with OoII-type GCs (Walker, 1998). The suggestion has also been made that the RR Lyrae variables can be divided into two subgroups based on their Ca photometry (Lee et al., 2009), although they acknowledge that their sample is small, and the apparent bi-modality may merely reflect a calcium metallicity spread in the variables. Further suggestions that this cluster may be different than other Galactic GCs comes from its phase-space distribution, which indicates it may be associated with the Canis Major dwarf (Frinchaboy et al., 2004; Martin, 2004, however see also López-Corredoira et al. 2007 who show that the signatures of the Canis Major dwarf can be fully accounted for by Galactic models without new substructures).
Reproducing theoretically both the morphology of its unusual CMD as well as the period distribution of its RR Lyrae variables is an important step in piecing together the formation scenario of NGC 1851.
2. RR Lyrae Observations
2.1. Sample and Completeness
The most complete study of the RR Lyrae variables in NGC 1851 was carried out by Walker (1998). He presents 33 variables in a 13.6 arcmin2 area centered on this cluster in the , and passbands, 30 of which are RR Lyrae stars. Recently Sumerel et al. (2004) discovered 19 additional variables and Downes et al. (2004) reported eleven variables, all within 40” of the cluster center. There is overlap in these two samples, as described by the 2011 update of NGC 1851 in the Clement et al. (2001) catalog, and most of the new discoveries are RR Lyrae stars, although the classification for a handful of these stars is still uncertain. Neither Sumerel et al. (2004) nor Downes et al. (2004) provide calibrated mean magnitudes or amplitudes for their variables, making it difficult to use these stars in our analysis. As there is no indication that the Walker (1998) sample is incomplete at distances greater than 40” from the cluster center, we limit our sample of RR Lyrae stars with which to compare our HB models to this outer region. Of the 29 RR Lyrae stars studied by Walker (1998) that are greater than 40” from the center, 25 have both unblended magnitudes and well determined periods. Thus our sample of variables is 25/29 or 86% complete (outside the inner core).
The position on the sky of our sample of variables is shown in Figure 1, and the central 40” is designated by a circle. Light curves for these stars are presented by Walker (1998) in the passbands, so for these 25 RR Lyrae variables, robust mean magnitudes, periods and amplitudes are available. The edges of the instability strip, judged by the measured colors of variables near the strip boundaries, were also determined by Walker (1998), as well as the RR1 - RR0 boundary.
2.2. Period-Amplitude Diagram
Clement & Shelton (1999a) show that the position of an RR Lyrae variable in the period-amplitude () diagram is not a function of metal abundance, but rather of Oosterhoff type, and derive PA relations for OoI and OoII-type RR Lyrae stars empirically. More recently Cacciari et al. (2005) study the plane of 3 typical OoI-type GCs, 3 typical OoII-type GCs and 3 intermediate types and find that there is a unique period-amplitude relation independent of metallicity for RR0 variables in OoI-, OoII- and intermediate-type clusters. The periods and -amplitude of our sample of RR0 Lyrae variables is shown in Figure 2, and the period-amplitude relation of typical OoI and OoII-type systems is over-plotted. We note that although many of the RR Lyrae stars in NGC 1851 have periods and amplitudes that cause them to fall near the OoI PA relation, there are a number of stars following the OoII PA relation.
It is well known that the Blazhko effect, or other effects such as a rapidly changing period, can cause scatter in the PA plane (Clement & Shelton, 1999a). The Blazhko effect causes the amplitude of light variation to vary over timescales longer than the basic pulsation period. The Walker (1998) RR Lyrae variables were observed over an ample time frame (126 total frames observed over 15 nights during a 1.5 year time span), so determining the amplitudes using the average light curves of the RR Lyrae stars is straightforward. Nevertheless a visual determination of the change in amplitudes in each RR0 is obtained and shown as an error-bar in Figure 2. The change from the average light curve amplitude to the maximum Blazhko amplitude ranges from 0.1 - 0.3 mag, and photometric uncertainties lead to amplitude uncertainties of 0.01-0.05 mag. We conclude that even when taking amplitude variations into account, the variables are both OoI and OoII-type.
In comparison, Figure 2 shows the periods and -amplitudes of 1097 RR0 Lyrae variables in 39 Galactic globular clusters. The data for this diagram come from Table 1, where each cluster is listed along with the number of RR0 Lyrae stars within the cluster that have well determined periods and -amplitudes. For completeness, the from Carretta et al. (2009), HB-type and Oosterhoff type for each GC are also given. This sample of RR0 Lyrae variables are divided by their position in the period-amplitude plane following the lines that Clement & Shelton (1999a) derived for Oosterhoff I and Oosterhoff II RR0 stars (see Figure 2). Here an OoI RR Lyrae variable is defined by
| (1) |
and an OoII-type RR Lyrae variable by
| (2) |
where is the -amplitude and is the period. We define an Oosterhoff ratio for each GC, which is simply the number of OoI-type RR0 Lyrae stars compared to the total number of RR0 Lyrae stars in the GC, .
We note that Cacciari et al. (2005) showed for the M3 RR0 Lyrae stars, a quadratic PA relation is a closer fit than a linear one. However, their relation does not approximate high amplitude RR0 Lyrae variables well ( 1.5 mag), largely because such variables are absent in M3. As our comprehensive sample includes a handful of such stars (one OoI- and three OoII-type RR Lyrae), the Cacciari et al. (2005) relation is not used here.
Figure 3 shows the histogram of the Oosterhoff ratio of the GCs in our sample. Most of these clusters lack a complete sample of RR Lyrae variables and at least some of the RR Lyrae amplitudes are likely affected by the Blazhko effect or other light curve “noise”. But even with these caveats, it is clear from the figure that the Oosterhoff ratio splits the GCs into two groups; the OoI-type clusters have RR Lyrae variables with shorter periods for a given amplitude and hence have larger Oosterhoff ratios (with respect to the OoII-type clusters). Further, there is an absence of clusters falling in the “gap”. We therefore believe that our Oosterhoff ratio is useful to distinguish between OoI- and OoII-type GCs. Moreover, this ratio may be used to evaluate the degree for which a GC is a typical OoI- or OoII-type cluster.
The majority of OoI-type GCs have a RR Lyrae star population in which 0.8 (i.e., 80% of the variables can be defined by Equation 1). In contrast, the Oosterhoff ratio of NGC 1851 is 0.74. Equation 1 and 2 are defined somewhat arbitrarily, and therefore we experimented with a variety cuts (where we modified the zero-points and slopes) to distinguish between OoI- and OoII-type stars. The Oosterhoff ratio of NGC 1851 varied between 0.63-0.75, a percentage that is smaller than 83% of the rest of the OoI-type clusters. This indicates that NGC 1851 contains variables with more OoII-like periods and -amplitudes than the majority of the other Milky Way OoI-type GCs.
The other three OoI GCs that have comparatively small Oosterhoff ratios are NGC 362 (0.71), NGC 4590 (0.58) and NGC 6362 (0.67). It has been noted that the RR Lyrae variables of NGC 362 and NGC 1851 are remarkably similar in the period-amplitude diagram, suggesting similar masses and luminosities. This is also seen here, as they have very similar Oosterhoff ratios. Recently it was found that like NGC 1851, NGC 362 also has a split sub-giant branch, although the SGBf component includes only a few percent of the total number of SGB stars of the cluster (just 2-3%, A. Milone private communication).
New photometry of the NGC 1851 RR Lyrae variables, in which periods and amplitudes of the inner RR Lyrae stars have been obtained, suggest that NGC 1851 has a slightly higher Oosterhoff ratio of 0.80 (Amigo et al 2012, in preparation). We therefore suspect that the Oosterhoff ratio of NGC 1851, whereas still lower than the majority of the OoI-type clusters, is not as abnormal as the globular clusters NGC 362, NGC 4590 and NGC 6362, discussed above.
2.3. First Overtone vs. The Fundamental Mode
The number ratio of first-overtone RR Lyrae stars to total RR Lyrae stars, , is usually given to quantify the frequency of the different RR Lyrae pulsators. In general OoII-type GCs have about 2-4 times the frequency of RR1 stars as OoI-type GCs. This is thought to be related to the transition temperature between the instability strip for first overtone pulsation and fundamental one. For example, moving the transition from RR0 to RR1 variables toward lower temperatures (i.e., transforming fundamental in first overtone pulsators) has the twofold effect of increasing the periods of the RR0 Lyrae population, as well as increasing the relative number of first overtones. This is discussed in detail by Castellani, Caputo & Castellani (2003).
NGC 1851 has a large with respect to most OoI-type GCs. This ratio strongly depends on the completeness of the sample, and because NGC 1851 is too crowded for ground-based observations to resolve, the Walker (1998) sample is incomplete at distances close to the core. Assuming the Walker (1998) RR Lyrae sample is complete at distances larger than 40” (see Figure 1), = 0.27, one of the largest for OoI-type GCs. For example, from the Castellani et al. (2003) compilation of 32 clusters with 12 or more pulsators and well recognized period and pulsation modes, only 3 of the 17 OoI GCs have an greater than 0.27. Recent studies have discovered RR Lyrae stars closer than 40” from the center. Downes et al. (2004) find = 0.54, and using Clement’s catalog, the value of this ratio is 0.40. These ratios are somewhat uncertain, however, because of the lack of mode identification for some of these newly discovered pulsators. The periods listed in Sumerel et al. (2004) are “tentative” and the periods derived by Downes et al. (2004) do not cover a full period for any of their objects. Further, because these stars lack amplitudes, their position in a PA diagram also can not be used as a diagnostic to identify fundamentals and first overtones. Although their is no consensus on the value of yet, it is clear that this ratio is at least 0.27, and likely even larger. A larger than 0.27 is also consistent with the results from Amigo et al. (2012, in preparation).
3. Synthetic HB Modeling
Previous synthetic HB models for NGC 1851 have been presented by Catelan et al. (1998), and more recently by Salaris et al. (2008), Han et al. (2009) and Gratton et al. (2012a). Salaris et al. (2008) compared their simulations to the observations by Milone et al. (2008) and found two satisfactory scenarios to reproduce the CMD of HB stars. In both of these models, the blue HB, red HB and variable stars are predicted to come from the SGBf, and the stars from the SGBb are confined to the red portion of the observed sequence. This inference was based on the number ratio SGBf/SGBb=55:45 determined in Milone et al. (2008). Salaris et al. (2008) also found that the initial He abundance of HB stars had to be relatively uniform to reproduce the CMD derived by Milone et al. (2008). In these data the measured magnitudes and colors of the RR Lyrae population are at random phases; therefore the portion of the observed HB crossing the IS could not be used for detailed constraints on the models. However, they did verify that recent theoretical pulsation models of RR Lyrae stars (Di Criscienzo et al., 2004a) predict an instability strip for NGC 1851 too red by 0.030.04 mag in (-) compared to the Milone et al. (2008) data.
Han et al. (2009), on the other hand, found from their photometry that the RR Lyrae variables could come from both the SGBb and the SGBf. They construct two population models for NGC 1851. In the first, the second generation population is more enhanced in metallicity but not in helium (Z=0.0004 and age = 0.1Gyr), and in the second, both metal and helium abundances are enhanced (Z=0.0004, Y=0.05, and age = 0.1Gyr). They find that their Z-only model is in conflict with the observed CMDs of NGC 1851, but that their Z+Y model is in good agreement with the observations from the MS to the HB. In this model, the RR Lyrae variables exhibit different He abundances. Because their RR Lyrae variable sample was found at a random phase of pulsation, the RR Lyrae colors could not be used as a stringent constraint in their models and the RR Lyrae star periods were not discussed.
More recently Gratton et al. (2012a) considered the revised SGBb/SGBf ratio determined by Milone et al. (2009) and introduced new spectroscopic constraints; they find a small difference in the iron content between the SGBb and SGBf, and argue that an age spread of 1.5 Gyr is the most viable explanation for the splitting SGB. They also find that the RHB stars separate into two groups depending on their O and Na abundances, and that the BHB stars are slightly helium enriched as compared to the RHB stars. Hence to satisfy these constraints, the HB is modeled with four different components, with the IS originating from the SGBb. That each SGB hosts multiple generations of stars is shown from spectroscopy of stars on the double SGB (Lardo et al., 2012), making it likely that multiple components may be needed to model the HB.
Our own synthetic HB calculations described below are aimed at answering the following question: what is the most straight-forward way to reproduce the RR Lyrae instability strip of NGC 1851 – and in particular the pulsational properties of its RR Lyrae variables? We seek to provide a simple and attractive explanation for the cluster HB and IS morphology, keeping the number of free parameters to a minimum, yet still reproducing the RR Lyrae star properties that make this cluster stand out as having an unusual Oosterhoff type.
3.1. Synthetic HB models
The HB evolutionary tracks used here are from the BaSTI stellar library (Pietrinferni et al., 2004, 2006, 2009) and have already been described by Salaris et al. (2008) and Cassisi et al. (2008). They are also the same that Gratton et al. (2012a) employed. Briefly, evolutionary tracks are for a normal -enhanced ([/Fe]=0.4) metal mixture, with =1.31 dex and =0.248. The HB tracks were interpolated among the models with =0.248 and additional BaSTI models with =0.300, to determine HB tracks for intermediate values of , at the same iron content. Similarly, to determine HB tracks with a milder CNO-enhancement, an interpolation between the reference set and the models with the CNO sum enhanced by 0.3 dex (Pietrinferni et al., 2009) is used for a portion of the synthesis, as in Gratton et al. (2012a). Hence, the , -enhancement and CNO-enhancement is consistent with spectroscopic results from Carretta et al. (2011a) and Gratton et al. (2012a). We wish to remind the reader that, as long as the CNO sum is unchanged, the effect of the observed CNONa anticorrelations (overimposed to a standard -enhanced metal mixture) on the evolutionary tracks and isochrones is negligible, and standard -enhanced models are adequate to represent the whole cluster population. Only an enhancement of the CNO sum requires the calculation of appropriate models. On the other hand CNONa anticorrelations even at constant CNO affect the bolometric corrections of filters like and (Sbordone et al., 2011) at low effective temperatures, but not longer wavelength filters.
The four HB components described by Gratton et al. (2012a) are used as a starting points for our calculations. Objects from our synthetic HB that fall within the observed IS from Walker (1998) are considered RR Lyrae variables (this region is labeled in Figure 4) and their period is calculated from the pulsation equation given by Di Criscienzo et al. (2004a). The intensity mean magnitudes and colors given by Walker (1998) are used as a comparison to the synthetic HB, because the static magnitudes and colors from stellar evolution models are represented better by intensity-averaged quantities (Di Criscienzo et al., 2004a). Although the Walker (1998) observations include the passbands, we employ only the and magnitudes, because – as discussed before – they are not affected by the observed CNONa abundance anticorrelations.
In addition to the observed and distribution of the HB stars in the CMD, and the observed (blue :variable :red HB) ratio of = (in line with the results by Catelan et al., 1998; Saviane et al., 1998), we impose as a further constraint on our simulation the observed distribution of the RR Lyrae periods.
As in Gratton et al. (2012a) we adopted =0.02 mag (Walker, 1998) and fixed the apparent distance modulus to =15.56 mag by matching the observed mean magnitude of the RHB with our synthetic counterpart. The ratio of our ‘best fit’ simulation is , consistent with the observed value. For reasons that will become clear in the discussion that follows, we consider a preliminary reference age of 11 Gyr for the progenitors of the RHB stars. This implies, for the assumed metallicity and a ‘normal’ =0.248, an initial mass of 0.86 for the stars at the tip of the RGB. The HB components are described below.
(1) As in Gratton et al. (2012a), the majority of the RHB population is modeled with normal CNO abundance, a normal =0.248, and a Gaussian mass distribution with = . This corresponds to a total mean mass loss =0.19 along the RGB, for the assumed 11 Gyr age.
(2) A smaller RHB subpopulation, that is Ba-rich, makes up 10% of the HB population. It is modelled, as in Gratton et al. (2012a), employing a Gaussian mass distribution with = (corresponding to 0.21 ) an 0.15 dex enhanced CNO abundance, and normal =0.248. If we assume that the mean total mass loss has to be constant among all cluster RGB stars – and equal to =0.19 as determined for the rest of the RHB component – the mean value of the mass for this HB sub-population implies an age 1 Gyr older for the progenitors of this HB component.
(3) The horizontal part of the BHB, including the RR Lyrae instability strip, makes up 10% of the cluster stellar content. This component is the focus here, and is the only one that is modified from Gratton et al. (2012a). In particular, instead of adopting a constant He abundance =0.265, the helium content for stars between the blue end of the red clump and the beginning of the BHB blue tail has a continuous distribution between =0.248 and 0.280. A simple, flat probability distribution for and constant =0.19 (for an age of 11 Gyr) with a 1 Gaussian spread of 0.005 – as for the RHB stars – for all RGB progenitors provide a good match to the observed RR Lyrae periods, as discussed below.
The mean He abundance in the IS is =0.271, close to the constant abundance =0.265 employed by Gratton et al. (2012a) for this component, and the mean mass is = . It is worth noting that the observed HB distribution of these stars is well matched by both this simulation and the simulation by Gratton et al. (2012a). This spread in He content is necessary to reproduce the observed period distribution.
(4) The blue tail of the BHB population makes up 20% of the HB stars. As in Gratton et al. (2012a) this component is modeled with normal CNO abundance and =0.28. The Gaussian mass distribution has =, that for an age of 11 Gyr would correspond to a mean =. If the mean total mass loss is instead fixed at =0.19 , this value of implies that the progenitors of the BHB blue tail stars are 1.5 Gyr older that the RHB component with normal CNO and . Notice that the constraint on the progenitor is weaker for BHB stars (see discussion in Gratton et al., 2012a) and a small spread of order 0.01 may be present.
These results from the HB synthetic modeling can be interpreted in terms of the progeny of the
SGBb and SGBf subpopulations (the ratios 2/3 and 1/3 of the total SGB population,
respectively, are adopted as determined by Milone et al. 2009) as follows:
(1) The sum of the fraction of stars in the blue tail of the BHB and in the mildly CNO-enhanced
Ba-rich RHB component is 35% of the total HB population. If we consider as a
reference the CMD of 11 Gyr old SGB stars with ‘normal’ and CNO abundance, the
progenitors of these two HB components will be distributed along a fainter SGB than the
reference one. In the case of the progenitors of the BHB component this is an age effect, for
a change of does not have a major effect on the SGB luminosity. For the Ba-rich RHB
progenitors the reason is the slightly higher age and the mildly enhanced CNO abundance,
that act both in the direction of producing a fainter SGB. As a result, both the
Ba-rich RHB stars and the blue tail HB progenitors display an approximately
coincident SGB, that we tentatively identify as the SGBf in the cluster CMD.
(2) The sum of the fraction of stars in the horizontal BHB (including the IS) and the RHB stars
with normal composition amounts to 65% of the total HB population.
We identify their progenitors as the stars harbored by the SGBb in the cluster CMD.
To conclude this section, it is worth noting that the exact value of the assumed reference age (11 Gyr) is not critical. Had a different age been assumed, i.e. 10 or 12 Gyr, the previous conclusions will still be valid. The only difference is that all values of would need to be shifted downwards (or upwards) by 0.02– to keep the mass distribution along the HB unchanged – but the interpretation of the results would be identical. Finally, the different chemical composition – and small age differences – assigned to the SGBb and SGBf populations do not affect substantially SGB and RGB timescales; as a consequence, the number ratio SGBb/SGBf will be approximately equal to the number ratio of their HB progeny.
3.2. Comparison With Observations
This synthetic HB model is shown compared to the observed one in Figure 4 where an observational scatter of 0.01 mag is assumed. The four components are high-lighted for clarity and the RR Lyrae region is labeled.
Our full synthetic HB model reproduces two peculiarities in the CMD of NGC 1851 pointed out by Brocato et al. (1999), namely the clump of stars near the red edge of the HB and the slightly tilted HB (0.1 mag). Features such as these are present also in NGC 6362 (which has an RR Lyrae population with properties very similar to NGC 1851), and in the extreme cases of NGC 6388 and NGC 6441 (0.5 mag).
The focus here concerns the component that includes the instability strip, which comes from the SGBb. As Walker (1998) mentioned, the ZAHB is very cleanly defined and is not horizontal, being slightly brighter at bluer colors. This is reproduced in our synthetic HB model by stars that range in helium abundance from =0.25-0.28, and range in mass from 0.61 to 0.65.
The theoretical periods and pulsation amplitudes from the RR Lyrae variables in our synthetic HB model are compared to the observed periods and amplitudes in Figure 5. Here the observed periods come from 28 RR0 and 18 RR1 variables as determined by Walker (1998) and Sumerel et al. (2004) to encompass all the data available in the literature (see the 2011 update of NGC 1851 in Clement et al., 2001). We also compare the theoretical periods with 27 RR0 and 18 RR1 variables as determined by Amigo et al. (2012, in preparation). These authors derive periods for the recently identified inner RR Lyrae variables based on light curves with 200-300 points in each of the - - and -passbands. The observed amplitudes come exclusively from the Walker (1998) RR0 Lyrae sample, as Sumerel et al. (2004) present instrumental magnitudes only. The amplitudes from the Amigo et al. (2012, in preparation) sample are not used, because unlike when determining periods, amplitudes can be affected by crowding and blending issues (e.g., Majaess et al., 2012) and we do not have a feel for how/if blending affects their (preliminary) amplitude determinations.
Marconi et al. (2011) provided a detailed comparison between the impact of the He abundance on the pulsation properties of RR Lyrae stars and concluded that He content marginally affects the pulsation behavior of RR Lyrae stars. They noted that the increase in the average pulsational period associated with the He increase is only due to the brighter luminosities which characterize He-enhanced evolutionary models. As a consequence, from a theoretical point of view the impact of an He-enhancement on the pulsation properties of RR Lyrae stars can be directly taken into account when adopting evolutionary tracks for the appropriate He abundance and pulsational model predictions obtained for a canonical He abundance.
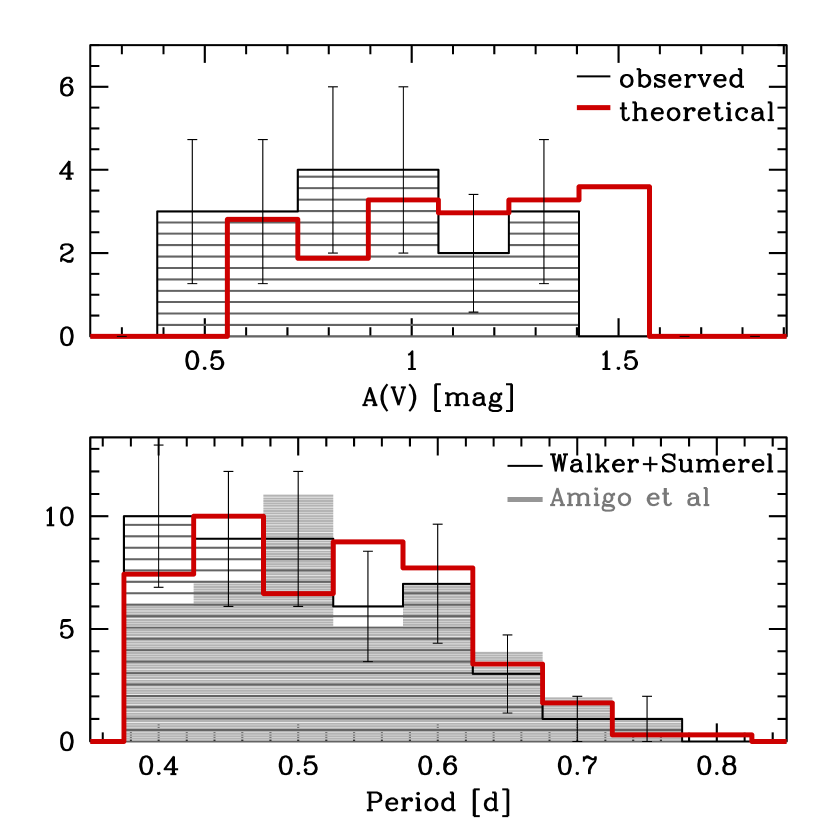
The periods of the RR1 variables are fundamentalized via log , where is the fundamental mode period, and the theoretical periods are calculated for all HB stars falling within the observed IS using the Di Criscienzo et al. (2004a) RR Lyrae pulsation models. The mean observed RR0 Lyrae period in NGC 1851 is = 0.571 (Catelan, 2009a), and from our model = 0.569 0.006 d is calculated, where the uncertainty is the error in the mean. The number of RR Lyrae stars in the simulations is 5 times larger than the number of observed RR Lyrae stars. In this way, in the synthetic HB model, the effect of statistical fluctuations in the number of objects at a given magnitude and color is minimized.
The observed minimum fundamentalized period of the first overtones and the minimum fundamentalized period from the synthetic HB is very similar, 0.34 days. It has been shown that the minimum fundamentalized period is a robust observable to constrain the evolutionary properties of RR Lyrae stars (Bono et al., 1995), so it is especially encouraging that the observed and theoretical values agree.
We have performed a Kolmogorov-Smirnov (KS) test to establish whether one can reject the null hypothesis that the two samples of periods (observed and synthetic) come from the same distribution. From a comparison between the combined Walker (1998) and Sumerel et al. (2004) sample and the synthetic RR Lyrae stars, the KS-test returns a probability P=0.86, well above the default threshold =0.05 below which one rejects the null hypothesis. When the Amigo et al. period distribution is compared with our theoretical one, if we assume that both samples are drawn from the same parent population, the samples will differ by this amount or more 94% of the time. On this basis, we find that the synthetic periods from our simulated HB and the observed periods agree well with each other.
Theoretical pulsation amplitudes are also determined from the Di Criscienzo et al. (2004a) relations, although three points should be taken into account:
1. Theoretical amplitudes depend on the the mixing-length, , (where is the pressure scale-height), which is uncertain and may change from the blue to the red edge of the IS (Marconi et al., 2003). Pulsation amplitudes are affected by in the sense that a larger value of translates to smaller pulsation amplitudes as a consequence of the larger efficiency of convective motions and, hence larger quenching to the pulsation mechanism provided by convection.
2. The synthetic pulsational amplitude - period predictions provided by Di Criscienzo et al. (2004a) show a large scatter, of the order of 0.2 mag (standard deviation) in the -amplitude at a fixed period (see Fig. 6 of their paper, where the dashed lines represent the standard deviation). Since our predictions of the -amplitude in our synthetic HBs are based on an - period relation obtained by an interpolation on the data provided by Di Criscienzo et al. (2004a), we do not expect a great accuracy in our estimates. In addition, Di Criscienzo et al. (2004a) have shown that for d, pulsation model predictions for the -amplitude are still more affected by a change in the adopted mixing length value (see lower panel of the quoted figure): for increasing mixing length values they predict a significant decrease in the dependence of the -amplitude on the pulsation period.
3. When dealing with pulsating structures, the static magnitudes differ from the measured magnitudes, which are mean quantities averaged over the pulsation cycle. In finding theoretical amplitudes, a correction between static and intensity-averaged magnitudes is required. The discrepancy between static and mean values is a function of the pulsation amplitude, and the corrections adopted here come from Bono et al. (1995).
When using a =2.0, the Walker (1998) -amplitude distribution is similar to that observed, although the theoretical amplitudes appear to be 0.1 mag larger. This is not completely surprising considering the scatter in the Di Criscienzo et al. (2004a) -amplitude relation as well as the magnitude corrections discussed above. Extrapolating linearly between =1.5 and 2.0, an increase in the mixing length of 0.1 would cause a decrease of the theoretical amplitudes by 0.08 mag. Such a decrease would provide a satisfactory agreement between theory and observations. A 0.1 change in is well within the uncertainties in the mixing length calibration, and not nearly large enough to affect the predicted pulsation periods (Bono & Stellingwerf, 1994; Di Criscienzo et al., 2004b; Marconi & Degl’Innocenti, 2007). An =2.0 was also used by Bono et al. (2007) to derive a visual distance modulus from nonlinear convective models of RR Lyrae stars to NGC 1851 of =15.520.11 mag, which is similar to the distance modulus adopted here. In contrast, when using a =1.5, Bono et al. (2007) find a distance modulus of =15.400.12. Therefore we conclude that using a larger value of , (2.0), provides a consistent comparison between our synthetic HB and pulsational predictions.
In general, the RR Lyrae variables with 0.27 fall in the OoI area of the PA diagram, whereas the RR Lyrae variables with 0.27 fall close to the OoII line. Assuming that the period-amplitude diagram can be effectively used to classify RR Lyrae stars into an Oosterhoff type, this means that He and Oosterhoff type are correlated in this cluster. This is not completely unexpected, as an increase in He makes RR Lyrae variables brighter and, as a consequence, higher helium abundance makes their pulsational period longer (Bono et al., 1997; Marconi, 2009).
On a general ground, for a given total mass the HB stars with 0.27 are redder than those with 0.27. The red part of the IS, where the fundamental mode RR Lyrae stars reside, is consequently more populated, and a smaller is obtained. Our synthetic HB yields 0.1 for the stars with 0.27. This is a ratio that is seen for the majority of the OoI-type GCs. In contrast, the blue part of the horizontal branch contains more stars with higher helium abundances, and as the first overtone RR Lyrae variables reside in the blue part of the IS, a larger is obtained. Our synthetic HB yields 0.45 for stars with 0.27, a ratio more in line with OoII-type GCs. The observed ratio of first overtone to total RR Lyrae variables for NGC 1851 in our sample is 0.30 and is easily explained (and reproduced with our synthetic HB) by the spread in along the RR Lyrae instability strip.
We find that simulations using a constant helium for the portion of the HB containing the IS (as in Gratton et al., 2012a) do not fit the constraints given by the NGC 1851 RR Lyrae variables as well. For example, adopting =0.265 results in an = 0.11 (versus the observed = 0.28).
We note that Milone et al. (2008) provide an upper limit to a possible dispersion in helium abundance of =0.026 between the two SGBs in NGC 1851, a value close to the spread assumed in the synthetic HB presented here. Other estimates of the He spread in NGC 1851 are slightly larger, i.e., =0.04 (Ventura et al., 2009), =0.05 (Han et al., 2009) or =0.048 (Gratton et al., 2010).
4. Discussion and Conclusions
The population distribution of the stars along the HB has been modeled assuming the presence of (at least) four populations with differing helium contents. In our simulations, the only parameter we vary is the initial He abundance of the HB progenitors, keeping the same total RGB mass loss for all components. Both the RR Lyrae period distribution as well as the number ratio of first overtone RR Lyrae to total RR Lyrae stars, , provides constraints pertaining to the component of the HB containing the IS. It is straight forward to reproduce the observed distribution of RR Lyrae stars inside the instability strip with minor He variations (0.248-0.280) and from a HB subpopulation corresponding to the progeny of a fraction of the SGBb stellar population.
Therefore, the IS of NGC 1851 belongs to a second generation (SG) of stars. That a SG exists within the SGBb component is in agreement with recent spectroscopy of the SGB stars, showing that each SGB hosts multiple subgenerations of stars (Lardo et al., 2012). D’Antona & Caloi (2008) have also postulated that the longer periods of the NGC 1851 RR Lyrae may indicate that these variables may belong to the SG, and our synthetic HB strengthens this notion. Chemical anomalies in GCs suggest that self-enrichment is a common feature among GCs. The quasi-constancy of heavy metals in most GCs leads to the assumption that abundance variations are not or scarcely affected by SN ejecta, but involves formation of a second generation of stars from matter processed into the FG stars.
The SG will most probably show a spread in He (D’Antona & Caloi, 2008) because the self-enriched material may come from different progenitors that have different chemical peculiarities, or may be diluted in different fractions with matter from the first generation (FG). We remark that such a helium spread is an essential ingredient in order to reproduce the pulsation properties of the RR Lyrae population as a whole. Simulations using constant He across the IS give synthetic period distributions that do not match the observed one as well and result in the observed being lower than what is observed. Actually, one can note that variations of He in 19 GCs have also been deduced by Bragaglia et al. (2010) from 1400 RGB stars with abundance determinations. As discussed in Gratton et al. (2010), a star-to-star spread in the He abundance may explain many aspects of the horizontal branches of GCs.
It is worth pointing out that there have been suggestions of problems in the late stages of HB evolution in current HB tracks (Catelan, 2009b; Valcarce & Catelan, 2008). Moreover, Catelan (2009b) show that in the case of NGC 1851, over-luminous stars on the blue HB could be interpreted by an underestimate of the luminosity evolution along the HB rather than in terms of a moderate level of helium enrichment. Here we do not attempt to resolve this ambiguity for NGC 1851; rather, we assume that the evolutionary tracks adopted represent the HB evolution accurately, and remind the reader that our comparisons are ultimately subject to both theoretical and observational uncertainties.
The pulsation periods and amplitudes from the RR Lyrae variables resulting from variations in He along the IS have different characteristics. The RR Lyrae variables with a “normal” helium have periods and amplitudes, as well as a ratio, that is inline with OoI-type GCs. In contrast, the RR Lyrae variables with slightly enhanced He (0.27 0.28) have longer periods and a higher ratio of , indicative of RR Lyrae variables in OoII-type GCs. In the absence of spectroscopy of the RR Lyrae variables in NGC 1851, the synthetic horizontal part of the HB and RR Lyrae instability strip presented here is the simplest one that reproduces the available observations with the smallest amount of free parameters. New observations of the RR Lyrae variables may require more complex modeling, however, and would be particularly interesting.
Oosterhoff-I clusters tend to be more metal-rich and host fainter RR Lyrae variables than OoII clusters (Caputo et al., 2000). As the metallicity has an effect on the absolute magnitude of an RR Lyrae, it has been difficult to disentangle whether the metallicity difference alone is affecting the brightness differences, or whether there are differences in the intrinsic magnitudes of RR Lyrae variables in OoI and OoII globular clusters caused by something other than just metallicity (like evolution or helium). In this cluster, where an internal spread in is small at most, our results indicate that a difference in helium abundance in the RR Lyrae variables is affecting where in the PA diagram the RR Lyrae star falls.
Our model consists of a BHB that is He-enriched (0.28) yet older than the RHB (=0.248). This can be explained if the cluster was formed by a process such as a merger with populations that differ in He and age. Such a scenario has already been discussed by e.g. Carretta et al. (2011b) and Bekki & Yong (2012). Hence the BHB would not be a second generation (SG) of stars originating from the same population as the RHB (the SGBb).
Since this paper was submitted, results from an intermediate resolution spectroscopic analysis of the two SGBs by Gratton et al. (2012b) indicate that the difference between the SGBb and SGBf is 0.07 dex, the SGBf being more metal rich. The RR Lyrae stars in our scenario are the progeny of SGBb; hence this metallicity difference does not affect our results. We find that for BHB stars hotter than the IS a 0.1 dex increase in at fixed changes the HB masses (at fixed ) by 0.01, and changes by 0.01 mag. Therefore the effect of such a difference between the two SGBs has a negligible effect on our HB modeling.
We have shown that a spread in He reproduces the pulsational properties of the RR Lyrae sample as a whole, indicating the presence of a SG of stars in NGC 1851. Our analysis therefore demonstrates that RR Lyrae properties in a given GC can provide suitable constraints on the multiple population phenomenon in that GC. It is worth carrying out more studies of this kind to investigate further this connection with the occurrence of the multiple population phenomenon, especially in GCs with a sizable population of RR Lyrae stars and in which the stellar chemical patterns are well known.
References
- Alves et al. (2001) David R., Bond, H.E. & Onken, C. 2001, AJ, 121, 318
- Arellano Ferro et al. (2011) Arellano Ferro, A., Figuera Jaimes, R., Giridhar, S., Bramich, D.M., Hernandez Santisteban, J. V., & Kuppuswamy, K. 2011, arXiv1106.1880
- Bekki & Yong (2012) Bekki, K. & Yong, D. 2012, MNRAS, 419, 2063
- Benko et al. (2006) Benko, J.M., Bakos, G.A. & Nuspl, J. 2006, MNRAS, 372, 1657
- Bono & Stellingwerf (1994) Bono, G. & Stellingwerf, R.F. 1994, ApJS, 93, 233
- Bono et al. (1995) Bono, G., Caputo, F., & Stellingwerf, R.F. 1995, ApJS, 99, 263
- Bono et al. (1997) Bono, G., Caputo, V., Castellani, V., & Marconi, M. 1997, A&AS, 121, 327
- Bono et al. (2007) Bono, G., Caputo, F., & Di Criscienzo, M. 2007, A&A, 476, 779
- Borissova et al. (2001) Borissova, J., Catelan, M. & Valchev, T. 2001, MNRAS, 324, 77
- Bragaglia et al. (2010) Bragaglia, A., Carretta, E., Gratton, R., D Orazi, V., Cassisi, S. & Lucatello, S. 2010, A&A, 505, 139
- Brocato et al. (1999) Brocato, E., Castellani, V., Raimondo, G., & Walker, A.R. 1999, 527, 230
- Cacciari (1979) Cacciari, C. 1979, AJ, 84, 1542
- Cacciari et al. (2005) Cacciari, C., Corwin, T. M., & Carney, B. W. 2005, AJ, 129, 267
- Calamida et al. (2007) Calamida, A., Bono, G., Stetson, P. B., et al. 2007, ApJ, 670, 400
- Caloi & D’Antona (2008) Caloi, V. & D’Antona, F. 2008, ApJ, 673, 847
- Carretta et al. (2008) Carretta et al. 2008, 2008arXiv0811.3591C
- Carretta et al. (2009) Carretta, E., Bragaglia, A., Gratton, R., D’Orazi, V., & Lucatello, S. 2009, A&A, 508, 695
- Carretta et al. (2011a) Carretta, E., Lucatello, S., Gratton, R.G., Bragaglia, A. & D Orazi, V. 2011a, A&A, 533, 69
- Carretta et al. (2011b) Carretta, E., Bragaglia, A., Gratton, R., D’Orazi, V., Lucatello, S. 2011b, A&A, 535, 121
- Catelan et al. (1998) Catelan, M., Borissova, J., Sweigart, A. V., & Spassova, N. 1998, ApJ, 494, 265
- Catelan (2004) Catelan, M. 2004, ApJ, 600, 409
- Catelan (2009a) Catelan, M. 2009a, Ap&SS, 320, 261
- Catelan (2009b) Catelan, M. 2009b, The Ages of Stars (IAU Symp. 258), ed. E. E. Mamajek, D. R. Soderblom, & R. F. G. Wyse (Cambridge: Cambridge Univ. Press), 209
- Cassisi et al. (2008) Cassisi, S., Salaris, M., Pietrinferni, A., Piotto, G., Milone, A. P., Bedin, L. R., & Anderson, J. 2008, ApJ, 672, L115
- Caputo et al. (2000) Caputo, F., Casetllani, V., Marconi, M. & Ripepi, V. 2000, MNRAS, 316, 819
- Castellani & Tornambe (1981) Castellani, V. & Tornambe, A. 1981, A&A, 96, 207
- Castellani et al. (2003) Castellani, M., Caputo, F., & Castellani, V. 2003, A&A, 410, 871
- Castellani et al. (2005) Castellani, M., Castellani, V. & Cassisi, S. 2005, A&A, 437, 1017
- Clement & Rowe (2000) Clement, C.M. & Rowe, J. 2000, AJ, 120, 2579
- Clement & Shelton (1997) Clement, C.M. & Shelton, I. 1997, AJ 113, 1711
- Clement & Shelton (1999a) Clement, C.M. & Shelton, I. 1999a, ApJ, 515, 88
- Clement & Shelton (1999b) Clement, C.M. & Shelton, I. 1999b, AJ, 118, 453
- Clement et al. (2001) Clement, C.M. et al. 2001, AJ, 121, 2587
- Cohen et al. (2011) Cohen, R.E., Sarajedini, A., Kinemuchi, K. & Leiton, R. 2011, ApJ, 727, 9
- Contreras et al. (2010) Contreras, R., Catelan, M., Smith, H.A., Pritzl, B.J., Borissova, J. & Kuehn, C.A. 2010, AJ, 140, 1766
- Corwin et al. (1999) Corwin, T.M., Carney, B.W. & Nifong, B.G. 1999, AJ 118, 2875
- Corwin & Carney (2001) Corwin, T.M. & Carney, B.W. 2001, AJ 122, 3183
- Corwin et al. (2003) Corwin, T.M., Catelan, M., Smith, H. A., Borissova, J., Ferraro, F. R. & Raburn, W. S. 2003, AJ, 125, 2543
- Corwin et al. (2008) Corwin, T.M., et al. 2008, AJ, 135, 1459
- D’Antona & Caloi (2008) D’Antona, F. & Caloi, V. 2008, MNRAS, 390, 693
- D’Antona et al. (2009) D’Antona, F., Stetson, P. B., Ventura, P., et al. 2009, MNRAS, 399, L151
- Di Criscienzo et al. (2004a) Di Criscienzo, M., Marconi, M., & Caputo, F. 2004a, ApJ, 612, 1092
- Di Criscienzo et al. (2004b) Di Criscienzo, M., Marconi, M., & Caputo, F. 2004b, Mem. Soc. Astr. It. Vol. 75, 190
- Di Criscienzo (2011) Di Criscienzo, M. et al. 2011, AJ, 141, 81
- Dickens (1970) Dickens R. J. 1970, ApJS, 22, 249
- Dickens & Flinn (1972) Dickens R. J. & Flinn R. 1972, MNRAS, 158, 99
- Dotter et al. (2010) Dotter, A., Sarajedini, A., Anderson, J. et al. ApJ, 708, 698
- Downes et al. (2004) Downes, R.A., Margon, B., Homer, L. & Anderson, S.F. 2004, AJ, 128, 2288
- Frinchaboy et al. (2004) Frinchaboy, P. M., Majewski, S. R., Crane, J. D., et al. 2004, ApJL, 602, 21
- Gratton et al. (2010) Gratton, R.G., Carretta, E., Bragaglia, A., Lucatello, S., D Orazi, V. 2010, A&A, 517, 81
- Gratton et al. (2012a) Gratton, R.G. et al. 2012a, A&A, 539, 19
- Gratton et al. (2012b) Gratton, R.G., Villanova, S., Lucatello, S., Sollima, A., Geisler, D., Carretta, E., Cassisi, S. & Bragaglia, A. 2012b, arXiv:1205.5719
- Grundahl et al. (1999) Grundahl, F., Catelan, M., Landsman, W. B., Stetson, P. B., & Andersen, M. I. 1999, ApJ, 524, 242
- Han et al. (2009) Han, S.-I., Lee, Y.-W., & Joo, S.-J. et al. 2009, ApJ, 707, L190
- Kaluzny et al. (1995) Kaluzny, J., Krzeminski, W., & Mazur, B. 1995, AJ, 110, 2206
- Kaluzny et al. (2001) Kaluzny, J., Olech, A., & Stanek, K. Z. 2001, AJ, 121, 1533
- Kaluzny et al. (2004) Kaluzny, J., Olech, A., Thompson, I. B., Pych, W., Krzemiński, W. & Schwarzenberg-Czerny, A. 2004, A&A, 424, 1101
- Kopacki (2001) Kopacki, G. 2001, A&A, 369, 862
- Kunder et al. (2011a) Kunder, A.M. et al. 2011, AJ, 141, 15
- Kunder et al. (2011b) Kunder, A.M., Stetson, P.B., Catelan, M., Amigo, P. & De Propris, R. 2012, submitted
- Lardo et al. (2012) Lardo, C., Milone, A. P., Marino, A. F., et al. 2012, A&A, 541, 141
- Layden & Sarajedini (2003) Layden, A. & Sarajedini, A. 2003, AJ, 125, 208
- Lee & Carney (1999a) Lee, J.-W. & Carney, B.W. 1999, AJ, 117, 2868
- Lee & Carney (1999b) Lee, J.-W. & Carney, B.W. 1999, AJ, 118, 1373
- Lee et al. (2009) Lee, J-W., Lee, J., Kang, Y-W., Lee, Y-W., Han, S-I., Joo, S-J., Rey, S-C., Yong, D. 2009, ApJ, 695, L78
- López-Corredoira et al. (2007) López-Corredoira, M., Momany, Y., Zaggia, S. & Cabrera-Lavers, A. 2007, ApJ, 472, 47
- Majaess et al. (2012) Majaess, D., Turner, D., Gieren, W. & Lane, D. 2012, ApJ, 752, 10
- Marconi et al. (2003) Marconi, M., Caputo, F., Di Criscienzo, M. & Castellani, M. 2003, AJ, 596, 299
- Marconi & Degl’Innocenti (2007) Marconi, M. & Degl’Innocenti, S. 2007 A&A, 474, 557
- Marconi (2009) Marconi, M. 2009, AIPC, 1170, 223
- Marconi et al. (2011) Marconi, M., Bono, G., Caputo, F., Piersimoni, A. M., Pietrinferni, A. & Stellingwerf, R. F. 2011, ApJ, 738, 111
- Martin (2004) Martin, N.F., Ibata, R.A., Bellazzini, M., Irwin, M.J., Lewis, G.F., & Dehnen, W. 2004, MNRAS, 348, 12
- Menzies (1974) Menzies, J. 1974, MNRAS, 168, 177
- Milone et al. (2008) Milone, A. P., et al. 2008, ApJ, 673, 241
- Milone et al. (2009) Milone, A. P., et al. 2009, A&A 503, 755
- Nemec (2004) Nemec, J. 2004, AJ 127, 2185
- Olech et al. (1999) Olech, A., Kaluzny, J., Thompson, I. B., Pych, W., Krzeminski, W. & Shwarzenberg-Czerny, A. 1999, AJ, 118, 442
- Olech et al. (2001) Olech, A., Kaluzny, J., Thompson, I. B., Pych, W., Krzemiński, W. & Schwarzenberg-Czerny, A. 2001, MNRAS, 321, 421
- Papadakis et al. (2000) Papadakis, I.; Hatzidimitriou, D.; Croke, B. F. W.; Papamastorakis, I. 2000, AJ, 119, 851
- Piersimoni et al. (2002) Piersimoni, A. M.; Bono, G.; Ripepi, V. 2002, AJ, 124, 1528
- Pietrinferni et al. (2004) Pietrinferni, A., Cassisi, S., Salaris, M., & Castelli, F. 2004, ApJ, 612, 168
- Pietrinferni et al. (2006) Pietrinferni, A., Cassisi, S., Salaris, M., & Castelli, F. 2006, ApJ, 642, 797
- Pietrinferni et al. (2009) Pietrinferni , A., Cassisi, S., Salaris, M., Percival, S. & Ferguson, J. W. 2009 ApJ, 697, 275
- Pritzl et al. (2000) Pritzl, B.J., Smith, H.A., Catelan, M. & Sweigart, A.V. 2000, ApJL, 530, 41
- Pritzl et al. (2003) Pritzl, B.J., Smith, H.A., Stetson, P.B., Catelan, M., Sweigart, A.V., Layden, A.C. & Rich, R.M. 2003, AJ, 126, 1381
- Pritzl et al. (2002) Pritzl, B.J., Smith, H.A., Catelan, M. & Sweigart, A.V. 2002, AJ, 124, 949
- Sandage (1966) Sandage, A., Smith, L.L. & Norton, R.H. 1966, ApJ, 144, 894
- Stetson (2005) Stetson, P.B., Catelan, M. & Smith, H.A. 2005, PASP, 117, 1325
- Sturch (1977) Sturch, C.R. 1977, PASP, 89, 349
- Sollima (2010) Sollima, A., Cacciari, C., Bellazzini, M. & Colucci, S. 2010, MNRAS, 406, 329
- Szeidl et al. (2011) Szeidl, B., Hurta, Zs., Jurcsik, J., Clement, C. & Lovas, M. 2011, MNRAS, 411, 1744
- Székely et al. (2007) Székely, P., Kiss, L. L., Jackson, R., Derekas, A., Csák, B. & Szatmáry, K. 2007, A&A, 463, 589
- Rood & Crocker (1989) Rood, R.T. & Crocker, D.A. 1989, The Use of Pulsating Stars in Fundamental Problems of Astronomy (IAU Colloq. 111), ed. E. G. Schmidt (Dordrecht: Kluwer), 103-119
- Salaris et al. (2008) Salaris, M., Cassisi, S., & Pietrinferni, A. 2008, ApJL, 678, L25
- Saviane et al. (1998) Saviane, I., Piotto, G., Fagotto, F., Zaggia, S., Capaccioli, M., & Aparicio, A. 1998, A&A, 333, 479
- Sbordone et al. (2011) Sbordone, L., Salaris, M., Weiss, A. & Cassisi, S. 2011, A&A, 534, 9
- Sumerel et al. (2004) Sumerel, A.N., Corwin, T. M., Catelan, M., Borissova, J., Smith, H. A. 2004, IBVS 5533
- Valcarce & Catelan (2008) Valcarce, A. A. R. & Catelan, M. 2008, A&A, 487, 185
- Ventura et al. (2009) Ventura, P., Caloi, V., D’Antona, F., Ferguson, J., Milone, A., & Piotto, G.P. 2009, MNRAS, 399, 934
- Walker (1994) Walker, A.R. 1994, AJ, 108, 555
- Walker (1998) Walker, A.R. 1998, AJ, 116, 220
- Wehlau et al. (1999) Wehlau, A., Slawson, R.W. & Nemec, J.M. 1999, AJ, 117, 286
- Wehlau & Butterworth (1990) Wehlau, A. & Butterworth, S. 1990, AJ, 100, 686
- Wehlau & Demers (1977) Wehlau, A. & Demers, S. 1977, A&A, 57, 251
- Zorotovic et al. (2010) Zorotovic, M. et al. 2010, AJ, 139, 357
| Name1 | Name2 | HB Type | Oo-Type | Reference | ||
|---|---|---|---|---|---|---|
| NGC 362 | - | 1.30 | 0.87 | OoI | 21 | Székely et al. (2007) |
| NGC 3201 | - | 1.51 | +0.08 | OoI | 58 | Piersimoni et al. (2002); Layden & Sarajedini (2003) |
| NGC 4590 | M68 | 2.27 | +0.17 | OoII | 12 | Walker (1994) |
| IC 4499 | - | 1.62 | +0.11 | OoI | 62 | Kunder et al. (2011a) |
| Ruprecht 106 | - | 1.78 | 0.82 | OoI | 12 | Kaluzny et al. (1995) |
| NGC 5053 | - | 2.30 | +0.52 | OoII | 6 | Nemec (2004) |
| NGC 6934 | - | 1.56 | +0.25 | OoI | 51 | Kaluzny et al. (2001) |
| NGC 6981 | M72 | 1.48 | +0.14 | OoI | 20 | Dickens & Flinn (1972) |
| NGC 7006 | - | 1.46 | 0.28 | OoI | 43 | Wehlau et al. (1999) |
| NGC 7078 | M15 | 2.33 | +0.67 | OoII | 50 | Corwin et al. (2008) |
| NGC 5139 | wCen | 1.64 | +0.89 | OoII | 84 | Kaluzny et al. (2004); Benko et al. (2006) |
| NGC 5272 | M3 | 1.50 | +0.18 | OoI | 152 | Corwin & Carney (2001) |
| NGC 5466 | - | 1.70 | +0.58 | OoII | 12 | Corwin et al. (1999) |
| NGC 6229 | - | 1.43 | +0.24 | OoI | 29 | Borissova et al. (2001) |
| NGC 6426 | - | 2.15 | +0.58 | OoII | 8 | Papadakis et al. (2000) |
| NGC 6441 | - | 0.44 | 0.73 | OoIII | 25 | Pritzl et al. (2003) |
| NGC 6388 | - | 0.45 | 0.69 | OoIII | 4 | Pritzl et al. (2002) |
| NGC 6266 | M62 | 1.18 | +0.55 | OoI | 74 | Contreras et al. (2010) |
| NGC 6333 | M9 | 1.79 | +0.87 | OoII | 6 | Clement & Shelton (1999b) |
| NGC 6341 | M92 | 2.35 | +0.91 | OoII | 11 | Kopacki (2001) |
| NGC 6362 | - | 1.07 | 0.58 | OoI | 19 | Olech et al. (2001) |
| NGC 6626 | M28 | 1.46 | +0.90 | OoI | 8 | Wehlau & Butterworth (1990) |
| NGC 5904 | M5 | 1.33 | +0.31 | OoI | 52 | Szeidl et al. (2011) |
| NGC 5986 | - | 1.63 | +0.97 | OoII | 6 | Alves et al. (2001) |
| NGC 6121 | M4 | 1.18 | 0.06 | OoI | 15 | Cacciari (1979); Sturch (1977) |
| NGC 6171 | M107 | 1.03 | 0.73 | OoI | 15 | Clement & Shelton (1997); Dickens (1970) |
| NGC 6712 | - | 1.02 | 0.62 | OoI | 7 | Sandage (1966) |
| NGC 6723 | - | 1.10 | 0.08 | OoI | 15 | Menzies (1974) |
| NGC 6864 | M75 | 1.29 | 0.07 | OoI | 8 | Corwin et al. (2003) |
| NGC 5024 | M53 | 2.06 | +0.81 | OoII | 22 | Arellano Ferro et al. (2011) |
| NGC 7089 | M2 | 1.66 | +0.92 | OoII | 18 | Lee & Carney (1999a) |
| NGC 2419 | - | 2.20 | +0.86 | OoII | 28 | Di Criscienzo (2011) |
| NGC 1851 | - | 1.18 | 0.32 | OoI | 19 | Walker (1998) |
| NGC 5286 | - | 1.70 | +0.80 | OoII | 27 | Zorotovic et al. (2010) |
| NGC 2808 | - | 1.18 | 0.49 | OoI | 6 | Kunder et al. (2011b) |
| NGC 6101 | - | 1.98 | – | OoII | 3 | Cohen et al. (2011) |
| NGC 4147 | - | 1.78 | +0.55 | OoI | 5 | Stetson (2005) |
| NGC 6809 | M55 | 1.93 | – | OoI | 4 | Olech et al. (1999) |
| NGC 6715 | M54 | 1.44 | +0.54 | OoI | 52 | Sollima (2010) |