Quantifying non-star formation associated 8m dust emission in NGC 628
Abstract
Combining H and IRAC images of the nearby spiral galaxy NGC 628, we find that between 30-43% of its 8m dust emission is not related to recent star formation. Contributions from dust heated by young stars are separated by identifying H ii regions in the H map and using these areas as a mask to determine the 8m dust emission that must be due to heating by older stars. Corrections are made for sub-detection-threshold H ii regions, photons escaping from H ii regions and for young stars not directly associated to H ii regions (i.e. 10-100 Myr old stars). A simple model confirms this amount of 8m emission can be expected given dust and PAH absorption cross-sections, a realistic star-formation history, and the observed optical extinction values. A Fourier power spectrum analysis indicates that the 8m dust emission is more diffuse than the H emission (and similar to observed H i), supporting our analysis that much of the 8m-emitting dust is heated by older stars. The 8m dust-to-H emission ratio declines with galactocentric radius both within and outside of H ii regions, probably due to a radial increase in disk transparency. In the course of this work, we have also found that intrinsic diffuse H fractions may be lower than previously thought in galaxies, if the differential extinction between H ii regions and diffuse regions is taken into account.
1. Introduction
The 8m dust emission is an attractive star formation rate measure for galaxies, as it provides excellent resolution in nearby low-redshift galaxies. It is also accessible at higher redshift as the rest-frame 8m shifts into other accessible infrared bandpasses. Indeed, the mid-infrared dust emission around 8m broadly correlates with star formation rate indicators such as H (Roussel et al., 2001; Peeters et al., 2004; Wu et al., 2005; Kennicutt et al., 2009), Pa (Calzetti et al., 2005, 2007), far infrared (Peeters et al., 2004; Dale et al., 2005) and radio (Vogler et al., 2005; Wu et al., 2005). However, Calzetti et al. (2005) draw attention to the non-linearity of the 8m dust emission with respect to the number of ionizing photons from H ii regions, raising some concerns about its use as a star formation indicator. Furthermore, Calzetti et al. (2005) also note that the 8m emission is more diffuse than either recombination line emission from ionized gas (H, Paschen-) or 24m emission tracing the hot dust localized to star-forming regions. The goal of this paper is to quantify the galaxy-wide contribution to 8m dust emission from non-star forming sources as a guide for using such emission as a star formation tracer in both local and high-redshift galaxies.
8m dust emission is made up of two main components, aromatic band emission and continuum emission from warm dust grains. In general, the aromatic bands lie between 3-17m, with some of the strongest bands at 3.3, 6.2, 7.7, 8.6, 11.2, and 12.7 m. Each of these bands has been identified with vibrational modes of C-C and C-H bonds of atoms in aromatic rings (see Tielens, 2008, for a recent review). Polycyclic aromatic hydrocarbons (PAHs) are now the widely-accepted carriers of the mid-IR band features (Leger & Puget, 1984, originally suggested by and Allamandola et al., 1985), although other hydrocarbon compounds may contribute as well. For simplicity, we will attribute the emission features to PAHs for the remainder of the paper. Because PAH emission is very bright in photo-dissociated regions (PDRs) surrounding sites of active star formation, it was initially surmised that PAH emission might be a very good star formation rate indicator, at least on global scales (Roussel et al., 2001).
The second component to 8m dust emission is continuum emission. Large dust grains may emit at 8m if they are heated by a very intense radiation field (significant when the radiation field density is times local). But much more important for the 8m emission is the contribution from very small (PAH-sized; Å) grains that are stochastically heated to high effective temperatures. The importance of single-photon heating was made clear by Infra Red Astronomical Satellite (IRAS) observations of diffuse regions which show much more emission at 12 and 25m than expected for classically-sized grains, given the low radiation field intensity (Boulanger et al., 1985; Boulanger & Perault, 1988). To fit these and other observations, both PAHs and very small grains are now included in dust grain models (e.g. Desert et al., 1990; Li & Draine, 2001).
The PAH band emission is now known to have a cirrus component. Band emission associated with the diffuse interstellar medium (ISM) in the Galaxy was first inferred from photometric measurements from the IRAS (Boulanger et al., 1985) and AROME (Giard et al., 1994) and is easily visible in the Spitzer IRAC 8m images from the GLIMPSE survey (Benjamin et al., 2003). Spectroscopic confirmation that the photometric excess (over the expected dust emission) is indeed due to the aromatic emission bands came from the Infra Red Telescope in Space (IRTS; Tanaka et al., 1996) and the Infrared Space Observatory (ISO; Mattila et al., 1996; Sakon et al., 2004). Using mid-IR spectra of interarm regions, Vogler et al. (2005) and Sakon et al. (2007) identify the aromatic bands in the diffuse ISM in the spiral galaxies M83 and NGC 6946, respectively, using ISO and AKARI. Interestingly, these spectroscopic data show distinct variations of the PAH bands (for example, relatively stronger in the 11.3m band) in the diffuse regions, when compared to actively star-forming regions (Vogler et al., 2005; Sakon et al., 2004, 2007). This band variation signals a difference in the PAH molecule population and/or ionization.
Using Spitzer IRS spectroscopy on the SINGS sample of local star-forming galaxies, Smith et al. (2007) separate the PAH bands from the rest of the 8m dust emission, establishing that typically 80% of the 8m dust emission is from the PAH bands (their Figure 12, bottom panel), with presumably the remainder due to continuum emission from warm, stochastically-heated grains. However, scatter from galaxy to galaxy clearly exists and low-metallicity galaxies in particular tend to have low ratios of PAH band emission to warm dust continuum emission (Engelbracht et al., 2005; Cannon et al., 2006).
In this paper, we set out to measure the fraction of 8m dust emission that is not due to recent star formation. While the line dividing ‘recent’ star formation from older generations of stars is somewhat arbitrary, here we will count populations of stars under 100 Myr. The goal is to provide a quantitative warning about using the 8m dust emission from a galaxy as a direct tracer of star formation. We take the nearby face-on galaxy NGC 628 as a test case and tie this determination to H emission, which we assume is entirely powered by photoionisation from the youngest stars. In Section 2, we present the H and Spitzer IRAC data used. Section 3 describes the methods used to first separate 8m dust emission related to H ii regions and then emission related to stars under 10 Myr, stars between 10-100 Myr and stars older than 100 Myr. In Section 4, we present and discuss our results, while in Section 5, we test various systematics within our method. Section 6 presents our conclusions.
2. Data
2.1. NGC 628
We chose to work on the unbarred Sc galaxy NGC 628 because it is relatively nearby (7.2 Mpc; Kennicutt et al. 2011), large in angular size ( arcmin2), virtually face on (i=6∘) and observed in all the bands (H, 8m, 3.6m) we require. NGC 628 is not classified as an AGN either by optical emission lines (Ho et al., 1997) or by mid-IR emission lines (Goulding & Alexander, 2009). Its stellar mass is M☉ (Skibba et al., 2011) and its current star formation rate (SFR) is 0.68 M☉ yr-1(Kennicutt et al., 2011). Based on spectral energy distribution fitting, Aniano et al. (2012) determine that 11.6% of NGC 628’s infrared luminosity comes from dust heated at high radiation field intensities (U ), a typical value among the SINGS sample spirals.
2.2. H data
We use H data obtained at the Kitt Peak National Observatory (KPNO) 0.9m telescope in January 1997 and originally presented in Greenawalt (1998). Narrow-band line and broad-band continuum exposures were taken with 16 dithered exposures of 900s and 480s, respectively. The narrow-band filter used is narrow enough (27 Å) to exclude contamination from the nearby [N ii] line.
A H line-only image was obtained after subtracting a scaled broad-band image with the scale factor determined by comparing the broad-band to narrow-band flux ratio of 94 foreground stars. Using the IDL MMM procedure on these flux ratio values, we reject outliers and determine a mean of 0.806 with a standard deviation of 0.036 (84 non-rejected stars). The standard error on the sample mean is thus only 0.0039 (i.e. only 0.5%); however, this assumes that the foreground stars correctly approximate the narrow-band to broad-band flux ratio of NGC 628’s average stellar population. In light of this possible systematic effect, we will test values changing within the full 1 range of stellar values in Section 5.3 (thus or 4.4%).
Flux calibration was based on standard star observations and the conversion to emission measure performed using the formula appropriate for H and a K plasma:
| (1) |
The point spread function (PSF) of the final H image has a full-width half-maximum (FWHM) of 1.8 arcsec and the images have an rms noise level of 3.8 pc cm-6 with a pixel size of 0.68 arcsec2.
2.3. IRAC data
The 3.6 and 8 m data on NGC 628 were obtained from the SINGS Data Release 5. A tilted plane was fit to both images to subtract the background, after using an iterative algorithm to determine the set of background pixels, see Aniano et al. (2012) for full details.
Next, we created a 8m dust-only map by subtracting a fraction of the image (having first convolved it to the 8 m resolution) in order to remove stellar emission from the image. We subtracted 0.255 times , as in Helou et al. (2004), but also check a range of believable subtraction fractions in Section 5.2. We also note that subtracting the 3.6 m band will remove slightly more than the stellar emission as the 3.3 m PAH band is within the 3.6 m IRAC filter. However, the 3.3 m feature should be only 0.03-0.09 times the strength of the 8m feature (Flagey et al., 2006) which should be around 0.8 of the 8m dust emission. So using a factor of 0.255 for the stellar subtraction, we will only cause a 0.6-1.8% over-subtraction of the dust emission at 8 m.
The rms noise level in the non-stellar image (with a pixel size of 0.75 arcsec2) is erg s-1 cm-2 sr-1 and the measured PSF FWHM is 2.82″(Aniano et al., 2011).
3. Analysis
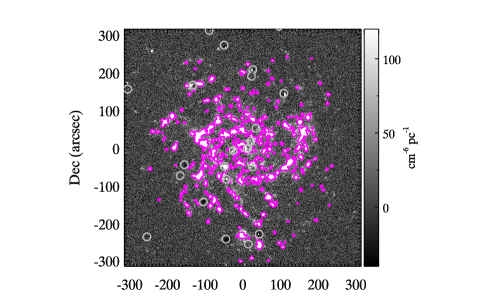
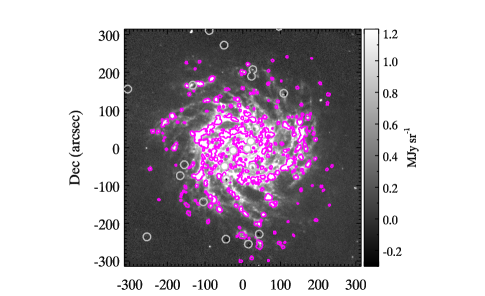
In order to separate the 8m dust emission linked to recent star formation, we first define H ii regions using the hiiphot code (Thilker et al., 2000, 2002) on the H data. H ii regions signal the presence of massive, ionizing stars, which must have ages under 10 Myr. By masking the emission from these regions (see right-hand panel of Fig. 1), we calculate the amount of ‘non-H ii region’ emission for both the H and non-stellar images.
This method has two caveats. First, UV photons can escape from H ii regions, heating PAHs outside of their defined boundaries. Secondly, we miss some star-formation by only using H emission. Some low mass young clusters will be under our detection threshold and so included in the non-H ii region emission. Similarly, a minority of H ii regions maybe very heavily attenuated and thus not detectable in H. Below, we explain how we put limits on these contributions, thereby arriving at an amount of 8m dust heated by 10 Myr stars.
A further consideration is that stars between 10 and 100 Myr should contribute significantly to the heating of PAHs outside of H ii regions (Peeters et al., 2004). These stars are related to ‘recent’ star formation, as the term is usually used by the extragalactic community, so we will separately estimate the contribution of these stars to the non-stellar image, finally arriving at a firm lower limit to how much 8m dust emission must be related to purely old stellar populations.
3.1. Identification of HII regions
hiiphot was run on the optical data with default parameters, including a signal-to-noise (S/N) cutoff of 5. Different emission measure (EM; units of pc cm-6) slope cutoff values of 1, 1.5, 2, and 4 cm-6 were specified. These different EM cutoffs control how far H ii regions grow from initially identified H ii region ‘seeds’; smaller values of EM result in larger H ii regions. A EM cutoff of 1.5 cm-6 is the recommendation from Thilker et al. (2000), a value motivated by wanting to recover as much flux spatially linked to an ionizing sources as possible. But we also keep maps based on a wider range of EM cutoff in order to investigate how the definition of an H ii region changes our results (see Section 5.6).
The noise level and resolution of the data affect how hiiphot finds H ii regions and we investigate these systematics in Section 5.4. Because we wish to define H ii regions on a scale relevant to the 8m image with its larger (2.8″) PSF, the minimum resolution we can achieve with this analysis is a physical scale of 98 pc. Thus we convolve the H image to reach this resolution and also resample to a pixel size of 1.32 = 43.6 pc pixel-1. In the convolved H image, the noise is at a level of 3.8 pc cm-6 (1).
The output of hiiphot produces (among other products) an integer mask identifying H ii region pixels (values 1), non-H ii region pixels (0), and pixels masked from the start (-32768; bright foreground stars). Fig. 1 shows the outlines of the determined H ii regions (with EM=1.5 cm-6 ) on both the H image and over the 8 m dust image.
3.2. Attenuation correction
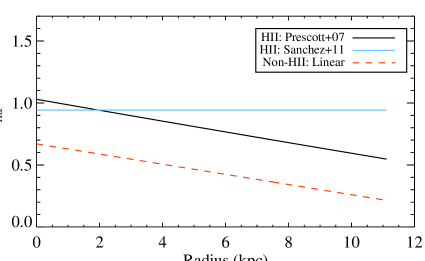
The H map must be corrected for H photons lost to dust absorption and scattering. Integral field spectroscopic data of NGC 628 determines V-band attenuations (AV) using the Balmer decrement method wherever both H and H emission lines are detected (mostly H ii regions; Sánchez et al., 2011). No radial variation in the AV values of these regions is found, with an average AV of (but large scatter at all radii). Comparing H and 24m emission, Prescott et al. (2007) calculate AV values in 500 pc apertures centered on bright 24 m peaks, similarly selecting for H ii regions. Using this method, a radial gradient is found, with AHα declining by -0.53 dex out to . Figure 2 shows the comparison of the two H ii-region extinctions, together with that for diffuse regions (see below). As both the average gas density and the metallicity decline with radius, we select the radially-declining version of the H ii region extinction correction as the better physically motivated. However, we update the values from Prescott et al. (2007), correcting the effect of an incorrectly calibrated H image and using the newer calibration coefficient of Calzetti et al. (2007) to derive a central AHα of 1.03.
Evaluating the attenuation in the diffuse regions of galactic disks is even more difficult. Here, we choose to use the dust surface density map from Aniano et al. (2012) in order to estimate the attenuation in the diffuse regions. Matching the H ii region attenuation, we assume a linear functional form. We find a dust surface density of M☉ kpc-2 in a diffuse region toward the center of the galaxy and M☉ kpc-2 at the edge of the detected region in the dust map, at approximately 9 kpc. Converting to extinction via (Aniano et al., 2012):
| (2) |
we obtain the H attenuation, after additionally converting from V band to H. However, we assume that the emission, on average, originates in the midplane of the galaxy, so we take half of these attenuations, as shown by the red dashed line in Fig. 2. Additionally, we apply the foreground Milky Way extinction from Schlegel et al. (1998).
3.3. Annular photometry
We choose to analyze the data in large annular regions, in order to have enough signal-to-noise to determine the non-H ii region emission level even in the outer regions of NGC 628. The annuli all have width of ″=1.1 kpc. Using the integer masks produced by hiiphot, we compute the H ii region and non-H ii region flux in each annular region (hereafter denoted and , where is defined by ). Then, to account for diffuse emission contained within the H ii regions but not actually related to the H ii regions, we take the average non-H ii region flux per pixel within each annulus and multiply by the number of H ii region pixels. This value is subtracted off the annular H ii region flux and added to the annular non-H ii region flux for both H and 8m data. While the image is already background subtracted as explained in Section 2.3, a large (width of 50″=1.8 kpc) outer annulus around the whole galaxy is used for background subtraction of the H image from 100 to 150″ beyond .
Using this method and not yet applying an extinction correction, we determine a non-H ii region fraction of 37% (commonly called a ‘diffuse’ H fraction). We note that this value is lower (by 7%) than that reported in Thilker et al. (2002), who use identical data and the same code. This difference results from the different accounting of diffuse flux within the H ii regions. Here, we have subtracted the average non-H ii region surface brightness from within a given H ii region’s radial annulus, while Thilker et al. (2002) use a more sophisticated approach that interpolates the background using information immediately outside each H ii region. As the H surface brightness is generally higher immediately outside of H ii regions, this approach results in higher diffuse levels subtracted for each H ii region. Here, we would only like to subtract the H emission essentially from ‘in front’ of the H ii region, not that linked to it, hence taking the annular average approach.
3.4. contributions from 10 Myr stars
The non-H ii region 8m flux cannot be directly equated with the 8m flux produced by stars older than 10 Myr for two reasons. First, photons escape from H ii regions and secondly, low-mass or highly-embedded clusters may not be detectable in the H image.
Unfortunately, integrated UV escape fractions for H ii regions have not received much attention in the literature (line-of-sight attenuations are more the norm), although escape fractions due to ionizing (Lyman continuum) photons have. Such studies generally conclude that leaking ionizing photons power the diffuse H emission, since other potential sources (shocks from mechanical feedback or in-falling gas, photoionization from post-AGB stars and X-ray binaries) appear unable to provide enough ionizing flux (e.g. Ferguson et al., 1996). Indeed, spectroscopic data confirm that photoionization is dominant, although not the only ionizing source in galaxies (Martin, 1997). How the ionizing radiation permeates so far away from H ii regions remains partly mysterious (e.g. Seon, 2009); but the inhomogeneity of the ISM and the low recombination rate in low density regions probably suffice as explanations (Miller & Cox, 1993; Dove & Shull, 1994; Zurita et al., 2002). Dong & Draine (2011) argue that much of the diffuse H emission may come from regions not in ionization equilibrium, including emission from plasma recombining after the photoionization source is removed.
In any case, escaping Lyman continuum photons are almost certainly accompanied by longer-wavelength UV photons, the photons most effective at exciting PAHs. While the interception of ionizing versus UV photons is due to different sources (i.e. atomic hydrogen and dust, respectively), if the escape fraction is primarily mediated by physical holes in the cocoon of dust and gas around H ii regions, the escape fractions should be similar. Although the exact ratio between UV and ionizing photon escape fractions is not well constrained, we will assume the fractions are equivalent. Later, we also discuss the results if twice the fraction of UV photons escape compared to the ionizing photon fraction (see Section 5.1). Thus, the non-H ii region also gives a signal about how much UV flux has escaped H ii regions and is available to excite PAHs and heat small dust grains. To estimate the amount of 8m emission powered by these escaping UV photons, we take the diffuse H emission and multiply by the / ratio found for the H ii regions.
One caveat to using the non-H ii region to correct for escaping UV photons is that some of the non-H ii region H is scattered off of dust instead of signaling in-situ ionization. Recent studies of high-latitude diffuse regions in the Milky Way estimate that approximately 20% of the H emission is originally from disk H ii regions and scattered by dust back down towards the disk (Witt et al., 2010; Brandt & Draine, 2012). A similar fraction is likely to hold in the non-H ii regions and we apply such a correction here, subtracting 20% from the non-H ii region before using it to correct for escaping UV photons from H ii regions.
Secondly, we consider the contribution from very young stars (10 Myr) that lie outside of our defined H ii regions. Our minimal H luminosity region detected is erg s-1. An individual O7 V star produces an H luminosity of erg s-1, so we can detect regions that only host one or very few ionizing stars. However, some low-mass clusters will not have any ionizing stars and thus not be detected using hiiphot. We find that H ii regions with low H luminosity have lower / ratios (by about a factor 2) than more luminous H ii regions. This smaller ratio indicates that while these low H luminosity clusters have an ionizing star or two, their IMF is not fully sampled and they have fewer than average bright-UV emitting stars (B-type). Assuming other, equally young, clusters have higher B-star to ionizing star ratios, we would also like to count their contribution to the 10 Myr . The twice lower / indicates that we are missing about half of the 8m emission that would be measured with a fully sampled IMF. The total H luminosity of the low-luminosity (but detected) clusters, is only 5% of the total, so we estimate we need to re-attribute about 2.5% of the non-H ii region to be associated to 10 Myr stars.
We also likely miss some very highly attenuated H ii regions. However, Prescott et al. (2007) compared H and 24m maps for the SINGS galaxies and determined very few (%) such regions exist in normal spiral galaxies. As a rough correction, we subtract 4% of the H ii region from the non-H ii region and attribute it to H ii region . Combining the sub-ionizing and embedded contributions, the subtraction factor becomes 6.5%.
We first perform this correction for sub-ionizing young clusters (Equations 3 and 4), then the correction for escaping UV photons (Equation 5 and 6):
| (3) |
| (4) |
| (5) |
| (6) |
3.5. contributions from 10 to 100 Myr stars
Stars remain UV bright and thus effective at heating PAHs and small grains up to approximately 100 Myr. Such young stars are still tied to recent star formation, so we would like to estimate their contribution to the 8m dust emission. For both the PAH and dust heating, we estimate the contribution based upon their expected UV flux (912-3000Å) of 10-100 Myr stars. Using Bruzual & Charlot (2003) models, with a solar metallicity and Chabrier IMF, we find that the expected UV flux of stars between 10-100 Myr is 0.49 times that of the stars younger than 10 Myr. Note that these models are based on an exponentially decaying SFR with a timescale of 5 Gyr (eqn. 6 of Noeske et al., 2007).
Assuming that the UV photons of 10-100 Myr stars are equally effective at producing 8m dust emission, then 0.49 times the from Myr stars should be produced by 10-100 Myr stars. So, we have:
| (7) |
However, this almost certainly leads to an overestimate because the 10-100 Myr stars are probably less effective at heating PAHs and dust for several reasons. First, they are generally further away from dust clouds so the number of their photons intercepted by dust is likely lower. Secondly, the older stars’ UV emission is not as blue and thus will have a reduced cross-section. Thirdly, some of the 8m dust emission from H ii regions is actually a secondary product of the Lyman continuum photons, with PAHs excited by Lyman-, Balmer lines, and 2-photon continuum. As we are most concerned with providing a lower limit to the amount of from 100 Myr stars, we keep the overestimate as a safe approach, thus:
| (8) |
| Quantity | Flux |
|---|---|
| (erg s-1 cm-2) | |
4. Results
4.1. Integrated values
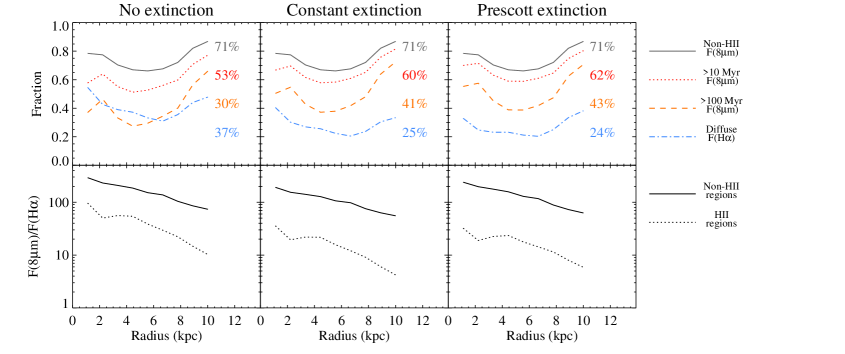
Excluding star-forming regions identified by hiiphot, we arrive at a total (out to ) non-HII region dust fraction of 71% in NGC 628. Then, correcting for other contributions from very young (10 Myr) stars we arrive at a fraction of 62%. Considering the amount of UV produced by 10-100 Myr stars (see Section 3.5), we estimate a lower limit to the amount of 8m dust emission heated by sources other than young stars as 43%. These are all much higher values than the non-H ii region fraction, determined to be only 24%, after applying the differential extinction correction.
Thus the non-star forming component of the 8m dust emission is significant compared to the emission directly associated with young stars in NGC 628. Star formation rates computed based on the total 8m dust emission thus trace partly the current star formation rate tied to the O and B stars, but also take into account emission that is heated by the integrated population of stars found in the field. This latter contribution may change from galaxy to galaxy and thus pollute the estimates of star formation rates. Future work on additional galaxies will show if this is the case.
4.2. Radial trends
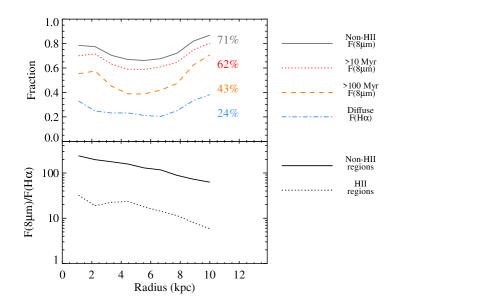
Fig. 3 shows the radial trends of the dust fractions contained outside of H ii regions (grey line), heated by stars older than 10 Myr (red dotted line) and heated by stars older than 100 Myr (orange dashed line). The blue dot-dashed line shows the fraction of H emission located outside of H ii regions.
For all of the fractions, we see a dip with a minimum at 4.4 kpc, the radius at which the brightest H ii regions are found in NGC 628. With the 8m dust emission dominated by these bright regions in this annulus, a lower fraction of non-star formation related 8m dust emission is expected. After this dip, a gradual increase with radius is seen. This increase is probably due to the relatively greater amount of quiescent gas (and dust) at larger radii. Thus as star forming regions become more sparse in the outer regions of the galaxy, photons from older stars become correspondingly more dominant in producing 8m dust emission.
We also note the decline of the / ratio for both the H ii regions and the non-H ii regions, seen in the bottom panel of Fig. 3. This decline is expected because the gas density declines with radius and thus the disk transparency (assuming a relatively constant dust-to-gas ratio) increases. There are simply fewer PAH molecules to absorb stellar photons, while there are still sufficient hydrogen atoms to absorb eV photons. Potentially, there is also a contribution from the metallicity gradient within the disk as PAHs are observed to be deficient at low metallicities (e.g. Madden, 2000; Engelbracht et al., 2005; Galliano et al., 2005). This observed radial trend highlights the importance of performing this analysis in radial bins.
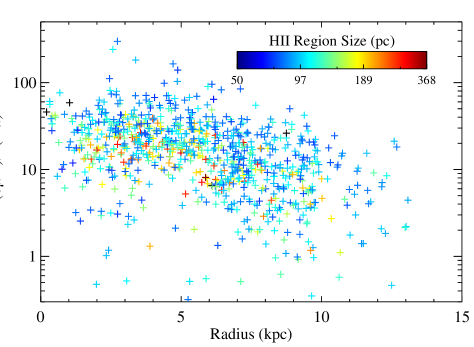
4.3. / ratios in individual H ii regions
Fig. 4 shows the / ratios of individual H ii regions against their galactocentric radius. To make this plot, only HII regions with 8m surface brightnesses higher than 10% above the subtracted background were used (832 of 1055 regions), avoiding those regions whose individual 8m flux is not well determined. As previously seen with the annular mean, the ratio clearly declines with radius, but there is a very large spread at all radii (up to a factor 100). Neither H ii region size (shown as symbol color in Fig. 4) nor H luminosity (not shown, but similar appearance) appear to correlate with the / ratio.
4.4. Fourier power spectrum analysis
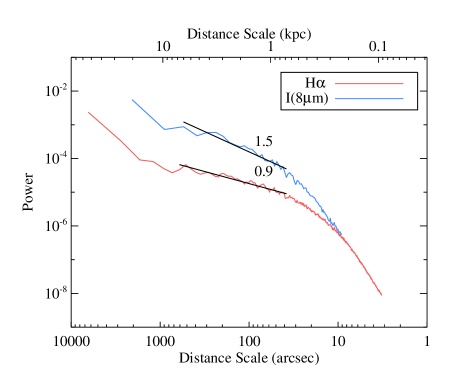
As an independent test, we perform a Fourier power spectrum comparison between the H and images. We use the native-resolution and original pixel scale images, deprojected to a face-on orientation and ignoring scales below twice the PSF FWHM transformed into the deprojected plane. We use IDL to compute the 2-dimensional discrete Fourier transform and then take the square of this complex array to arrive at the power spectrum image. We azimuthally average this 2-dimensional power spectrum to obtain the power at each linear scale. This 1-dimensional average power spectrum is shown in Fig. 5 for both H and dust images.
The slope of the H power spectrum is clearly shallower than that of the 8m dust emission. We choose to fit the power spectrum slope from 20-200 arcseconds ( 0.7-7 kpc) in both images, as both appear approximately power-law in this region. The power-law slopes are and for H and dust images, shown as solid lines in Fig. 5, respectively. The value found for the 8m dust image is comparable to the slope found for the H i emission over similar (0.8-8 kpc) scales by Dutta et al. (2008). This similarity signals that there is indeed 8m dust emission distributed like the neutral (and not necessarily star-forming) gas.
The power-law slope found for the H image is somewhat similar to two studies that find slopes of and for the large-scale power-law slope for H images of M33 Elmegreen et al. (2003); Combes et al. (2012). However, not all galaxies have such shallow H slopes, in the same paper, Elmegreen et al. (2003) report a slope of for NGC 5055 which is closer to the prediction for a turbulent medium (predicted value of ).
In NGC 628, the relative steepness of the dust power spectrum compared to that of the H image shows that the 8m dust emission is distributed on larger scales than the H emission. This result fits nicely with the larger non-H ii region dust fraction than for the non-H ii region fraction we find in the above analysis.
4.5. A simple model
It has long been suggested that old stars significantly contribute to the FIR emission of galaxies, both from studies of our own Galaxy and external galaxies (e.g. Lonsdale Persson & Helou, 1987; Buat & Deharveng, 1988; Trinchieri et al., 1989; Bloemen et al., 1990; Sodroski et al., 1997; Draine et al., 2007). Furthermore, Groves et al. (2012) have recently demonstrated that exclusively old stars heat the dust found within the bulge of M31. Here, we demonstrate the plausibility that stars older than 100 Myr produce a significant fraction of PAH emission in NGC 628, while the more detailed calculations appear in the Appendix.
We model the stellar emission of NGC 628 using the evolutionary synthesis code of Bruzual & Charlot (2003) and four possible star formation histories (constant, linearly decreasing, exponentially decreasing, peaked at 2 Gyr). The parameters for the linearly decreasing and 2 Gyr-peaked models are based upon Fraternali & Tomassetti (2012) and Zou et al. (2011), respectively, while a decay time of 5 Gyr is used for the exponential model. For each stellar age bin, we then calculate the absorption of this starlight by applying the dust absorption cross-section from the Draine & Li (2007) Milky Way dust model with a PAH mass fraction of 4.6%. The scaling of the dust optical depth is tied to the optical attenuation, as determined in Section 3.2. The dust geometry is assumed to be a shell for the very youngest stellar populations, fading into a mixed star and dust geometry for the older regions, although we note that uniformly applying a mixed geometry produced nearly identical results. The fraction of dust absorption due to PAHs at each wavelength is separated by comparing the PAH and total dust cross-sections. This allows us to capture the effect of increased UV cross-section of the PAHs compared to larger dust grains.
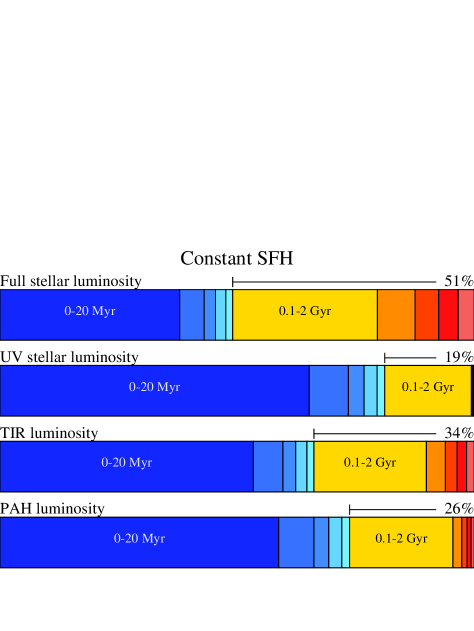
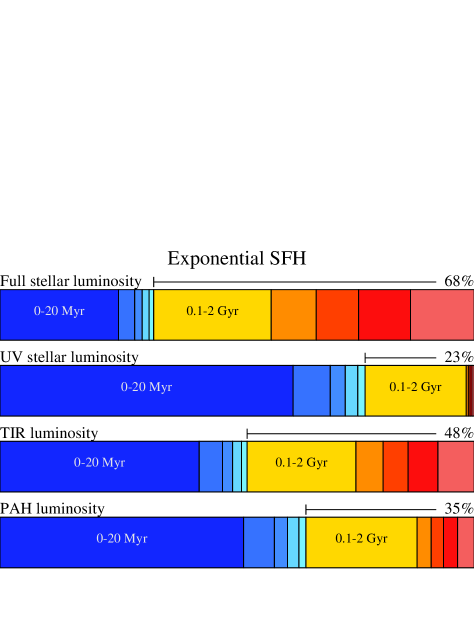
Figure 6 shows the fractional contributions of different age bins for two different star formation histories (constant and exponentially declining) to the total stellar, stellar UV, TIR and PAH emission for the model (attenuation values fixed to those at the center of NGC 628). These plots show that the fractional PAH luminosity from the young stellar population is indeed higher than that of the total TIR, due to the stronger UV absorption of these small molecules. However, both have significant emission attributed to heating from stars older than 100 Myr as shown by the fractions shown for the lowest bar of each plot of Fig. 6, 26% and 35%. While these fractions of old-star heated PAH emission are smaller than what we derive observationally for NGC 628 (43%), shifting to a reasonable twice-as-high escape fraction for the UV as for the ionizing photons lowers the observed fraction to 30% (see Section 5.1), similar to the results of the model. The model and observations appear to be consistent within the uncertainties.
5. Tests of systematics
5.1. UV escape fraction
Arguments can be made as to why the UV escape fraction should be similar to that of the ionizing photons, but because different physical mechanisms are in play, the ratio between the fractions is unlikely to be unity, as we have assumed. In fact, the observed diffuse fraction is only 28% while the escape fraction calculated for the typical H ii-region of 0.7 at 1500Å is 49% (applying the starburst attenuation law from Calzetti et al., 1994). It is thus likely that the UV escape fraction is larger than that for the ionizing photons. Assuming twice the rate of escape for UV photons compared to ionizing photons changes dust fraction from 62% to 53% for 10Myr and from 43% to 30% for 100Myr stars. This change obviously lowers the attributed to old stars, to a level more in line with our simple model. Our observations thus suggest that the old-star powered 8m dust emission fraction lies within these ranges.
5.2. Stellar subtraction at 8m
A fraction () of the 3.6 m IRAC band intensity, , is subtracted from the image in order to obtain a stellar-subtracted 8 m image. We test values of from 0.22-0.30, centered on the adopted value of 0.255 of Helou et al. (2004). Non-H ii region dust fluxes are about 3% greater in the =0.22 images than the =0.30 images, while the H ii region dust are only about 1% greater. As both of these quantities simultaneously increase, the non-H ii region dust fraction only ends up changing by 0.5%, a negligible amount.
The non-H ii and H ii region dust/H ratios change by the full 3% and 1%, respectively. But these few-percent changes are small compared to radial decline seen in both the non-H ii and H ii region ratios.
5.3. H stellar subtraction
Similarly, a fraction of the wide-band image (mostly stellar continuum) is subtracted from the original narrow-band H image (containing both line and continuum emission) in order to obtain an H line-only image. Here, we test the effect of this stellar subtraction on our results. In Section 2.2, we noted that the mean ratio between the narrow-band and broad-band fluxes for 84 foreground stars was 0.806 with a standard deviation of 0.036. We use the values to determine how different our results could be with different .
The subtraction affects the non-H ii regions (-10%, 15%) more than the bright H ii regions (-2.5%, 1%) and especially in the galaxy center where the starlight is most concentrated. But based upon inspection, the different H subtractions do not significantly affect the spatial extent or number of regions selected by hiiphot. Overall, the non-H ii region fraction changes from 34% to 40% for the under- and over-subtracted images (36% for best-value) if no extinction correction is applied (to either H ii or diffuse regions), or only from 22% to 27% (24% for best-value) if our preferred extinction correction is applied. So, as with the 8m stellar subtraction experiment, it appears that the choice of H stellar subtraction value does not strongly influence our results.
5.4. H image properties
Two properties of the H image (resolution and noise) influence how hiiphot identifies HII regions. The resolution here was set to match that of the 8m images, at 2.82 = 98 pc at the 7.2 Mpc distance of NCC 628. Reducing the resolution to 4.23(148 pc, in both the H and 8m images) increases the diffuse fraction from 24% to 27% and thus ends up decreasing the fraction of heated by old stars from 47% to 41%. Testing the effect of using a finer scale would be more informative, but the fact that there is such a decrease as we degrade the resolution signals that even less of the H emission may truly lie outside of H ii regions and thus even more of the 8m emission is in fact heated by old stars. Thus our conclusion that this number is a lower limit will hold.
We add Poisson noise in both the narrowband and broadband images separately and re-subtract to obtain a line-only image. We add more and more noise (mimicking a proportional decrease in exposure time between narrow and broad band images) until a rms noise level of 20 pc cm-6 is obtained in the line-only image. Using such noisier data does not change any of our results within a 2% margin.
Increasing the noise by a significant factor was a less important effect, producing only a 2% change in the final estimate of the fraction of powered by old stars.
5.5. Dust attenuation effects
Correcting the H emission for dust attenuation significantly changes the non-H ii region (i.e. ‘diffuse’) fraction of . This effect can be seen clearly by following the blue line in the upper panels of Fig. 7. With absolutely no extinction correction applied, the non-H ii fraction is 37%. With the H ii region correction from Sánchez et al. (2011) and the non-H ii region correction from the Aniano et al. (2012) dust map, the fraction is 25%. With our adopted extinction correction of Prescott et al. (2007) (corrected via Calzetti et al. 2007) for H ii regions and again the dust map for the non-H ii regions, it is only 24%. Thus, considering the differential extinction between within and outside of H ii regions is very important to determining the intrinsic amount of diffuse H emission. Values may therefore be lower than the % commonly reported by studies that do not take such differential extinction into account.
As the amount of diffuse H emission determines how much diffuse 8m we attribute to emission escaping from H ii regions and thus associated to young stars, the extinction correction noticeably propagates through to our 8m fractions attributed to 10 Myr and 100 Myr populations, as seen in Fig. 7. Accounting for differential extinction between the H ii regions and diffuse regions leaves about 10% more 8m emission to be attributed to old stellar populations. Thus the extinction correction is an important systematic, although the difference between our two adopted extinction corrections is fairly minimal, only at the 2% level.
5.6. Emission measure cutoff effects
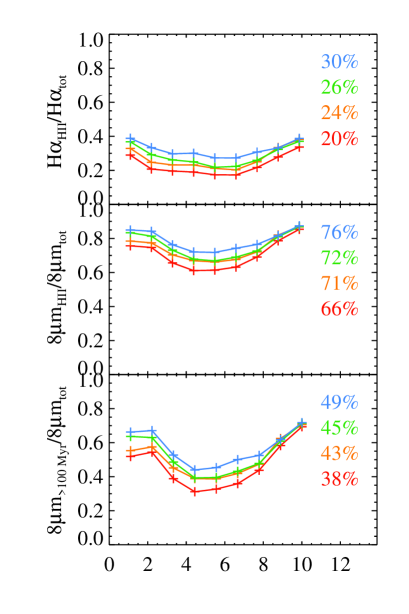
The emission measure cutoff specifies the gradient in EM (measured in units of cm-6 pc) at which the growth of H ii regions is terminated by hiiphot. Lower EM cutoffs result in larger H ii regions. Figure 8 shows that decreasing the EM cutoff lowers both the and non-H ii fractions, as expected. These changes are significant, with the non-H ii fraction decreasing from 30% to 20% (Prescott extinction correction applied), the non-H ii fraction from 76% to 66% and the lower limit on the from old stars from 49% to 38%. However, inspection shows that the H ii regions for EM of 4 misses much of their contiguous H emission, and those for EM of 1 are likely too large. Still, we expect the uncertainty on defining the exact boundary on H ii regions to contribute an 5% uncertainty on our derived lower limit to the amount of 8m dust emission that is heated by stars older than 100 Myr.
6. Conclusions
Masking out H ii regions with the help of an H image and the hiiphot code, we find that 30-43% of the non-stellar in NGC 628 is due to PAH molecules and dust heated by stars older than 100 Myr. Our analysis shows that 38-47% is heated by stars under 10 Myr, while 21-23% is heated by stars between 10 and 100 Myr. The major parameter contributing to the ranges of these estimates is the unknown escape fraction of UV photons compared to ionizing photons.
We thoroughly investigate the systematic effects of background subtraction, stellar emission subtraction (for both 8m and H images), extinction correction and emission measure cutoff and estimate a combined systematic uncertainty of 10% on the lower limit for non-star formation related . Thus this work rigorously establishes that a significant fraction of in NGC 628 is not due to heating from the youngest population of stars. The quantity of this non-star formation related emission may be different from galaxy to galaxy, complicating measures of the star formation rate determined using 8m emission at both high and low redshift.
We also find that the / ratio declines with galactocentric radius in H ii regions by a factor 5.4 and outside of H ii regions by a factor 4.0. This decline is likely caused by the easier destruction or more difficult formation of PAHs in low metallicity regimes. However, PAH abundance may not be the full answer. Changes in PAH population, in terms of size distribution or ionization state, could also cause a reduction in 8m band emission.
In the process of this work, we find that the fraction of non-H ii region (commonly called diffuse) H emission is lower than usually reported, taking into account the higher preferential extinction of H ii regions. With our adopted extinction model, we find an intrinsic non-H ii region fraction of only 24%. This may be compared to 37% when differential extinction between HII regions and diffuse emission is not taken into account.
Independent of the H ii region based analysis, we compare the power spectra of the 8m dust and H images and find that the 8m dust image has more power at lower spatial frequencies (larger scales) compared to the H image. This distribution confirms the more diffuse nature of the 8m dust emission. The power-law slope of the 8m dust power spectrum matches well with that of the H i emission in NGC 628, suggesting that the 8m emission is more strongly linked to the H i gas than to star formation.
References
- Allamandola et al. (1985) Allamandola, L. J., Tielens, A. G. G. M., & Barker, J. R. 1985, ApJ, 290, L25
- Aniano et al. (2011) Aniano, G., Draine, B. T., Gordon, K. D., & Sandstrom, K. 2011, PASP, 123, 1218
- Aniano et al. (2012) Aniano, G. et al. 2012, ApJ, 756, 138
- Benjamin et al. (2003) Benjamin, R. A. et al. 2003, PASP, 115, 953
- Bloemen et al. (1990) Bloemen, J. B. G. M., Deul, E. R., & Thaddeus, P. 1990, A&A, 233, 437
- Boulanger et al. (1985) Boulanger, F., Baud, B., & van Albada, G. D. 1985, A&A, 144, L9
- Boulanger & Perault (1988) Boulanger, F. & Perault, M. 1988, ApJ, 330, 964
- Brandt & Draine (2012) Brandt, T. D. & Draine, B. T. 2012, ApJ, 744, 129
- Bruzual & Charlot (2003) Bruzual, G. & Charlot, S. 2003, MNRAS, 344, 1000
- Buat & Deharveng (1988) Buat, V. & Deharveng, J. M. 1988, A&A, 195, 60
- Calzetti et al. (1994) Calzetti, D., Kinney, A. L., & Storchi-Bergmann, T. 1994, ApJ, 429, 582
- Calzetti et al. (2005) Calzetti, D. et al. 2005, ApJ, 633, 871
- Calzetti et al. (2007) —. 2007, ApJ, 666, 870
- Cannon et al. (2006) Cannon, J. M. et al. 2006, ApJ, 647, 293
- Churchwell et al. (2006) Churchwell, E. et al. 2006, ApJ, 649, 759
- Combes et al. (2012) Combes, F. et al. 2012, A&A, 539, A67
- da Cunha et al. (2008) da Cunha, E., Charlot, S., & Elbaz, D. 2008, MNRAS, 388, 1595
- Dale et al. (2005) Dale, D. A. et al. 2005, ApJ, 633, 857
- Desert et al. (1990) Desert, F.-X., Boulanger, F., & Puget, J. L. 1990, A&A, 237, 215
- Dong & Draine (2011) Dong, R. & Draine, B. T. 2011, ApJ, 727, 35
- Dove & Shull (1994) Dove, J. B. & Shull, J. M. 1994, ApJ, 430, 222
- Draine (2011) Draine, B. T. 2011, ApJ, 732, 100
- Draine & Li (2007) Draine, B. T. & Li, A. 2007, ApJ, 657, 810
- Draine et al. (2007) Draine, B. T. et al. 2007, ApJ, 663, 866
- Dutta et al. (2008) Dutta, P., Begum, A., Bharadwaj, S., & Chengalur, J. N. 2008, MNRAS, 384, L34
- Elmegreen et al. (2003) Elmegreen, B. G., Leitner, S. N., Elmegreen, D. M., & Cuillandre, J.-C. 2003, ApJ, 593, 333
- Engelbracht et al. (2005) Engelbracht, C. W., Gordon, K. D., Rieke, G. H., Werner, M. W., Dale, D. A., & Latter, W. B. 2005, ApJ, 628, L29
- Ferguson et al. (1996) Ferguson, A. M. N., Wyse, R. F. G., Gallagher, III, J. S., & Hunter, D. A. 1996, AJ, 111, 2265
- Flagey et al. (2006) Flagey, N., Boulanger, F., Verstraete, L., Miville Deschênes, M. A., Noriega Crespo, A., & Reach, W. T. 2006, A&A, 453, 969
- Fraternali & Tomassetti (2012) Fraternali, F. & Tomassetti, M. 2012, ArXiv e-prints
- Galliano et al. (2005) Galliano, F., Madden, S. C., Jones, A. P., Wilson, C. D., & Bernard, J.-P. 2005, A&A, 434, 867
- Giard et al. (1994) Giard, M., Lamarre, J. M., Pajot, F., & Serra, G. 1994, Astron. Astrophys. 286, 286, 203
- Goulding & Alexander (2009) Goulding, A. D. & Alexander, D. M. 2009, MNRAS, 398, 1165
- Greenawalt (1998) Greenawalt, B. E. 1998, Thesis (PHD). NEW MEXICO STATE UNIVERSITY, 16
- Groves et al. (2012) Groves, B. et al. 2012, ArXiv e-prints
- Helou et al. (2004) Helou, G. et al. 2004, ApJS, 154, 253
- Ho et al. (1997) Ho, L. C., Filippenko, A. V., & Sargent, W. L. W. 1997, ApJS, 112, 315
- Kennicutt et al. (2011) Kennicutt, R. C. et al. 2011, PASP, 123, 1347
- Kennicutt et al. (2009) Kennicutt, Jr., R. C., Hao, C.-N., Calzetti, D., Moustakas, J., Dale, D. A., Bendo, G., Engelbracht, C. W., Johnson, B. D., & Lee, J. C. 2009, ApJ, 703, 1672
- Leger & Puget (1984) Leger, A. & Puget, J. L. 1984, A&A, 137, L5
- Li & Draine (2001) Li, A. & Draine, B. T. 2001, ApJ, 554, 778
- Lonsdale Persson & Helou (1987) Lonsdale Persson, C. J. & Helou, G. 1987, ApJ, 314, 513
- Madden (2000) Madden, S. C. 2000, New Astronomy Reviews, 44, 249
- Martin (1997) Martin, C. L. 1997, ApJ, 491, 561
- Mattila et al. (1996) Mattila, K., Lemke, D., Haikala, L. K., Laureijs, R. J., Leger, A., Lehtinen, K., Leinert, C., & Mezger, P. G. 1996, A&A, 315, L353
- Miller & Cox (1993) Miller, III, W. W. & Cox, D. P. 1993, ApJ, 417, 579
- Noeske et al. (2007) Noeske, K. G., Faber, S. M., Weiner, B. J., Koo, D. C., Primack, J. R., Dekel, A., Papovich, C., Conselice, C. J., Le Floc’h, E., Rieke, G. H., Coil, A. L., Lotz, J. M., Somerville, R. S., & Bundy, K. 2007, ApJ, 660, L47
- Peeters et al. (2004) Peeters, E., Spoon, H. W. W., & Tielens, A. G. G. M. 2004, ApJ, 613, 986
- Prescott et al. (2007) Prescott, M. K. M. et al. 2007, ApJ, 668, 182
- Roussel et al. (2001) Roussel, H., Sauvage, M., Vigroux, L., & Bosma, A. 2001, A&A, 372, 427
- Sakon et al. (2004) Sakon, I., Onaka, T., Ishihara, D., Ootsubo, T., Yamamura, I., Tanabé, T., & Roellig, T. L. 2004, ApJ, 609, 203
- Sakon et al. (2007) Sakon, I. et al. 2007, PASJ, 59, 483
- Sánchez et al. (2011) Sánchez, S. F., Rosales-Ortega, F. F., Kennicutt, R. C., Johnson, B. D., Diaz, A. I., Pasquali, A., & Hao, C. N. 2011, MNRAS, 410, 313
- Schlegel et al. (1998) Schlegel, D. J., Finkbeiner, D. P., & Davis, M. 1998, ApJ, 500, 525
- Seon (2009) Seon, K.-I. 2009, ApJ, 703, 1159
- Skibba et al. (2011) Skibba, R. A. et al. 2011, ApJ, 738, 89
- Smith et al. (2007) Smith, J. D. T. et al. 2007, ApJ, 656, 770
- Sodroski et al. (1997) Sodroski, T. J., Odegard, N., Arendt, R. G., Dwek, E., Weiland, J. L., Hauser, M. G., & Kelsall, T. 1997, ApJ v.480, 480, 173
- Tanaka et al. (1996) Tanaka, M., Matsumoto, T., Murakami, H., Kawada, M., Noda, M., & Matsuura, S. 1996, PASJ, 48, L53
- Thilker et al. (2000) Thilker, D. A., Braun, R., & Walterbos, R. A. M. 2000, AJ, 120, 3070
- Thilker et al. (2002) Thilker, D. A., Walterbos, R. A. M., Braun, R., & Hoopes, C. G. 2002, AJ, 124, 3118
- Tielens (2008) Tielens, A. G. G. M. 2008, ARA&A, 46, 289
- Trinchieri et al. (1989) Trinchieri, G., Fabbiano, G., & Bandiera, R. 1989, ApJ, 342, 759
- Vogler et al. (2005) Vogler, A., Madden, S. C., Beck, R., Lundgren, A. A., Sauvage, M., Vigroux, L., & Ehle, M. 2005, A&A, 441, 491
- White et al. (2000) White, III, R. E., Keel, W. C., & Conselice, C. J. 2000, ApJ, 542, 761
- Witt et al. (2010) Witt, A. N., Gold, B., Barnes, III, F. S., DeRoo, C. T., Vijh, U. P., & Madsen, G. J. 2010, ApJ, 724, 1551
- Wu et al. (2005) Wu, H., Cao, C., Hao, C.-N., Liu, F.-S., Wang, J.-L., Xia, X.-Y., Deng, Z.-G., & Young, C. K.-S. 2005, ApJ, 632, L79
- Zou et al. (2011) Zou, H., Zhang, W., Yang, Y., Zhou, X., Jiang, Z., Ma, J., Wu, Z., Wu, J., Zhang, T., & Fan, Z. 2011, AJ, 142, 16
- Zurita et al. (2002) Zurita, A., Beckman, J. E., Rozas, M., & Ryder, S. 2002, A&A, 386, 801
Appendix A A model of PAH excitation by young and old stellar populations
A.1. Stellar spectral synthesis
Stellar spectra corresponding to specified age ranges are created using the spectral synthesis code of Bruzual & Charlot (2003) with Padova 1994 evolutionary tracks and a Chabrier IMF. We test metallicities of solar and two sub-solar values (z=0.02, 0.008 and 0.004) and a range of star formation histories. The first SFH is constant and the second is an exponential model with a timescale of 5 Gyr. The third is a linear model, based upon equation 9 of Fraternali & Tomassetti (2012) and the they determined specifically for NGC 628. The final SFH is based upon the stellar population reconstruction from panchromatic photometry in Zou et al. (2011). This SFH is shown in their fig. 5 and peaks at 2 Gyr ago. We normalize all the SFHs to have a current SFR of 0.7 M☉ yr-1 (Kennicutt et al., 2011). This normalization results in total stellar masses (integrating over SFH and accounting for stellar mass loss) of 9.6, 10.1, 10.0 and 9.5 in log(M☉) for the constant, exponential, linear and 2 Gyr-peaked SFHs. The measured log(M☉) for NGC 628 is only 9.6 (Skibba et al., 2011). Thus, the constant and 2 Gyr-peaked SFHs are accurately tuned to NGC 628, while the linear and exponential models have about three times too much stellar mass. Still, they may represent broadly the shape of NGC 628’s SFH (perhaps a period of elevated SFR at the present) so we keep them for the analysis.
A.2. Dust absorption: non-ionizing radiation
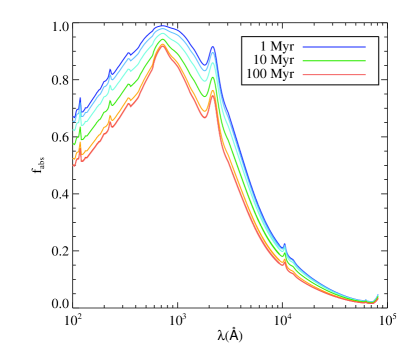
In order to estimate the amount of PAH emission due to old stellar populations, we create a simple model based on separating the absorption of stellar energy due to PAHs from that of the total population of dust grains. We first assume that the old stellar populations are mixed with the dust while the youngest stellar populations follow the starburst attenuation law, which is broadly equivalent to a foreground (clumpy) screen. We change from the foreground screen (with optical depth ) to the mixed dust geometry (with optical depth ) assuming a timescale for young clusters to emerge from their natal clouds of 10 Myr. The following equation describes the fraction of absorbed light as a function of the screen and mixed optical depths and the age of the stellar population (t, in Myr):
| (A1) |
The variation of optical depth with wavelength is computed by the ratio of the absorption cross-section of all dust (including PAHs), , normalized to that at V-band as follows:
| (A2) |
We note that this approach to the attenuation of an integrated stellar population is similar to that of da Cunha et al. (2008), with an important difference being that we use a dust-model based cross-section instead of a simple power-law effective absorption curve.
With Equations A1 and A2 determining as a function of stellar population age and wavelength for given and , we may then calculate the TIR luminosity for stellar populations with ages between and as:
| (A3) |
For the PAH luminosity, we apply the ratio between the PAH-only cross-section to the total dust cross-section:
| (A4) |
A.3. Dust absorption: ionizing radiation
For ionizing photons, hydrogen atoms present a major source of opacity in addition to dust. We assume that H ii regions are radiation bounded and that a fraction of ionizing photons, , ionize hydrogen. The remainder are absorbed by dust within the H ii region, which is assumed to be devoid of PAHs (e.g. Giard et al., 1994; Churchwell et al., 2006). About 70% of ionizations produce a Ly photon upon recombination (valid for electron densities, cm-3, Draine, 2011), which is then repeatedly scattered. After several scatterings, most of these Ly photons will be absorbed by dust, while a small fraction, , escape. Let be the rate of ionizing photons in s-1 and be the ionization energy of hydrogen ( erg). If the average energy of an ionizing photon is approximately 1.2, then the TIR luminosity from within the H ii region from ionizing photons is:
| (A5) |
Note the factor gives the energy of the Ly transition by the Rydberg formula.
H ii regions are surrounded by dusty PDRs. The line emission from any escaping Ly as well as from optical hydrogen lines and metallic cooling lines should also be included here, as this is essentially reprocessed ionizing radiation. We assume that the PDR has a covering fraction () of 0.7. For the optical recombination emission, we know that the 30% of recombinations that do not produce a Ly photon will produce a two-photon decay from the 2s state. Before decaying to the 2s state, the electron must have already lost 0.25 through recombination lines. For the metallic cooling lines, we assume they produce 0.1 per hydrogen ionization. Combining all of these terms, we have:
| (A6) |
PAHs do exist within the PDR, so we also have:
| (A7) |
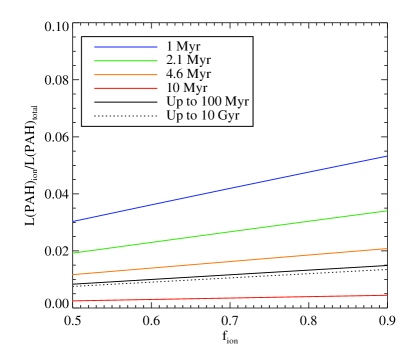
Because the dust within the H ii regions is assumed to be PAH-free, the ionizing radiation does not have a large contribution to the PAH emission. As shown in the left panel of Fig. 10 (dotted black line), the escaping recombination and cooling radiation contributes less than 2% to the total PAH emission (assuming a constant SFR 10 Gyr-old population), even with a high of 0.9. The TIR emission from intercepted ionizing photon light (either directly or through lines) is approximately 10% as seen in the right panel of Fig. 10. We note that this fraction agrees with the 5-10% found for FIR emission from H ii regions within the Milky Way (Sodroski et al., 1997).
A.4. Model results
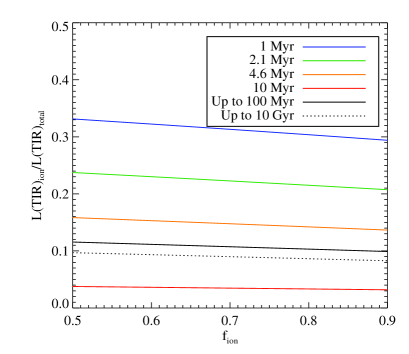
Assuming a value of and combining the non-ionizing and ionizing contributions we obtain both the TIR and PAH luminosity for young stars we have:
| (A8) |
and
| (A9) |
The old population luminosities may be calculated using Equations A3 and A4 with the wavelength range 912-10000Å and the stellar population age range 100 Myr-10 Gyr.
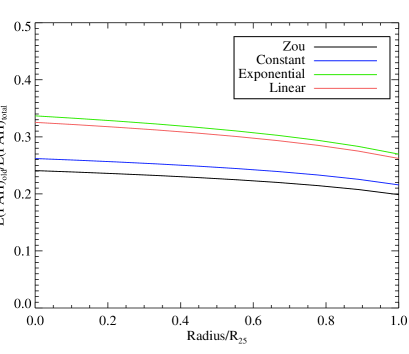
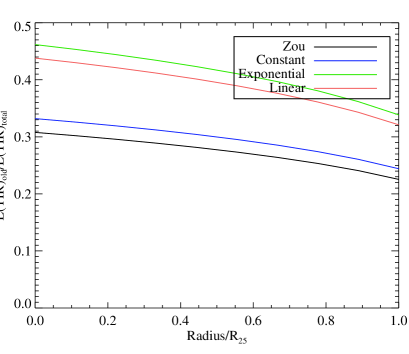
The choices for and used in Eqn. A1 should be set to match NGC 628. From Section 3.2, we have (H) for the H ii regions. Assuming the continuum is less attenuated than the H emission by the factor 0.44 (Calzetti et al., 1994) and transforming to V-band and to optical depth instead of magnitudes, we have . For the older populations, we again adopt the prescription for the disk regions from Section 3.2 (linearly declining with radius), but this time use the full attenuation through the disk (and neglecting Milky Way foreground extinction). As the stellar photons exciting PAHs are traveling in all directions, the effective dust optical depth for absorption of these photons is likely to be comparable to the full-thickness optical depth, hence adopting that value. Using the dust surface densities from Aniano et al. (2012) and converting to optical depth, we parametrize . (The different geometry assumed for young and old regions means that the higher values give similar or lower absorbed fractions of stellar radiation than the lower .) These parameterizations of and with radius result in Fig. 11, which shows the radial behavior of the fractions of PAH and TIR luminosity contributed by old stars (top left and right, respectively), the ratio of TIR to stellar luminosity (bottom left) and the ratio of PAH to TIR luminosity (bottom right). Fig. 11 also exhibits the effect of different star formation histories, with four different SFHs shown as different colored lines.
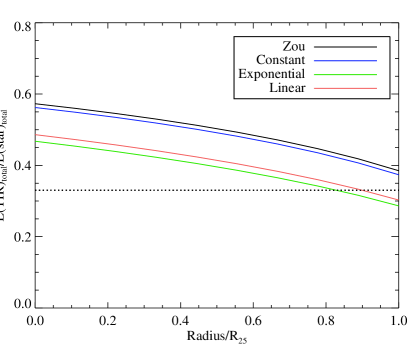
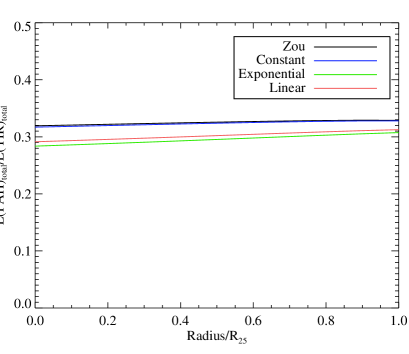
Observationally, the TIR to stellar ratio is determined to be 0.33 in Skibba et al. (2011) for NGC 628. We plot this value as a horizontal dotted line in the lower left panel of Fig. 11. The linear and exponential SFHs are close to this value at all radii, while the constant and Zou SFHs both predict too much infrared per unit stellar luminosity. All SFHs and choices have a L(PAH) to L(TIR) ratio of approximately 0.3. This is larger than the typical observed value, but the way that PAH emission is usually measured does not include the continuum emission under the PAH features nor any continuum emission emitted at longer (m) wavelengths. Furthermore, we did not use a dust cross-section perfectly tuned to NGC 628, the observationally-determined fractional PAH content () is actually about 80% lower than in the dust model we used, thus the PAH to TIR ratio should also decrease by this amount.
As for the PAH luminosity from old stars, the linear and exponential SFHs are quite close to the global value we derive, although they do not follow the specific shape from our Fig. 3. We take this as an indication that it is indeed possible for approximately 30% of the PAH luminosity to be powered by old stars. The upper right hand panel of Fig. 11 shows the corresponding plot for the TIR. While the cross-section of the bigger grains is weighted more towards longer wavelengths, the contribution from within the H ii regions partly makes up for this lower sensitivity to young stars and the fraction of TIR emission from old stars is only about 10% more than for PAHs.