THE MOST METAL-POOR STARS. IV. THE TWO POPULATIONS WITH [FE/H] –3.0
Abstract
We discuss the carbon-normal and carbon-rich populations of Galactic halo stars having [Fe/H] –3.0, utilizing chemical abundances from high-resolution, high- model-atmosphere analyses. The C-rich population represents % of stars below [Fe/H] = –3.1, with the present C-rich sample comprising 16 CEMP-no stars, and two others with [Fe/H] –5.5 and uncertain classification. The population is O-rich ([O/Fe] +1.5); the light elements Na, Mg, and Al are enhanced relative to Fe in half the sample; and for Z 20 (Ca) there is little evidence for enhancements relative to solar values. These results are best explained in terms of the admixing and processing of material from H-burning and He-burning regions as achieved by nucleosynthesis in zero-heavy-element models in the literature of “mixing and fallback” supernovae (SNe); of rotating, massive and intermediate mass stars; and of Type II SNe with relativistic jets. The available (limited) radial velocities offer little support for the C-rich stars with [Fe/H] –3.1 being binary. More data are required before one could conclude that binarity is key to an understanding of this population. We suggest that the C-rich and C-normal populations result from two different gas cooling channels in the very early Universe, of material that formed the progenitors of the two populations. The first was cooling by fine-structure line transitions of C II and O I (to form the C-rich population); the second, while not well-defined (perhaps dust-induced cooling?), led to the C-normal group. In this scenario, the C-rich population contains the oldest stars currently observed.
Subject headings:
Cosmology: Early Universe – Galaxy: Formation – Galaxy: Halo – Nuclear Reactions, Nucleosynthesis, Abundances – Stars: Abundances1. INTRODUCTION
Studies of the chemical abundance patterns of the most metal-poor stars offer insight into the properties and role of the first generations of stars. The progenitors of these objects, some likely to have had zero metallicity, are the first stars to have formed in the Universe, and may well be responsible for its reionization (e.g., Bromm et al. 2009). The most chemically primitive stars in the Milky Way hold vital clues concerning the earliest phases of the formation and evolution of the Galaxy.
Extensive observation of metal-poor candidates in the HK survey (Beers et al., 1985, 1992), the Hamburg/ESO Survey (HES; Wisotzki et al. 1996; Christlieb et al. 2008), the Sloan Digital Sky Survey (SDSS; York et al. 2000) and the SEGUE survey (Yanny et al., 2009) has greatly increased the sample of extremely metal-poor stars ([Fe/H] 3.0)111For element X, [X/H] = log(N(X)/N(H))⋆ – log(N(X)/N(H)⊙.. Subsequent chemical abundance analyses of the brightest of these have revealed that, in addition to a population of apparently “normal” metal-poor stars (those having well-defined trends for most elements), there exist chemically peculiar stars (those with strong enhancements or deficiencies of particular elements) (see e.g., McWilliam et al. 1995; Ryan et al. 1996; Norris et al. 2001; Johnson 2002; Cayrel et al. 2004; Cohen et al. 2008; Lai et al. 2008; Yong et al. 2012). With the discovery and analysis of non-“normal” stars at lowest [Fe/H], different classes of objects are being defined which are permitting exploration of the nature and frequency of the progenitor stars that were responsible for this rich diversity, accompanied by insight into chemical enrichment of the Universe at the earliest times.
The best known type of chemically anomalous object at very low metallicity is the carbon-enhanced metal-poor (CEMP) class (Beers & Christlieb 2005), which comprises a large fraction () of metal-poor stars below [Fe/H] = –2.0. As defined by Beers & Christlieb (2005) (and as discussed below in Section 2), the CEMP class itself has several distinct subclasses. This diversity of chemical properties is not, however, confined to carbon-rich stars. Rarer examples of individual chemically unusual low-[Fe/H], non-CEMP, stars include (1) the Mg-enhanced metal-poor star BS 16934-002, with [Fe/H] = –2.7, [Si/Fe] = +0.44, and [Ca/Fe] = +0.35, but [Mg/Fe] = +1.23 (Aoki et al., 2007b); (2) the -element challenged HE 1424–0241, with [Fe/H] = –4.0 and [Mg/Fe] = +0.44, but [Si/Fe] = 1.01 and [Ca/Fe] = –0.44 (Cohen et al., 2007); and (3) the -element ambivalent SDSS J234723.64+010833.4, with [Fe/H] = –3.17 and [Mg/Fe] = 0.10, but [Ca/Fe] = +1.11 (Lai et al., 2009). In Paper II of the present series (Yong et al., 2012) we reported a homogeneous chemical analysis of 190 metal-poor stars, and presented chemical abundances for some 16 elements. In that sample there were 109 stars for which we were able to determine the CEMP/C-normal status, and which are C-normal (i.e., stars with [C/Fe] +0.7)222We caution the reader that this does not represent a full inventory, since it excludes C-normal stars in which C was not detected and for which the upper limit on [C/Fe] was greater than +0.7.. For elements in the range Na–Ni, we determined the incidence of anomalous abundances relative to Fe (where anomalous is taken to mean [X/Fe] different from the average “normal” star value by more than 0.5 dex). We found that 21 5 % of stars were anomalous with respect to one element, while 4 2 % were anomalous with respect to at least two.
Given the small number of stars presently known at extremely low [Fe/H], the identification of just a handful with similar chemical properties can not only define a class of stars, but also reveal that what was originally regarded as a rare and peculiar object may indeed represent a more substantial fraction of the population. For example, since the discovery and analysis of the highly r-process-element enhanced star CS 22892–052 (McWilliam et al., 1995; Sneden et al., 1996), several additional examples of this class have been identified (see Sneden et al. 2008 and references therein). Another example more pertinent to the present investigation is the case of the CEMP stars CS 22949-037 (McWilliam et al., 1995; Norris et al., 2001; Depagne et al., 2002) and CS 29498-043 (Aoki et al., 2002a), both with no enhancement of the heavy neutron-capture elements, but which Aoki et al. (2002a) identified as a subclass of the CEMP stars which also has enhanced Mg and Si.
This is the fourth paper in the our series on the discovery and analysis of the most metal-poor stars. Here we focus on the detailed chemical abundance patterns of the C-rich stars having [Fe/H] –3.0 (many with large enhancements of some or all of Na, Mg, Al, and Si), and what they have to tell us about the origin of the remarkable increase of carbon richness, not only in frequency but also in degree, as [Fe/H] decreases. In Section 2 we present a sample of C-rich stars with [Fe/H] –3.0 (excluding those having large heavy-neutron-capture-element enhancements), based principally on our homogeneous chemical analysis of Paper II. Sections 3 – 5 discuss the chemical abundances and kinematics of this sample in comparison with C-normal stars in the same metallicity range. In Section 6 we then consider the relevance of various models that have been proposed to explain the origin of anomalous abundances in the early Universe. We shall argue for the existence of two principal channels of cooling and chemical enrichment to explain the C-rich and C-normal populations observed at lowest Fe abundance, [Fe/H] –3.0.
2. A SAMPLE OF C-RICH (CEMP-NO AND TWO HYPER METAL-POOR) STARS WITH [FE/H] –3.0
Aoki (2010) demonstrated that, for [Fe/H] –3.0, the large majority () of CEMP stars belong to the CEMP-no subclass, and it is these objects that will concern us here. Beers & Christlieb (2005) define a CEMP-no star as one having [C/Fe] +1.0 and [Ba/Fe] 0.0. The other CEMP subclasses, defined by these authors, all of which have [C/Fe] +1.0, are: (i) CEMP-r – [Eu/Fe] +1.0; (ii) CEMP-s – [Ba/Fe] +1.0 and [Ba/Eu] + 0.5; and (iii) CEMP r/s – 0.0 [Ba/Eu] +0.5. More recently, Aoki et al. (2007a) have suggested a slightly modified [C/Fe] criterion, based on extensive high-resolution, high- abundance analysis, also taking into account putative stellar evolution effects at highest luminosity. Based on their Figure 4, their definition is (i) [C/Fe] +0.7, for and (ii) [C/Fe] +3.0 , for . In what follows, we shall somewhat more conservatively adopt [C/Fe] +0.70 for all values of ), since it is not clear to us that criterion (ii) is sufficiently justified, based on the data in our sample333Our concern is based, for example, on luminous stars such as BD in Table 6 of Paper II, which has = 4560 K, = 0.8, [Fe/H] = –3.2, [C/Fe] = –0.02, and quite normal relative abundances of all elements. It has ) = 3.1, and from criterion (ii) a limiting value for C-rich status of [C/Fe] = –0.1, above which stars are accepted as CEMP. We are reluctant to accept objects such as this as CEMP stars..
In order to compare the intrinsic abundance patterns of C-rich and C-normal stars at lowest [Fe/H] values, we begin by selecting C-rich stars with [Fe/H] –2.5, excluding stars of the CEMP-r, CEMP-r/s and CEMP-s subclasses. In subsequent discussion we shall then restrict our consideration essentially to the subset of CEMP-no stars having [Fe/H] –3.0. Insofar as the abundance characteristics of the CEMP-s, and presumably the CEMP-r/s stars, are driven in large part by binarity and mass transfer from an asymptotic giant branch (AGB) star onto the star now being observed (see, e.g., Lucatello et al. 2005), the case for removal of these stars is clear. That is, abundance patterns driven by extrinsic factors severely compromise interpretation of the chemical abundances with which these objects formed. The exclusion of the CEMP-r group is also well-justified, given its large r-process-element enhancements. That said, given the intrinsic differences among the CEMP subclasses, our selection processes described below yield no CEMP-r, CEMP-r/s, or CEMP-s stars with [Fe/H] –3.1444We do not claim that such stars do not exist. Rather, our position is that they are rare and absent from our sample of C-rich stars with [Fe/H] –3.1, and not important in the present context..
Our sample of C-rich stars contains essentially only members of the CEMP-no subclass, and was selected from three sources, as follows. We began with Paper II, in which we have presented chemical abundances, determined using 1D, local thermodynamic equilibrium (LTE) model-atmosphere techniques, for a sample of 38 metal-poor stars having [Fe/H] –3.0, of which 34 were newly discovered. Among these objects, some nine are CEMP-no stars555The identification of 53327-2044-515, which has [Ba/Fe] +0.34, as CEMP-no is not robust. Even if it has [Ba/Fe] = +0.34, however, we would regard it as being closely related to the class.. Second, in Paper II, we also determined abundances for a further 152 metal-poor stars in the literature for which equivalent widths were published and the atmospheric parameters and could be reliably determined from publicly available data. For these, we re-determined abundances using the same techniques as for our sample of 38 stars. This literature collection contains 12 C-rich stars of interest for the present investigation. Ten of them are CEMP-no stars, while the other two have [Fe/H] –5.5, [C/Fe] +4, but only [Ba/Fe] limits, which precludes determination of their CEMP status. The combined sample of 190 stars in Paper II comprises chemical abundances based on high-resolution ( ), high material, homogeneously analyzed. Third, we adopted abundances from the literature for an additional two CEMP-no stars, BD (Ito et al., 2009) and Segue 1-7 (Norris et al., 2010), that were not considered in Paper II.
Table 1 presents our resulting catalog of the collective sample of 23 C-rich stars (excluding the CEMP-r, CEMP-r/s and CEMP-s subclasses) having [Fe/H] –2.5. Columns (1) – (6) present star name and coordinates, together with the atmospheric parameters , , and [Fe/H], respectively, Columns (7) – (9) contain [C/Fe], [Sr/Fe], and [Ba/Fe], which inform the identification of most of these objects as CEMP-no stars. As noted above, two stars in Table 1 cannot be classified as CEMP-no for the technical reason that only limits are available for their barium abundances. These are HE 0107–5240 and HE 1327–2326, the two most Fe-poor stars currently known, for which [Ba/Fe] +0.82 and +1.46, respectively. This uncertainty notwithstanding, both have [C/Fe] +4, and are among the most C-rich Fe-poor stars known. Further, as we shall see below, HE 1327–2326 has large enhancements of Na, Mg, and Al, which is characteristic of half of the C-rich stars with [Fe/H] –3.1. The final column contains source material relevant to discovery and identification of CEMP-no stars. We note that inspection of the table reveals that some seven, or 30%, of the stars have 5500 K, and may be regarded as near turnoff or subgiant objects, while the remainder are red giants.
| Star | RA2000 | Dec2000 | [Fe/H] | [C/Fe] | [Sr/Fe] | [Ba/Fe] | SourceccReferences: 1 = Yong et al. (2012); 2 = Christlieb et al. (2004), 3 = Bessell et al. (2004), 4 = Ito et al. (2009), 5 = Norris et al. (2007), 6 = Norris et al. (2012a), 7 = Norris et al. (2010), 8 = Cohen et al. (2008), 9 = Cohen et al. (2006), 10 = Frebel et al. (2007b), 11 = Honda et al. (2004b), 12 = Lai et al. (2008), 13 = Aoki et al. (2006), 14 = Aoki et al. (2002a), 15 = Aoki et al. (2004), 16 = Cayrel et al. (2004), 17 = Spite et al. (2005), 18 = François et al. (2007), 19 = Norris et al. (1997) | ||
|---|---|---|---|---|---|---|---|---|---|
| (1) | (2) | (3) | (4) | (5) | (6) | (7) | (8) | (9) | (10) |
| HE 00575959 | 00 59 54.0 | 59 43 29.9 | 5257 | 2.65 | 4.08 | 0.86 | 1.06 | 0.46 | 1 |
| HE 01075240bbThe hyper metal-poor HE 0107–5240 and HE 1327–2326, with [Fe/H] , may not be classified as CEMP-no stars, since only weak upper limits can be placed on their [Ba/Fe] values. | 01 09 29.2 | 52 24 34.2 | 5100 | 2.20 | 5.54 | 3.85 | 0.52 | 0.82 | 1, 2, 3 |
| 53327-2044-515ddDwarf and subgiant abundances from Yong et al. (2012) | 01 40 36.2 | +23 44 58.1 | 5703 | 4.68 | 4.00 | 1.13 | 1.09 | 0.34 | 1 |
| 53327-2044-515ddDwarf and subgiant abundances from Yong et al. (2012) | 5703 | 3.36 | 4.09 | 1.57 | 0.53 | 0.04 | 1 | ||
| HE 01461548 | 01 48 34.7 | 15 33 24.4 | 4636 | 0.99 | 3.46 | 0.84 | 0.38 | 0.71 | 1 |
| BD | 02 26 49.7 | +44 57 46.0 | 5510 | 3.70 | 3.68 | 1.31 | 0.26 | 0.59 | 4 |
| HE 05574840 | 05 58 39.3 | 48 39 56.8 | 4900 | 2.20 | 4.81 | 1.70 | 1.07 | 0.03 | 1, 5, 6 |
| Segue 1-7 | 10 08 14.4 | +16 05 01.0 | 4960 | 1.90 | 3.52 | 2.30 | 1.39 | 0.96 | 7 |
| HE 10121540 | 10 14 53.5 | 15 55 53.2 | 5745 | 3.45 | 3.47 | 2.22 | 0.37 | 0.25 | 1, 8 |
| HE 11500428 | 11 53 06.6 | 04 45 03.4 | 5208 | 2.54 | 3.47 | 2.37 | 0.12 | 0.48 | 1, 9 |
| HE 12011512ddDwarf and subgiant abundances from Yong et al. (2012) | 12 03 37.0 | 15 29 33.0 | 5725 | 4.67 | 3.86 | 1.14 | 0.87 | 0.05 | 1 |
| HE 12011512ddDwarf and subgiant abundances from Yong et al. (2012) | 5725 | 3.39 | 3.92 | 1.60 | 1.27 | 0.34 | 1 | ||
| HE 1300+0157 | 13 02 56.2 | +01 41 52.1 | 5529 | 3.25 | 3.75 | 1.31 | 1.36 | 0.85 | 1, 8, 10 |
| BS 16929-005 | 13 03 29.5 | +33 51 09.1 | 5229 | 2.61 | 3.34 | 0.99 | 0.54 | 0.41 | 1, 11, 12 |
| HE 13272326bbThe hyper metal-poor HE 0107–5240 and HE 1327–2326, with [Fe/H] , may not be classified as CEMP-no stars, since only weak upper limits can be placed on their [Ba/Fe] values. | 13 30 06.0 | 23 41 49.7 | 6180 | 3.70 | 5.76 | 4.26 | 1.04 | 1.46 | 1, 13 |
| HE 15060113 | 15 09 14.3 | 01 24 56.6 | 5016 | 2.01 | 3.54 | 1.47 | 0.85 | 0.80 | 1 |
| CS 22878-027 | 16 37 35.9 | +10 22 07.8 | 6319 | 4.41 | 2.51 | 0.86 | 0.26 | 0.75 | 1, 12 |
| CS 29498043 | 21 03 52.1 | 29 42 50.2 | 4639 | 1.00 | 3.49 | 1.90 | 0.35 | 0.45 | 1, 14, 15 |
| HE 21395432 | 21 42 42.4 | 54 18 42.9 | 5416 | 3.04 | 4.02 | 2.59 | 0.55 | 0.33 | 1 |
| HE 21425656 | 21 46 20.4 | 56 42 19.1 | 4939 | 1.85 | 2.87 | 0.95 | 0.19 | 0.63 | 1 |
| HE 22024831 | 22 06 05.8 | 48 16 53.0 | 5331 | 2.95 | 2.78 | 2.41 | 0.85 | 1.28 | 1 |
| CS 29502-092 | 22 22 36.0 | 01 38 27.5 | 5074 | 2.21 | 2.99 | 0.96 | 0.15 | 1.20 | 1, 12 |
| HE 22477400 | 22 51 19.4 | 73 44 23.6 | 4829 | 1.56 | 2.87 | 0.70 | 0.15 | 0.94 | 1 |
| CS 22949-037eeHE 23230256 | 23 26 29.8 | 02 39 57.9 | 4958 | 1.84 | 3.97 | 1.06 | 0.55 | 0.52 | 1, 16, 17, 18 |
| CS 22957-027ffHE 23560410 | 23 59 13.1 | 03 53 48.2 | 5170 | 2.45 | 3.19 | 2.27 | 0.86 | 0.80 | 1, 9, 19 |
The above source material also leads to identification of members of the other CEMP subclasses. For completeness and the interest of others, we present in Table 2 the corresponding catalog of 26 additional CEMP stars included in the selections of Paper II that have [Ba/Fe] 0.0, where the columns have the same content as in Table 1. We regard these as non-CEMP-no stars and, by process of elimination, members of the Beers & Christlieb (2005) CEMP subclasses r, r/s, and s. The reader will note that all stars in this sample have [Fe/H] –3.1. In considerable contrast, the techniques of Paper II were strongly biased towards the recognition and analysis of stars having Fe/H] –3.0. We emphasize that Table 2 is thus potentially seriously incomplete for abundances larger than this limit.
| Star | RA2000 | Dec2000 | [Fe/H] | [C/Fe] | [Sr/Fe] | [Ba/Fe] | SourcebbReferences: 1= Yong et al. (2012), 2 = Aoki et al. (2002b), 3 = Aoki et al. (2008), 4 = Aoki et al. (2007a), 5 = Cohen et al. (2004), 6 = Cohen et al. (2006), 7 = Cayrel et al. (2004), 8 = Spite et al. (2005), 9 = François et al. (2007) | ||
|---|---|---|---|---|---|---|---|---|---|
| (1) | (2) | (3) | (4) | (5) | (6) | (7) | (8) | (9) | (10) |
| CS 31062-050 | 00 30 31.1 | 12 05 10.9 | 5607 | 3.49 | 2.28 | 2.00 | 0.91 | 2.30 | 1, 2 |
| SDSS 0036-10 | 00 36 02.2 | 10 43 36.3 | 6479 | 4.31 | 2.60 | 2.32 | 0.07 | 0.40 | 1, 3 |
| CS 29497-034 | 00 41 39.8 | 26 18 54.4 | 4983 | 1.96 | 3.00 | 2.72 | … | 2.28 | 1, 4 |
| CS 31062-012 | 00 44 03.6 | 13 55 25.9 | 6190 | 4.47 | 2.67 | 2.12 | 0.33 | 2.32 | 1, 2, 3 |
| HE 01430441 | 01 45 37.9 | 04 26 43.4 | 6276 | 3.84 | 2.32 | 1.82 | 1.09 | 2.42 | 1, 5, 6 |
| HE 02061916 | 02 09 19.6 | 19 01 55.5 | 5073 | 2.23 | 2.52 | 2.10 | … | 1.99 | 1, 4 |
| HE 02071423 | 02 10 00.7 | 14 09 11.1 | 5023 | 2.07 | 2.95 | 2.38 | 0.33 | 1.73 | 1 |
| HE 0336+0113 | 03 38 52.9 | +01 23 07.8 | 5819 | 3.59 | 2.60 | 2.25 | 1.87 | 2.69 | 1, 6 |
| HE 04410652 | 04 43 29.9 | 06 46 53.5 | 4811 | 1.52 | 2.77 | 1.38 | … | 1.20 | 1, 4 |
| 52972-1213-507 | 09 18 49.9 | +37 44 26.8 | 6463 | 4.34 | 2.98 | 2.82 | 1.15 | 1.70 | 1 |
| SDSS 0924+40 | 09 24 01.9 | +40 59 28.8 | 6196 | 3.77 | 2.68 | 2.72 | 0.77 | 1.73 | 1, 3 |
| HE 10051439 | 10 07 52.4 | 14 54 21.0 | 5202 | 2.55 | 3.09 | 2.48 | … | 1.17 | 1, 4 |
| HE 10310020 | 10 34 24.2 | 00 36 08.4 | 5043 | 2.13 | 2.79 | 1.63 | 0.52 | 1.61 | 1, 6 |
| HE 13191935 | 13 22 38.7 | 19 51 11.6 | 4691 | 1.27 | 2.22 | 1.45 | … | 1.68 | 1, 4 |
| HE 14290551 | 14 32 31.3 | 06 05 00.3 | 4757 | 1.39 | 2.60 | 2.28 | … | 1.47 | 1, 4 |
| CS 30301-015 | 15 08 56.8 | +02 30 18.5 | 4889 | 1.73 | 2.73 | 1.60 | 0.30 | 1.45 | 1, 2 |
| HD 196944 | 20 40 46.1 | 06 47 50.6 | 5255 | 2.74 | 2.44 | 1.20 | 0.84 | 1.10 | 1, 2 |
| CS 22880-074 | 20 46 03.2 | 20 59 14.2 | 5621 | 3.50 | 2.29 | 1.30 | 0.39 | 1.31 | 1, 2 |
| SDSS 2047+00 | 20 47 28.8 | +00 15 53.8 | 6383 | 4.36 | 2.36 | 2.00 | 1.03 | 1.70 | 1, 3 |
| CS 22948027 | 21 37 45.8 | 39 27 22.3 | 5011 | 2.06 | 2.45 | 2.12 | … | 2.45 | 1, 4 |
| HE 21580348 | 22 00 40.0 | 03 34 12.2 | 5150 | 2.44 | 2.57 | 1.87 | 0.64 | 1.75 | 1, 6 |
| CS 22892-052 | 22 17 01.7 | 16 39 27.1 | 4825 | 1.54 | 3.03 | 0.90 | 0.68 | 1.01 | 1, 7, 8, 9 |
| HE 22210453 | 22 24 25.6 | 04 38 02.2 | 4430 | 0.73 | 2.00 | 1.83 | … | 1.76 | 1, 4 |
| HE 22280706 | 22 31 24.5 | 06 50 51.2 | 5003 | 2.02 | 2.78 | 2.32 | … | 2.46 | 1, 4 |
| CS 30338-089 | 23 15 50.0 | +10 19 26.2 | 4886 | 1.72 | 2.78 | 2.06 | … | 2.30 | 1, 4 |
| HE 23300555 | 23 32 54.8 | 05 38 50.6 | 4867 | 1.65 | 2.98 | 2.09 | … | 1.17 | 1, 4 |
Finally, in Table 3, we supplement the material presented above with data for CEMP stars from the work of Barklem et al. (2005)666http://www.astro.uu.se/barklem/, which we did not analyze in Paper II. This table contains information for an additional six CEMP-no stars and 14 from the CEMP-r, -r/s, and -s subclasses.
| Object | [Fe/H] | [C/Fe] | [Ba/Fe] | Classaar,s = Beers & Christlieb (2005) subclasses r, r/s and s |
|---|---|---|---|---|
| (1) | (2) | (3) | (4) | (5) |
| HE 01313953 | 2.68 | 2.45 | 2.20 | r,s |
| HE 02022204 | 1.98 | 1.16 | 1.41 | r,s |
| HE 02314016 | 2.08 | 1.36 | 1.47 | r,s |
| HE 03383945 | 2.41 | 2.07 | 2.41 | r,s |
| HE 04304404 | 2.08 | 1.44 | 1.62 | r,s |
| HE 1105+0027 | 2.42 | 2.00 | 2.45 | r,s |
| HE 11242335 | 2.93 | 0.86 | 1.06 | no |
| HE 1135+0139 | 2.31 | 1.19 | 1.13 | r,s |
| HE 12451616 | 2.97 | 0.77 | 0.28 | r,s |
| HE 13000641 | 3.14 | 1.29 | 0.77 | no |
| HE 13002201 | 2.60 | 1.01 | 0.04 | no |
| HE 13300354 | 2.29 | 1.05 | 0.47 | no |
| HE 1337+0012 | 3.44 | 0.71 | 0.07 | no |
| HE 13430640 | 1.90 | 0.77 | 0.70 | r,s |
| HE 13511049 | 3.45 | 1.55 | 0.13 | no |
| HE 14301123 | 2.70 | 1.84 | 1.82 | r,s |
| HE 21500825 | 1.98 | 1.35 | 1.70 | r,s |
| HE 21563130 | 3.13 | 0.74 | 0.52 | r,s |
| HE 22274044 | 2.32 | 1.67 | 1.38 | r,s |
| HE 22400412 | 2.20 | 1.35 | 1.37 | r,s |
The lower panel of Figure 1 presents the data from Tables 1, 2, and 3 in the ([C/Fe], [Fe/H]) – plane777We draw the reader’s attention to the fact that for two stars, 53327-2044-515 and HE 1201–1512, we present both subgiant and dwarf abundance solutions from Paper II in Table 1, while in Figure 1 (and all other figures in this paper) we plot them each only once, adopting their average values., where the values for the C-rich stars in Table 1 and the CEMP-no stars in Table 3 are plotted as red crossed circles (first sample), and the CEMP-r, -r/s, and -s stars from Tables 2 and 3 (second sample) are presented as blue dotted circles. The small filled circles represent the C-normal stars in Paper II that have carbon detections, while the large filled circle shows the upper limit for the ultra metal-poor dwarf SDSS J102915+172927 (Caffau et al., 2011, 2012). The upper panel of the figure contains the generalized histograms of the two samples and confirms the metallicity ([Fe/H]) distribution difference between the CEMP-s and CEMP-no subclasses documented by Aoki (2010). We note in particular that while CEMP-no stars are found at all metallicities below [Fe/H] –2.0 in our samples (Tables 1 and 2), there are no CEMP-r, -r/s, or -s stars with [Fe/H] –3.1.

The critic might note that, for [Fe/H] –3.0, one cannot make a strong case from Figure 1 that the C-rich and C-normal stars represent populations having distinct carbon abundances, and suggest rather a continuum of [C/Fe] values to which we have applied an arbitrary dividing line. We would agree that one cannot make the former case, and reply that the data do not necessarily support either position. We make two points. First, the suggestion of a continuous distribution of [C/Fe] in Figure 1 is in some contrast to what one sees in Figure 3 ([C/Fe] vs. [Fe/H]) and Figure 5 ([C/Fe] vs log(L/L⊙) of Aoki et al. (2007a), where clear separations are evident. This difference could result at least in part from the fact that our carbon abundances comprise a more heterogeneously determined data set than that of Aoki et al., leading to an apparent overlap of two distinct [C/Fe] distributions. Second, however, and more to the point of our approach, as one progresses from [Fe/H] = –3.0 to lower values of [Fe/H], the relative incidence of C-rich stars appears to increase. If the distribution of [C/Fe] is continuous at a given value of [Fe/H], our Figure 1 suggests that the form of that distribution changes towards one favoring larger values of [C/Fe], as [Fe/H] decreases. It is that change in the form of the [C/Fe] distribution, and its origins, that we seek to understand.
It is also of interest to estimate the C-rich fraction in the present sample. Given that many dwarfs only have [C/Fe] limits that are significantly greater than +0.7, we consider only stars with 5510 K, which we regard as giants. Then, below [Fe/H] = –3.1, there are 13 C-rich giants in Table 1, of which 11 were included in the stars analyzed of Paper II. In that sample, 40 stars were C-normal (with [C/Fe] ), all with no limiting value greater than +0.7. This leads to a C-rich fraction of 28 9%. The error estimate is based solely on the propagation of errors in the observed numbers of stars involved in computing the fraction; it does not include the effect of errors in abundance determinations or selection biases (presumably towards preferential inclusion of C-rich giants) that may be inherent in the collective sample that was analyzed, principally, in Paper II.
In what follows we shall concentrate exclusively on the C-rich stars of Table 1 that have [Fe/H] –3.0, which we shall refer to as “the C-rich stars”. In summary, this sample comprises 18 objects – 16 from the CEMP-no subclass, together with two other objects discussed above that have [Fe/H] –5.5, but only upper limits to their barium abundances.
3. THE ABUNDANCE PATTERNS OF THE C-RICH STARS WITH [FE/H]
Table 4 presents [Fe/H], relative abundances ([X/Fe]) for C (repeated for convenience), N, O, Na, Mg, Al, and Ca – Ni (excluding V), together with 12C/13C, for the stars in Table 1. Relevant source material is also included in the final column of the table. We emphasize that all of the abundances in the table are based on high-resolution, high- data. That said, we also recall that all of these values were determined using one-dimensional (1D), LTE, model-atmosphere analyses. It would obviously be preferable to have results based on 3D, non-LTE techniques. This is, however, beyond the scope of the present investigation. In what follows, we shall also present results for C-normal stars obtained using 1D, LTE analysis, which permit a differential comparison, at given [Fe/H], between the C-rich and C-normal populations with [Fe/H] 3.0.
| Star | [Fe/H] | CbbAbundances relative to iron: C = [C/Fe], N = [N/Fe], etc; Ti = [TiII/Fe] | 12C/13C | NbbAbundances relative to iron: C = [C/Fe], N = [N/Fe], etc; Ti = [TiII/Fe] | ObbAbundances relative to iron: C = [C/Fe], N = [N/Fe], etc; Ti = [TiII/Fe] | NabbAbundances relative to iron: C = [C/Fe], N = [N/Fe], etc; Ti = [TiII/Fe] | MgbbAbundances relative to iron: C = [C/Fe], N = [N/Fe], etc; Ti = [TiII/Fe] | AlbbAbundances relative to iron: C = [C/Fe], N = [N/Fe], etc; Ti = [TiII/Fe] | SibbAbundances relative to iron: C = [C/Fe], N = [N/Fe], etc; Ti = [TiII/Fe] | CabbAbundances relative to iron: C = [C/Fe], N = [N/Fe], etc; Ti = [TiII/Fe] | ScbbAbundances relative to iron: C = [C/Fe], N = [N/Fe], etc; Ti = [TiII/Fe] | TibbAbundances relative to iron: C = [C/Fe], N = [N/Fe], etc; Ti = [TiII/Fe] | CrbbAbundances relative to iron: C = [C/Fe], N = [N/Fe], etc; Ti = [TiII/Fe] | MnbbAbundances relative to iron: C = [C/Fe], N = [N/Fe], etc; Ti = [TiII/Fe] | CobbAbundances relative to iron: C = [C/Fe], N = [N/Fe], etc; Ti = [TiII/Fe] | NibbAbundances relative to iron: C = [C/Fe], N = [N/Fe], etc; Ti = [TiII/Fe] | SourceccReferences: 1 = This work (Section 3.2 and Table 1, column (10)); 2 = Frebel et al. (2006); 3 = Depagne et al. (2002) |
|---|---|---|---|---|---|---|---|---|---|---|---|---|---|---|---|---|---|
| (1) | (2) | (3) | (4) | (5) | (6) | (7) | (8) | (9) | (10) | (11) | (12) | (13) | (14) | (15) | (16) | (17) | (18) |
| HE 00575959 | 4.08 | 0.86 | 2 | 2.15 | 2.77 | 1.98 | 0.51 | … | … | 0.65 | 0.17 | 0.40 | 0.50 | … | … | 0.17 | 1 |
| HE 01075240 | 5.54 | 3.85 | 50 | 2.43 | 2.30 | 1.11 | 0.26 | … | … | 0.12 | … | 0.04 | … | … | … | … | 1 |
| 53327-2044-515ddAverages abundances of dwarf and subgiant solutions | 4.05 | 1.35 | 2 | … | 2.81 | 0.14 | 0.40 | 0.17 | … | 0.19 | 0.12 | 0.27 | … | … | … | 0.12 | 1 |
| HE 01461548 | 3.46 | 0.84 | 4 | … | 1.63 | 1.17 | 0.87 | 0.14 | 0.50 | 0.22 | … | 0.18 | 0.38 | 0.59 | 0.30 | 0.05 | 1 |
| BD | 3.68 | 1.31 | … | 0.32 | 1.59 | 0.27 | 0.52 | 0.57 | 0.41 | 0.27 | 0.43 | 0.31 | 0.44 | 1.22 | 0.48 | 0.04 | 1 |
| HE 05574840 | 4.81 | 1.70 | … | 1.00 | 2.30 | 0.18 | 0.17 | 0.65 | … | 0.17 | … | 0.36 | 0.69 | … | … | 0.17 | 1 |
| Segue 1-7 | 3.52 | 2.30 | 50 | 0.75 | 2.21 | 0.53 | 0.94 | 0.23 | 0.80 | 0.84 | … | 0.65 | 0.26 | 0.56 | 0.37 | 0.55 | 1 |
| HE 10121540 | 3.47 | 2.22 | … | 1.25 | 2.25 | 1.93 | 1.85 | 0.65 | 1.07 | 0.70 | … | 0.06 | 0.24 | 0.51 | 0.23 | 0.22 | 1 |
| HE 11500428 | 3.47 | 2.37 | 4 | 2.52 | … | … | 0.41 | … | … | 1.16 | … | 0.73 | 0.56 | … | … | … | 1 |
| HE 12011512ddAverages abundances of dwarf and subgiant solutions | 3.89 | 1.37 | 20 | 1.26 | 2.64 | 0.33 | 0.24 | 0.73 | … | 0.06 | 0.11 | 0.12 | 0.49 | 0.58 | 0.82 | 0.17 | 1 |
| HE 1300+0157 | 3.75 | 1.31 | 3 | 0.71 | 1.76 | 0.02 | 0.33 | 0.64 | 0.87 | 0.39 | 0.30 | 0.36 | 0.38 | 0.76 | 0.49 | 0.08 | 1 |
| BS 16929-005 | 3.34 | 0.99 | 7 | 0.32 | … | 0.03 | 0.30 | 0.72 | 0.38 | 0.34 | 0.01 | 0.40 | 0.35 | 0.78 | 0.28 | 0.07 | 1 |
| HE 13272326 | 5.76 | 4.26 | 5 | 4.56 | 3.70 | 2.48 | 1.55 | 1.23 | … | 0.29 | … | 0.80 | … | … | … | … | 1, 2 |
| HE 15060113 | 3.54 | 1.47 | 20 | 0.61 | 2.32 | 1.65 | 0.89 | 0.53 | 0.50 | 0.19 | … | 0.44 | 0.15 | 0.32 | 0.48 | 0.38 | 1 |
| CS 22878-027 | 2.51 | 0.86 | … | 1.06 | … | 0.17 | 0.11 | … | 0.07 | 0.07 | 0.02 | 0.30 | 0.02 | 0.34 | … | 0.09 | 1 |
| CS 29498-043 | 3.49 | 1.90 | 6 | 2.30 | 2.43 | 1.47 | 1.52 | 0.34 | 0.82 | 0.00 | … | 0.12 | 0.23 | … | … | … | 1 |
| HE 21395432 | 4.02 | 2.59 | 15 | 2.08 | 3.15 | 2.15 | 1.61 | 0.36 | 1.00 | 0.02eeComputed here following Yong et al. (2012) for an equivalent width of 61 mÅ | … | 0.31 | 0.34 | … | 0.62 | 0.17 | 1 |
| HE 21425656 | 2.87 | 0.95 | … | 0.54 | … | 0.81 | 0.33 | 0.62 | 0.35 | 0.30 | … | 0.18 | 0.19 | 0.63 | 0.18 | 0.29 | 1 |
| HE 22024831 | 2.78 | 2.41 | … | … | … | 1.44 | 0.12 | … | … | 0.17 | … | 0.46 | 0.08 | … | 0.21 | 0.07 | 1 |
| CS 29502-092 | 2.99 | 0.96 | 20 | 0.81 | 0.75 | … | 0.28 | 0.68 | … | 0.24 | 0.30 | 0.28 | 0.26 | 0.48 | 0.23 | 0.16 | 1 |
| HE 22477400 | 2.87 | 0.70 | … | … | … | 0.82 | 0.33 | … | 0.80 | 0.43 | … | 0.13 | 0.11 | … | … | 0.53 | 1 |
| CS 22949-037 | 3.97 | 1.06 | 4 | 2.16 | 1.98 | 2.10 | 1.38 | 0.02 | 0.77 | 0.39 | 0.29 | 0.45 | 0.37 | 0.87 | 0.37 | 0.10 | 1, 3 |
| CS 22957-027 | 3.19 | 2.27 | 6 | 1.75 | … | … | 0.30 | 0.10 | … | 0.45 | … | 0.52 | 0.17 | 0.10 | 0.22 | … | 1 |
3.1. CNO Abundances
The relative CNO abundances of the C-rich stars with [Fe/H] –3.0 are presented in Figure 2, as a function of [Fe/H] and [C/Fe], where the data from Table 1 are plotted as square and star symbols, for stars having [Fe/H] and –4.3 [Fe/H] , respectively. For comparison purposes, abundances for C-normal (i.e., non-CEMP) red giants from the works of Cayrel et al. (2004) and Spite et al. (2005), together with those of the ultra metal-poor main-sequence dwarf, SDSS J102915+172927, from Caffau et al. (2011, 2012) (at [Fe/H] = –4.7) are also plotted, as circles. In the left panels, relative abundances [C/Fe], [N/Fe], and [O/Fe] are presented as a function of [Fe/H], where dotted lines in the figure represent solar abundance ratios for the ordinate. Also shown in Figure 2 (and in Figures 3 – 5 that follow) are representative error bars for the C-rich stars, based principally on error estimates presented in Paper II, together with sources cited in that paper. From these three panels we note (i) below [Fe/H] –4.3, three of the four stars are carbon rich and (ii) carbon-richness is generally accompanied by both nitrogen and oxygen enrichment. This is also clear in the two panels at bottom right, which show strong correlations of both [N/Fe] and [O/Fe] with [C/Fe]. For the C-rich stars, the large carbon values reflect their selection criteria. For oxygen, on the other hand, the accompanying extreme enhancements of [O/Fe] are ubiquitous, remarkable, and not the result of any selection effect888We note for completeness that estimates of the oxygen abundance are not available for nine of the 18 stars having [Fe/H] –3.0 in Table 4. (Six of them do have [O/Fe] limits that are not inconsistent with the trend seen in the bottom right panel of Figure 2.) While, in part, this may be due to the greater difficulty of measuring the abundance of O in comparison with that of C, it could in principle be due to lower values of [O/Fe] than might be expected from the correlation seen in the figure. Further investigation is necessary to constrain this possibility..
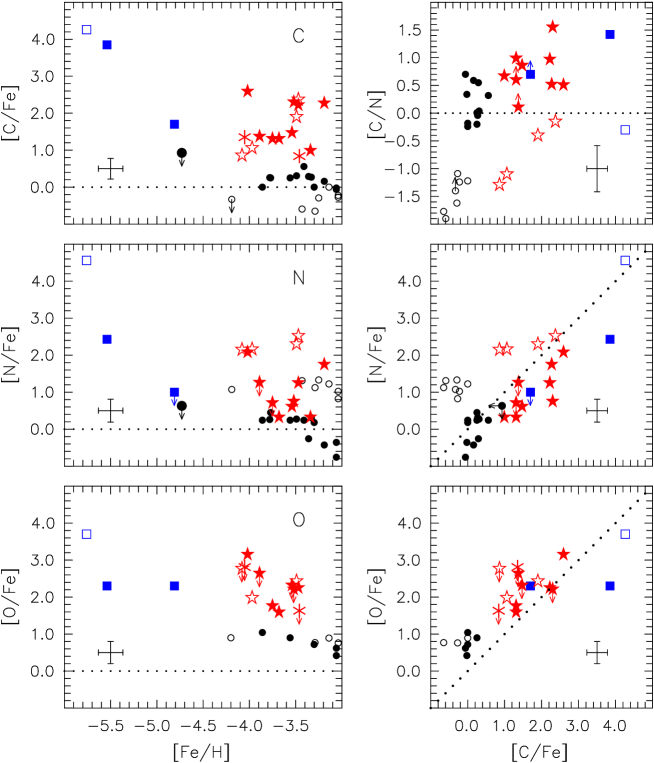
Before discussing the C-rich stars further, we comment on the C-normal red giant stars – in particular the spreads in C and N seen in Figure 2 at a given [Fe/H], and the clear separation into two groups. Spite et al. (2005), to whom we refer the reader, explain these in terms of internal mixing effects within the stars currently being observed, during their evolution on the red giant branch (RGB). The C-normal giants in Figure 2, represented by small open and filled black circles, are described by Spite et al. (2005) as “mixed” and “unmixed”, respectively. They argue that the mixed stars have reduced carbon and enhanced nitrogen abundances as the result of internal CNO processing, together with subsequent mixing of the processed material to the stellar surface during RGB evolution. A second point to note is that the range in [C/Fe] among the C-normal stars is considerably smaller that than seen among the C-rich objects.
As may be seen in the middle right panel of the Figure 2, extreme enhancements of nitrogen exist among the C-rich stars. In the range +0.8 [C/Fe] +1.3, the relative nitrogen abundance of these stars exhibits a large range, +0.3 [N/Fe] +2.1, suggestive perhaps of the existence of variable degrees of processing via the CN cycle.
3.2. [C/N] and 12C/13C
In the upper right panel of Figure 2 we plot [C/N] vs. [C/Fe], where the large range of [C/N] among the C-normal stars is clearly seen. A large separation appears to be present not only between the “mixed” and “unmixed” C-normal stars, but also among the C-rich stars, and we use open and filled blue squares, on the one hand, and open and filled red star symbols, on the other, to designate C-rich stars that lie below and above [C/N] = 0.0, respectively. Our choice of filled and open symbols was made to permit the reader to appreciate the degree of CN processing that may have been experienced by the material in the star’s outer layers. (For those stars in Table 4 having no estimate of [N/Fe], here and in what follows, we use the asterisk symbol.) Closer inspection of Table 4 and Figure 2 shows that the Spite et al. (2005) intrinsic “mixing” explanation for the CN patterns in the normal stars cannot be the full explanation for the patterns of the C-rich objects: the most iron-poor star HE 1327–2326, with [C/Fe] = +4.3 and [C/N] = –0.3, is a near-main-sequence-turnoff subgiant ( = 6180 K and = 3.7; Frebel et al., 2008), which has presumably not yet experienced the mixing of CN processed material from its interior into its outer layers (as was invoked by Spite et al. 2005 to explain the lower values of [C/N] found in red giants).
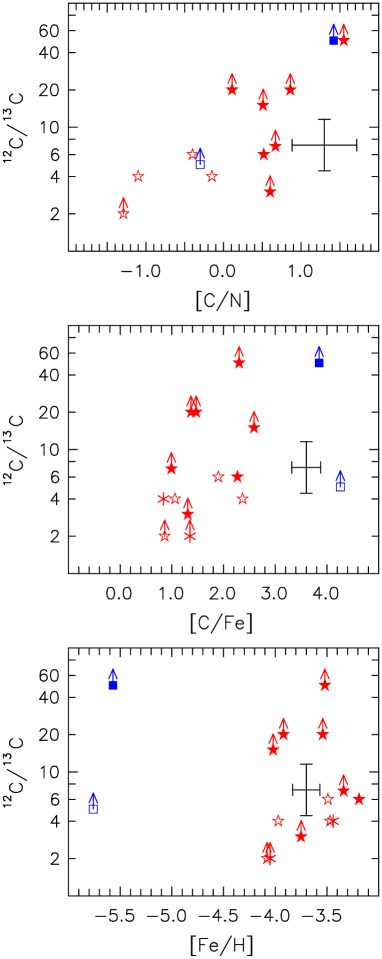
In the three panels of Figure 3 we plot 12C/13C as a function of [Fe/H], [C/Fe], and [C/N], for stars having [Fe/H] –3.0, using the data in Table 4. Bearing in mind the caveat that 10 of the 15 stars represented in the figure have only lower limits, we note that in the top panel one sees perhaps the suggestion of a positive correlation between 12C/13C and [C/N], in the sense that would be expected from the processing of hydrogen and carbon in the CN-cycle. The large values of [C/Fe] seen in Figure 3, however, suggest that, if this were the case, one would require two processes, involving not only the CN-cycle, but helium burning as well. We shall return to this point in Section 6.
3.2.1 HE 0057–5959 - an NEMP object?
In the context of the creation of CEMP stars via mass transfer from an AGB companion, Johnson et al. (2007) noted that very metal-poor intermediate-mass AGB stars are expected to produce large amounts of primary nitrogen. They defined nitrogen-enhanced metal-poor (NEMP) stars to be those with +0.5 [C/Fe] +1.0, [N/Fe] +0.5 and [C/N] 0.5, and sought to find such stars. In their sample of 21 objects, they expected to find 12% – 35% to be NEMP stars. None, however, was found, and only four stars in the recent literature could be classified as possible NEMP stars. One of their four candidate NEMP stars was CS 22949-037, a CEMP-no star in our Table 1, having [N/Fe] = +2.2 and [C/N] = –0.9. As discussed by Johnson et al. (2007), the O abundance in this object is higher than expected relative to the N abundance, assuming that the N and O come from a companion AGB star. Combined with the lack of s-process enrichment, they suggested that this star is not the result of AGB pollution.
There is a second star in Table 1, the red giant HE 0057–5959, with = 5260 K, = 2.6, and [Fe/H] =–4.1, which has [C/Fe] = +0.9, [N/Fe] = +2.2 and [C/N] = 1.3, and thus also satisfies the above NEMP criteria. Although we do not measure the O abundance in HE 0057–5959, the lack of s-process enrichment seems at odds with the AGB-pollution scenario envisaged by Johnson et al. as producing NEMP stars. That said, the nucleosynthetic yields of the s-process elements by AGB stars at the lowest metallicities remain uncertain due to limitations in the modeling999One might add that this is not too surprising given the ad hoc introduction of the “carbon pocket” into models of AGB evolution in order to produce s-process enhancements at higher metallicities (–2.0 [Fe/H] –1.0). See additional discussion of the modeling of the abundance patterns of CEMP-s stars in Bisterzo et al. (2012, and references therein).. An alternative explanation of relative nitrogen richness in CEMP-no stars such as CS 22949-037 and HE 0057–5959 may be afforded by stellar evolution involving rapid rotation and “mixing and fallback” SN explosions, which we shall discuss in Section 6. We shall also consider the question of the binarity of the C-rich stars in Section 4.
We note for completeness that HE 0057–5959 also possesses an anomalously high lithium abundance. We determine A(Li) = = 2.12. Metal-poor red giants of similar and generally have considerably lower values than this, A(Li) , as the result of Li destruction in their convective envelopes (see, e.g., Lind et al., 2009, their Figure 5). We shall return to this matter in Paper V (Norris et al. 2013, in prep.). The reader may be interested in the fact that the other potential NEMP candidate, CS 22949-037, referred to above (which is also a red giant, with = 4960 K and = 1.8) does not share this anomaly; lithium is not detected in this star (Depagne et al., 2002).
3.3. Relative Abundances [X/Fe] as a Function of [Fe/H], [C/Fe], and [Mg/Fe]
3.3.1 The enhancements of Na, Mg, Al, Si, and Ca
Aoki et al. (2002a) first highlighted the large enhancements of Mg in CEMP-no stars, reporting that CS 22949-037 and CS 29498-043 have [Mg/Fe] = +1.38 and +1.52, respectively. They also noted that [Al/Fe] and [Si/Fe] are enhanced in both objects, while data from McWilliam et al. (1995) and Aoki et al. (2004) show a similar effect for [Na/Fe]. Other C-rich stars exhibit this phenomenon: (i) the C-rich, most Fe-poor star, HE 1327–2326 shows extreme enhancements relative to Fe for these elements, with [Na/Fe] = +2.48, [Mg/Fe] = +1.55, and [Al/Fe] = +1.23 (no abundance estimate is available for Si), and (ii) Cohen et al. (2008) have commented on the Na, Mg, and Al enhancements in the C-rich stars HE 2323–0256 (CS 22949-037) and HE 1012–1540 in Table 4.
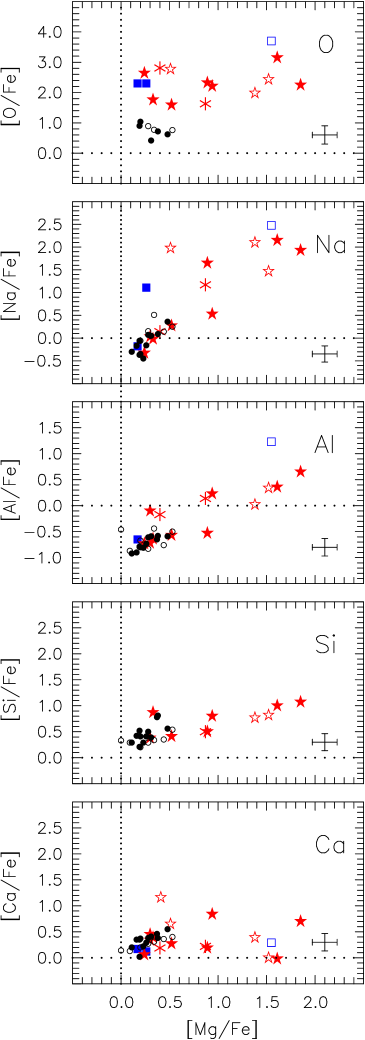
Figure 4 presents the dependence of [Na/Mg], [Mg/Fe], [Al/Fe], [Si/Fe], and [Ca/Fe], as a function of [Fe/H] and [C/Fe] (left and middle columns), based on the data in Table 4. The right column presents the generalized histograms of [X/Fe] for the C-rich stars. The outstanding and remarkable feature of the figure is that all of Na, Mg, Al, and Si are enhanced in approximately half of these stars, while Ca is enhanced in only four of the 18 (22%) for which data are available.101010These estimates are based on the somewhat subjective assessment that a star has an enhancement of element X if its LTE, 1D abundances satisfy [X/Fe] +0.8 (Na), +0.8 (Mg), –0.2 (Al), +0.8 (Si), and +0.6 (Ca). In Figure 4, one also sees that the range in the abundance spreads decreases with atomic number as one progresses from Na to Ca. We shall return to this point in the following section. There are also strong correlations between the enhancements of Na, Mg, Al, and Si, and also of O, as is shown in Figure 5, where relative abundances, [X/Fe], of O, Na, Al, Si, and Ca are presented as a function of [Mg/Fe].
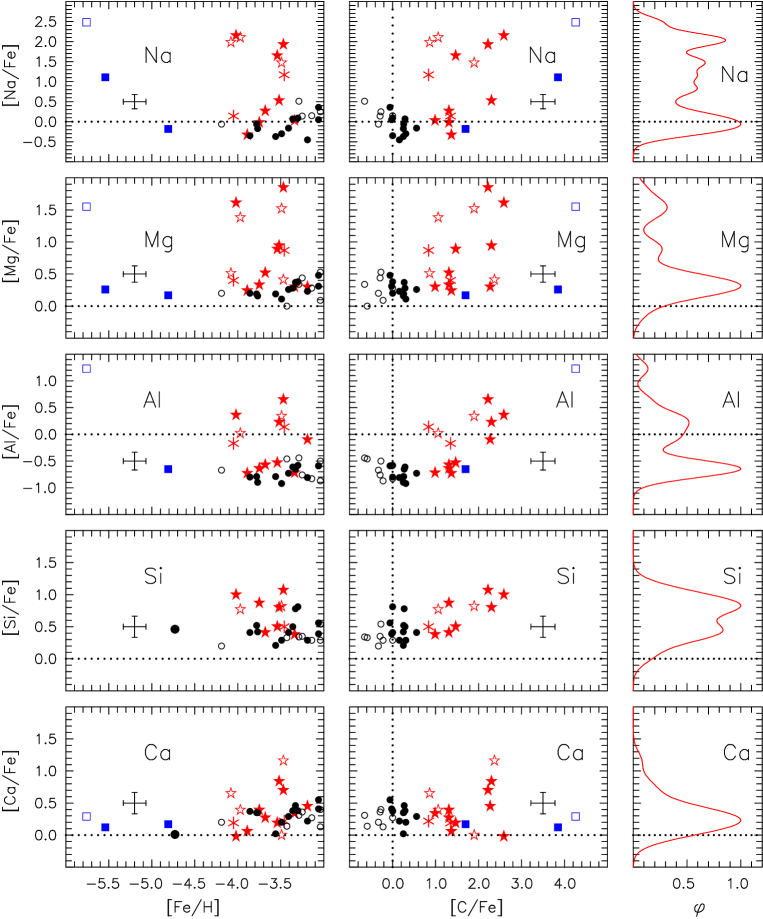
These are fundamental results to which we shall return in Section 6.
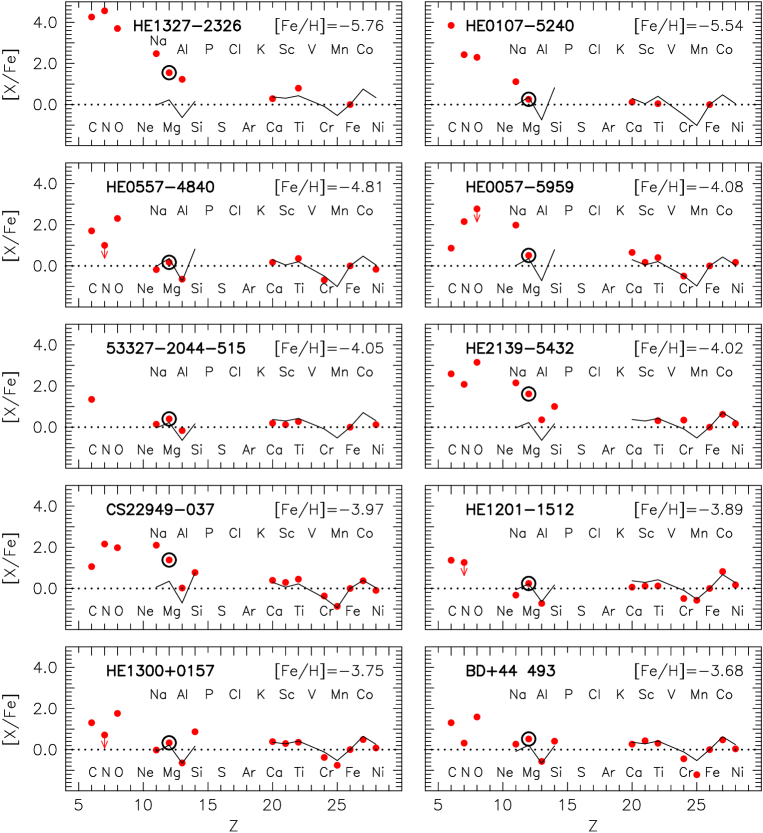
3.4. Abundances as a Function of Atomic Number
Figures 6 and 7 provide alternative representations of the data, and show the dependence of relative abundance, [X/Fe], on atomic number, Z, for 20 of the C-rich stars in Table 1. (We exclude three stars in the table that have [Fe/H] –3.0.) (In these figures the abundance errors are commensurate with the size of the symbols.) For comparison purposes, the line in each panel shows data for a C-normal star having the same //[Fe/H], following Yong et al. (2012)111111For the three stars with [Fe/H] –4.5, the reference C-normal stars have [Fe/H] = –4.2.. There are two points worth making. First, there is little evidence for non-solar relative abundances ([X/Fe]) for elements with 20 Z 28; almost all of the large variations occur for Z 20. Second, the enhancements become larger, on average, as [Fe/H] decreases: the largest variations occur below [Fe/H] = –3.4. We highlight this by circling the Mg values in the two figures, and note that while eight of the 16 stars with [Fe/H] –3.4 have [Mg/Fe] , none of the seven stars with [Fe/H] –3.4 in Table 1 (of which five are presented in Figures 6 and 7) has [Mg/Fe] +0.4. (We also note that examination of the abundances of the CEMP-no stars of Barklem et al. (2005) presented in Table 3, all of which have [Fe/H] –3.5, shows that none of them has [Mg/Fe] +0.6.) We conclude that the relative abundance [Mg/Fe] becomes larger, on average, as [Fe/H] decreases.
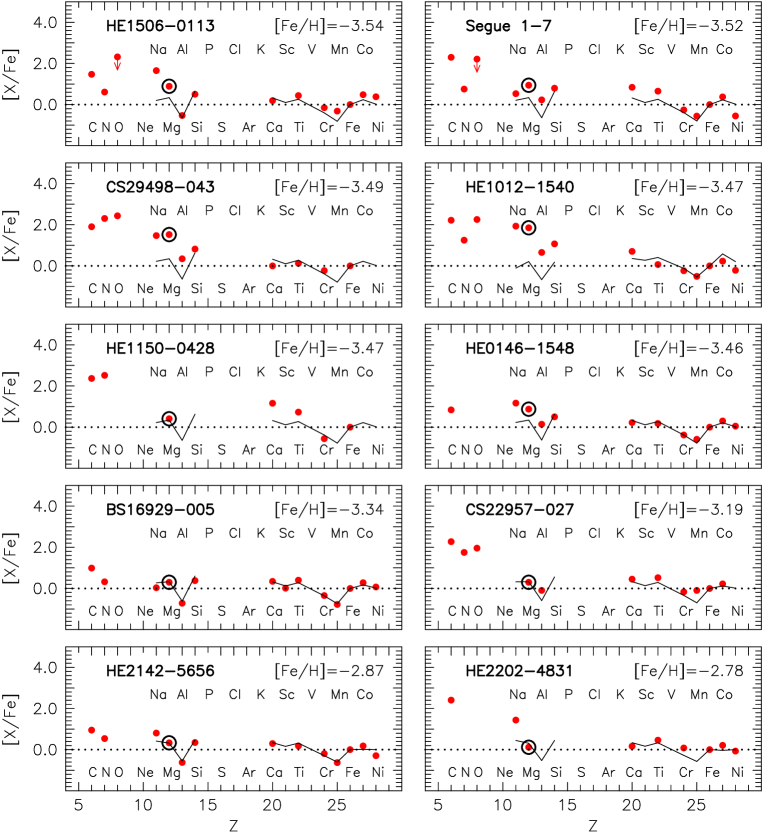
We pursue the dependence of abundance enhancement, as a function of [Fe/H], in Figure 8, and for elements Na – Ba, present generalized histograms of [X/Fe] = [X/Fe]C-rich – [X/Fe]C-normal and [Sr/Ba] = [Sr/Ba]C-rich – [Sr/Ba]C-normal, the enhancement of the ratio in C-rich stars above the values of C-normal stars having the same atmospheric parameters, //[Fe/H]. In each panel the full line represents stars having [Fe/H] 3.4, while the dotted one is for stars with [Fe/H] –3.4. Here one sees differences between the Fe-poorer and Fe-richer histograms in each panel that decrease as one progresses from Na to Ca. For Sc through Ni there is little evidence for differences. We have included results in the figure for Sr and Ba for completeness. One sees large spreads for Sr for both Fe groups, but only relatively smaller ones for Ba. Given the large spreads that exist for these two elements in C-normal stars, in particular for Sr (see, e.g., Figures 29 and 30 of Paper II), one might wonder about our attempt to define an excess of these elements in C-rich stars relative to values in C-normal objects. We shall not consider the matter further here.
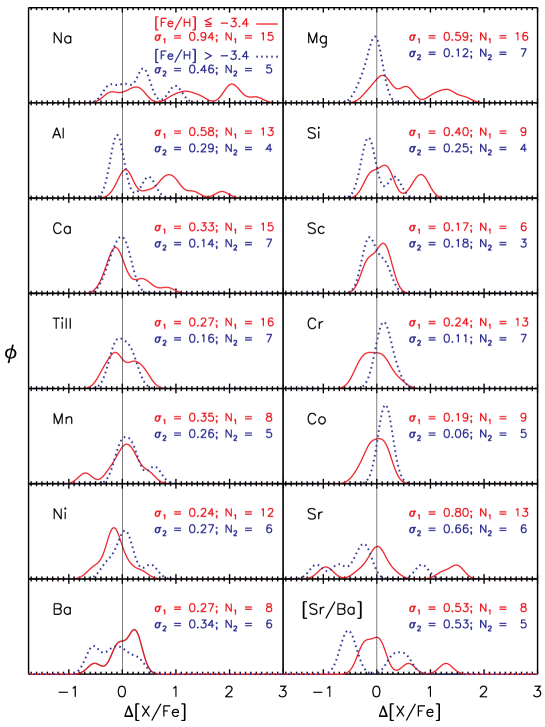
As noted in the previous section, the degree of enhancement of Na through Ca in C-rich stars appears to decrease with increasing atomic number. This is confirmed in Figure 8. Specifically, for [Fe/H] 3.4, the dispersions of [X/Fe] for Na, Mg, Al, Si and Ca in the C-rich stars are 0.94 0.17 dex, 0.59 0.10 dex, 0.58 0.11 dex, 0.40 0.09 dex, and 0.33 0.06 dex, respectively.
It should be emphasized that not all C-rich stars exhibit enhancements of Na, Mg, Al, and Si. We shall return to this in Section 6, and argue that the spreads in [X/Fe] observed for these elements may be a natural result of two of the explanations for the C-rich stars proposed in the literature.
4. THE INCIDENCE OF BINARITY AMONG THE C-RICH STARS WITH [FE/H]
Binarity has been suggested as a necessary or likely explanation for the carbon richness of some or all of the C-rich stars (21 CEMP-no stars plus two having [Fe/H] –5.5) in Table 1 (e.g., Suda et al., 2004; Masseron et al., 2010). To our knowledge, only one CEMP-no star, CS 22957-027 (Preston & Sneden, 2001), is known to exhibit radial velocity variations. Of the other stars in our Table 1, we are aware of detailed observations of only BD, which was extensively monitored for variations by Carney et al. (2003). They reported a velocity dispersion of = 0.8 km s-1 and a velocity range of 3.2 km s-1 from 28 observations spanning 4982 days, and did not classify it as binary. That said, given the long histories needed to establish the universality of binarity among the Ba and CH stars (McClure & Woodsworth, 1990) and the CEMP-s stars (Lucatello et al., 2005), one should be very hesitant to rush to judgment on the issue of variability for the C-rich class under discussion here.
In Table 5, we summarize the results of our literature search for radial velocity measurements of the 23 C-rich stars in Table 1. Columns (1) – (3) contain star name, average heliocentric radial velocity, and number of epochs121212Given the long periods and timespans involved, we average velocities, if taken within an interval of days, to obtain an individual velocity observed at the “epoch” defined by the average of the individual times of observation. for which velocity data are available, while columns (4) – (6) present the observed velocity range for each object, the span (in days) of the observations, and the data sources, respectively. (In the final column of the table we present distances for those stars having [Fe/H] –3.1, which we shall introduce and use in Section 5.) Taken at face value, among the 13 stars in Table 5 with multiple observations, CS 22957-027 is the only one (8% of the sample) for which variations greater than km s-1 have been observed. For comparison, we note that Carney et al. (2003) report the spectroscopic binary frequency for giants with [Fe/H] and periods less than 6000 days is 16 4%, and 17 2% for dwarfs of similar metallicity.
| Star | Vrad | N | Range | Span | SourcesaaReferences: 1 = Aoki et al. (2008), 2 = Norris et al. (2012b), 3 = Bessell et al. (2004), 4 = Carney et al. (2003), 5 = Norris et al. (2007), 6 = Norris et al. (2012a), 7 = Norris et al. (2010), 8 = Cohen et al. (2008), 9 = Cohen et al. (2006), 10 = Frebel et al. (2007b), 11 = Barklem et al. (2005), 12 = Lai et al. (2008), 13 = Aoki et al. (2006), 14 = Frebel et al. (2006), 15 = Aoki et al. (2002a), 16 = Aoki et al. (2004), 17 = McWilliam et al. (1995), 18 = Norris et al. (2001), 19 = Depagne et al. (2002), 20 = Preston & Sneden (2001) | Dist.bbDistances for stars having [Fe/H] –3.1 |
|---|---|---|---|---|---|---|
| (km s-1) | (km s-1) | (days) | (pc) | |||
| (1) | (2) | (3) | (4) | (5 | (6) | (7) |
| HE 00575959 | 375.3 | 1 | … | … | 2 | 8360 |
| HE 01075240 | 44.3 | 3 | 0.6 | 373 | 3 | 9620 |
| 53327-2044-515 | 193.5 | 1 | … | … | 2 | 3110ccDistances for low gravity solutions. The corresponding values for the high gravity cases are 620 pc and 340 pc for 53327-2044-515 and HE 12011512, respectively |
| HE 01461548 | 114.9 | 1 | … | … | 2 | 37770 |
| BD | 150.6 | 28 | 3.2 | 4982 | 4 | 160 |
| HE 05574840 | 212.1 | 5 | 1.2 | 668 | 5, 6 | 10490 |
| Segue 1-7 | 204.3 | 1 | … | … | 7 | 23000 |
| HE 10121540 | 225.6 | 2 | 1.5 | 1093 | 8 | 1660 |
| HE 11500428 | 46.6 | 1 | … | … | 9 | 5970 |
| HE 12011512 | 238.0 | 2 | 1.6 | 279 | 2 | 1610ccDistances for low gravity solutions. The corresponding values for the high gravity cases are 620 pc and 340 pc for 53327-2044-515 and HE 12011512, respectively |
| HE 1300+0157 | 74.3 | 5 | 1.9 | 688 | 10, 11, 8 | 2050 |
| BS 16929-005 | 51.8 | 3 | 1.2 | 308 | 12 | 3130 |
| HE 13272326 | 63.8 | 4 | 0.7 | 383 | 13, 14 | 1190 |
| HE 15060113 | 137.1 | 1 | … | … | 2 | 9710 |
| CS 22878-027 | 90.8 | 1 | … | … | 12 | … |
| CS 29498-043 | 32.5 | 2 | 0.1 | 685 | 15, 16 | 13660 |
| HE 21395432 | 114.4 | 2 | 2.1 | 259 | 2 | 4720 |
| HE 21425656 | 103.4 | 1 | … | … | 2 | … |
| HE 22024831 | 56.2 | 1 | … | … | 2 | … |
| CS 29502-092 | 68.7 | 3 | 1.1 | 1137 | 12 | … |
| HE 22477400 | 5.7 | 1 | … | … | 2 | … |
| CS 22949-037 | 125.8 | 4 | 0.8 | 4845 | 8, 17, 18, 19 | 9060 |
| CS 22957-027 | 72.8 | 17 | 20.0 | 3125 | 20 | 3530 |
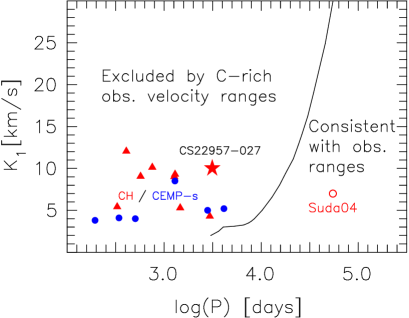
What is the probability of observing the preponderance of the small velocity ranges seen in Table 5, given the observed numbers of epochs and their time spans? We have addressed this issue using Monte Carlo simulations, as follows. We first assumed that each star has an observed sinusoidal radial velocity curve with semi-amplitude 10 km s-1 and period 3125 days, similar in first approximation to the values observed for CS 22957-027 by Preston & Sneden (2001). We excluded CS 22957-027 and BD, and for each of the other 11 stars in the table with multiple observations set the first “observation” at a random phase for which we determined the velocity, and then obtained the velocities that would be observed at all other epochs of observation of that star. We also assumed that the orbital plane of the binary was inclined at random with respect to the plane of the sky, and determined the individual velocity range expected for each of the 11 stars. We repeated the exercise 100,000 times and asked “In what fraction of the exercises would the simulated observations of each star exhibit a velocity range no greater than that actually observed or 1.0 km s-1, whichever was the larger”131313We set a lower limit 1.0 km s-1, which corresponds to the error in the difference of the two velocities that determine the velocity range in column (4) of Table 5, each of which is assumed to have an error of measurement of 0.7 km s-1.. The fraction was 0.0. No case was obtained in which all 11 stars exhibit radial velocity variations smaller than the larger of the observed range and 1.0 km s-1. We then asked the question “At a given assumed velocity curve semi-amplitude of the putative binary, what is the period greater than which the above Monte Carlo process would ‘observe’ no velocity span, for each star, greater than the larger of the span presented in column (4) of Table 5 and 1.0 km s-1, in 99% of cases”. The results of this exercise are presented in Figure 9, where the continuous line represents the locus of the velocity curve semi-amplitude, K1, as a function of the resulting value of log(Period). For comparison, we also include data for the observed positions of CH stars (triangles; McClure & Woodsworth, 1990), CEMP-s stars (filled circles; Lucatello et al., 2005), and the binary CEMP-no star, CS 22957-027 (star symbol), from Table 5. For the interest of the reader we also plot the position of the Suda et al. (2004) binary model for the C-rich star HE 0107–5240 (period 150 yrs, K1 = 7 km s-1). To the left of the line, the observed velocity ranges in Table 5 exclude, at the 99% level, the hypothesis that all of the C-rich stars with [Fe/H] are binary, while to the right the hypothesis is accepted. The periods that are consistent with the null hypothesis are very long: P 10,000 days = 27 yrs. It may be some time before this issue is settled.
In summary, the binary statistics for CEMP-no stars are decidedly different from those of CEMP-s stars. Further data are necessary to more fully characterize the binary nature of the CEMP-no subclass.
5. THE KINEMATICS OF THE C-RICH AND C-NORMAL STARS WITH [FE/H]
The radial velocities presented in Table 5 contain information on the kinematics of the C-rich population in Table 1. In order to investigate whether the C-rich and C-normal populations have the same kinematic properties, Table 6 presents radial velocities from the literature for the 34 C-normal stars in Paper II, plus SDSS J102915+17292711, that have [Fe/H] –3.1. As before, we define C-normal as [C/Fe] . The contents of columns (1) – (5) have been taken from Paper II, while columns (6) – (7) contain the radial velocities together with their sources. We would agree with the critic who suggests that our choice of the upper limit of [Fe/H] = –3.1 is somewhat arbitrary; that said, we would note in reply that this value concentrates our investigation on the regime where the C-rich population of Table 1 is best defined, with minimal contamination from the CEMP-r, -r/s, and -s subclasses. In the final column of the table (and that of Table 5, as foreshadowed in Section 4), we present distances required in the kinematic analysis that follows. These were obtained by first fitting the , , and [Fe/H] values in Tables 1 and 6 to the Yale–Yonsei Isochrones (Demarque et al., 2004)141414http://www.astro.yale.edu/demarque/yyiso.html, for an age of 12 Gyr, to obtain absolute magnitudes, MV, and then using these in conjunction with apparent magnitudes and E() reddenings taken from the literature151515We note two exceptions. For the stars SDSS J102915+172927 and Segue1-7 we adopt the distances of Caffau et al. (2011) and Martin et al. (2008), respectively..
| Star | [Fe/H] | [C/Fe] | Vrad | SourcesaaReferences: 1 = Bonifacio et al. (2009), 2 = Honda et al. (2004a), 3 = Cohen et al. (2008), 4 = Lai et al. (2008), 5 = Caffau et al. (2011), 6 = Bonifacio et al. (2007), 7 = Norris et al. (2012b) | Dist. | ||
|---|---|---|---|---|---|---|---|
| (km s-1) | (pc) | ||||||
| (1) | (2) | (3) | (4) | (5 | (6) | (7) | (8) |
| CD 38 245 | 4857 | 1.54 | 4.15 | 0.33 | 46 | 1 | 4310 |
| CS 22183-031 | 5202 | 2.54 | 3.17 | 0.42 | 12 | 2 | 3230 |
| HE 0132–2439 | 5249 | 2.63 | 3.79 | 0.62 | 289 | 3 | 5380 |
| CS 22189-009 | 4944 | 1.83 | 3.48 | 0.31 | –20 | 1 | 8050 |
| CS 22963-004 | 5597 | 3.34 | 3.54 | 0.40 | 292 | 4 | 2800 |
| CS 22968-014 | 4864 | 1.60 | 3.58 | 0.25 | 159 | 1 | 8930 |
| CS 22172-002 | 4893 | 1.68 | 3.77 | 0.00 | 251 | 1 | 4820 |
| BS 16469-075 | 4919 | 1.78 | 3.25 | 0.21 | 333 | 2 | 6300 |
| SDSS 1029+1729bbSDSS J102915+172927 (Caffau et al., 2011) | 5811 | 4.00 | 4.73 | 0.93 | –34 | 5 | 1270 |
| BS 16920-017 | 4851 | 1.58 | 3.40 | 0.07 | –206 | 2 | 9630 |
| BS 16085-050 | 4910 | 1.76 | 3.16 | 0.52 | –75 | 2 | 3570 |
| BS 16076-006 | 5566 | 3.32 | 3.51 | 0.34 | 206 | 6 | 1440 |
| HE 1320–2952 | 5106 | 2.26 | 3.69 | 0.52 | 390 | 7 | 4940 |
| BS 16467-062 | 5310 | 2.80 | 3.80 | 0.40 | -91 | 1 | 3200 |
| HE 1347–1025 | 5206 | 2.52 | 3.71 | 0.15 | 49 | 3 | 6260 |
| HE 1356–0622 | 4953 | 1.85 | 3.63 | 0.05 | 94 | 3 | 8810 |
| BS 16550-087 | 4754 | 1.32 | 3.54 | 0.49 | –147 | 4 | 11390 |
| HE 1424–0241 | 5260 | 2.66 | 4.05 | 0.63 | 60 | 3 | 6570 |
| BS 16477-003 | 4879 | 1.66 | 3.39 | 0.29 | –223 | 1 | 10410 |
| CS 30325-094 | 4948 | 1.85 | 3.35 | 0.00 | –158 | 1 | 3570 |
| CS 30312-059 | 4908 | 1.75 | 3.22 | 0.27 | –156 | 4 | 5141 |
| BS 16084-160 | 4727 | 1.27 | 3.20 | 0.12 | –130 | 4 | 9140 |
| CS 22878-101 | 4796 | 1.44 | 3.31 | 0.29 | –129 | 1 | 9430 |
| BS 16080-093 | 4945 | 1.85 | 3.23 | 0.63 | –205 | 4 | 6420 |
| CS 22891-209 | 4699 | 1.18 | 3.32 | 0.65 | 80 | 1 | 6040 |
| BD 18 5550 | 4558 | 0.81 | 3.20 | 0.02 | –125 | 1 | 2230 |
| CS 22885-096 | 4992 | 1.93 | 3.86 | 0.26 | –250 | 1 | 5200 |
| CS 30336-049 | 4725 | 1.19 | 4.10 | 0.23 | –237 | 4, 7 | 14110 |
| CS 22897-008 | 4795 | 1.43 | 3.50 | 0.56 | 267 | 1 | 8780 |
| CS 22948-066 | 5077 | 2.20 | 3.20 | 0.00 | –171 | 1 | 4420 |
| CS 22956-050 | 4844 | 1.56 | 3.39 | 0.27 | 0 | 1 | 11920 |
| CS 22965-054 | 6137 | 3.68 | 3.10 | 0.62 | –283 | 4 | 2300 |
| CS 29502-042 | 5039 | 2.09 | 3.27 | 0.16 | –138 | 1 | 3470 |
| CS 22888-031 | 6241 | 4.47 | 3.31 | 0.38 | –125 | 6 | 940 |
| CS 22952-015 | 4824 | 1.50 | 3.44 | 0.41 | –18 | 1 | 7890 |
Following Frenk & White (1980), we determine, for these C-rich and C-normal populations, the Galactic systemic rotational velocity, Vrot, and , the rms value for the dispersion of the line-of-sight peculiar motions with respect to the group motion. We refer the reader to Norris (1986) and Beers & Sommer-Larsen (1995) for our earlier applications of this technique in the determination of the systemic rotation of the older and more metal-poor populations of the Galaxy. For the 18 C-rich stars in Table 5 with [Fe/H] –3.1 we obtain Vrot = –44 45 km s-1 and = 90 15 km s-1, while for the 35 C-normal stars in Table 6 the corresponding numbers are –76 59 km s-1 and 151 18 km s-1, respectively. The differences between the two populations are Vrot = 32 74 km s-1 and = 61 23 km s-1. That is, the present results show no significant difference between Vrot for the two groups, and a 2.6 difference between their values. While the latter result may be considered suggestive of a real difference, we suggest that more data should be obtained to test its reality.
Carollo et al. (2012) have demonstrated (i) the existence of a significant increase in the fraction of CEMP stars with increasing height above the Galactic plane, Z, and (ii) that the frequency of CEMP stars associated with the outer-halo population is significantly higher than that of the inner-halo. We recall that their result was based on material principally more metal-rich than [Fe/H] = –3.0: the most metal-poor bin in their Figure 15 at [Fe/H] –2.7 contained C-rich fractions of 20% and 30% for their inner- and outer-halo components, respectively. We recall also that Carollo et al. (2012), given the spectral resolution of their spectra, were unable to determine the CEMP subclass of stars in their data set. A possible explanation of their results is that it arises from a relatively larger fraction of CEMP-no stars in the outer halo, in particular for [Fe/H] . A prediction of this conjecture is that the CEMP-no/CEMP-s ratio was higher in the Galaxy’s accreted dwarf galaxies that preferentially populated its outer rather than its inner regions. Future determination of this ratio in the Galaxy’s satellite dwarf galaxies should be undertaken to constrain this possibility.
Application of the Frenk & White (1980) formalism to the combined sample of the 53 C-rich and C-normal stars having [Fe/H] –3.1, yields Vrot = –64 41 km s-1, and = 133 13 km s-1. We also divided this sample into two groups having essentially equal size, the first containing the 26 stars with [Fe/H] and the other the 27 with [Fe/H] –3.5. The results are presented in Table 7, and plotted in Figure 10 (star symbols) as a function of mean iron abundance, [Fe/H]. For comparison purposes we also include the results for the metal-poor halo samples of Norris (1986, Table 9) (filled circles) and Beers & Sommer-Larsen (1995, Table 3) (open circles). The most interesting feature of the figure is the large retrograde Vrot = –119 64 km s-1 value at [Fe/H] = –4.0, some 2 below the rotational velocity of 20 km s-1 of halo material in the range –1.5 [Fe/H] –3.0. Once again, further data are required before one can regard the result as definitive. Another reality check is provided by consideration of the sample sizes used. We refer the reader to Norris (1986, Section III(d)), who addressed the issue by using simulated samples, and concluded “The data suggest that reliable results can be obtained with all sample sizes, in the sense that the errors accurately reflect the quality of the estimates but that if relatively accurate information is required samples of size in excess of 100 objects are necessary”.
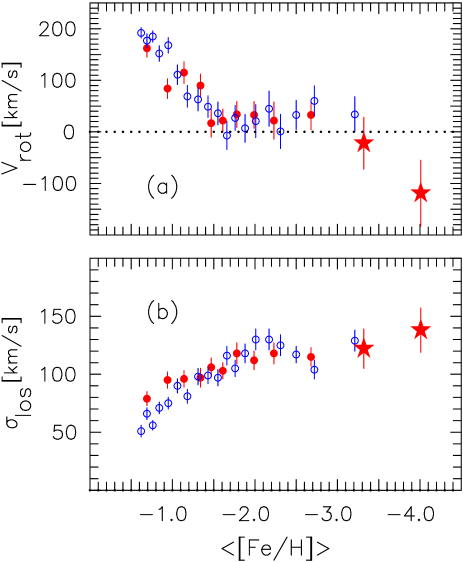
| [Fe/H] | Vrot | No. | |
|---|---|---|---|
| (km s-1) | (km s-1) | ||
| (1) | (2) | (3) | (4) |
| –3.32 | –22 50 | 122 17 | 26 |
| –4.01 | –119 64 | 138 19 | 27 |
6. DISCUSSION
6.1. Suggested Theoretical Scenarios
To this point, we have discussed various observational aspects of the C-rich stars – their chemical abundance patterns, binarity, and kinematics. A great amount of effort in the literature has also been devoted, from a theoretical perspective, to understanding the origin of the most metal-poor stars, and in particular to the large fraction that is C-rich. We now turn our attention to these efforts, in an attempt to understand the possible origin(s) of the C-rich stars, and briefly outline some of the suggestions that have been made. This topic has been considered at some length, and we refer the reader to the works of Beers & Christlieb (2005), Cohen et al. (2008), Frebel et al. (2007b), Fujimoto et al. (2000), Heger & Woosley (2010), Joggerst et al. (2010), Lai et al. (2008), Masseron et al. (2010), Meynet et al. (2006, 2010), Nomoto et al. (2006), Norris et al. (2007), and Suda et al. (2004) for previous discussions. Here are some of the phenomena suggested to be involved in various chemical enrichment scenarios of material initially having zero or very low heavy-element content.
-
1.
Fine-structure line transitions of C II and O I as a major cooling agent in the early Universe (Bromm & Loeb, 2003)
C- and/or O- rich material forms stars, through fragmentation, on shorter timescales than in regions where their abundances were lower, leading to the formation of long-lived, low mass C- and/or O-rich stars still observable today.
-
2.
Supermassive (M 100 M⊙), rotating stars (Fryer et al., 2001)
In some mass ranges, rotation leads to mixing, by meridional circulation, of C and O from the He-burning core into the H-burning shell, leading to large N enhancements.
-
3.
Multiple generations of Type II supernovae (SNe) involving “fallback” (M M⊙) (Limongi et al., 2003)
The ejecta from a “normal” SN is combined with that from one of low energy in which the outer layers (rich in light elements) are expelled, while much of the inner layers (rich in the heavier elements) “fall back” onto the central remnant.
-
4.
Low energy SNe eject material preferentially from their outer regions, which are enhanced in light elements, with the expulsion of only relatively small amounts of the heavier elements formed deeper in the star. During the explosion, internal mixing occurs in an annulus outside the mass cut at which the expansion in initiated. A small amount of mixed material is eventually expelled from the star, with most of it falling back into the central regions.
-
5.
Type II SNe with relativistic jets (Tominaga et al., 2007)
A relativistic jet-induced black-hole-forming explosion of a 40 M⊙ SN leads to infall of inner material that “decreases the [ejected] amount of inner core material (Fe) relative to that of outer material (C)”.
-
6.
Zero-metallicity, rotating, massive ( M⊙) and intermediate mass ( M⊙) stars (Meynet et al., 2006, 2010; Hirschi, 2007)
Rotationally-driven meridional circulation leads to CNO enhancements and large excesses of 13C (and hence low 12C/13C values), Na, Mg, and Al, in material expelled in stellar winds. The essential feature of rotation is to admix and further process the products of H and He burning.
-
7.
Nucleosynthesis and mixing within low-mass, low-metallicity, stars (Fujimoto et al., 2000; Campbell et al., 2010)
Carbon is mixed to the outer layers of low-mass, extremely metal-poor giant stars, while mixing – driven by a helium flash – transports protons into the hot convective core. Enhancements of Na, Mg, Al, and heavy neutron-capture elements are also predicted.
-
8.
Population III binary evolution with mass transfer, and subsequent accretion from the interstellar medium (Suda et al., 2004; Campbell et al., 2010)
The primary of a zero-heavy-element binary system is postulated to transfer C- and N-rich material, during its AGB phase, onto the currently-observed secondary, which later accretes Fe from the interstellar medium to become a CEMP star.
-
9.
Separation of gas and dust beyond the stellar surface during stellar evolution, followed by the accretion of the resulting dust-depleted gas (Venn & Lambert, 2008)
The peculiar abundance patterns result from fractionation of the elements onto grains, as determined by their condensation temperatures, during stellar evolution, rather than being due to “natal variations”. Subsequent examination of the critical elements sulfur and zinc in the Fe-poor, C-rich stars CS 22949–037 ([Fe/H] = –4.0) and HE 1327–2326 ([Fe/H] = –5.8) by Spite et al. (2011) and Bonifacio et al. (2012), respectively, shows that they are detected in neither object. In HE 1327–2326, the limits on [S/H] and [Z/H] are consistent with the condensation hypothesis. For CS 22949–037, however, the limits for both elements lie some 1.5 dex below the values that would be expected. Given these results, we shall not consider this mechanism further. That said, it would be very valuable to obtain further sulphur and zinc abundances, or limits, of more C-rich stars, to examine the question in greater detail.
6.2. Comparison with Theoretical Predictions
In the context of the material presented in Sections 3 – 5 we now ask: which of these mechanisms do the observations require; which, if any, may be rejected; and which need further work to enable sharper confrontation between observation and theory? We consider the observational constraints set by the abundance patterns and kinematics of the C-rich stars in Table 1.
-
1.
The ubiquitous CNO enhancements and low 12C/13C values, the Na, Mg, Al, Si enhancements in % of the population, and the relative normality of the heavier elements (Z 20)
While CNO enhancements and low 12C/13C values may originate in several environments, those of Na, Mg, and Al are best explained in terms of the bringing together and processing of material from H-burning and He-burning regions in the intermediate depths of massive and/or intermediate mass stars. This is a generic property of the “mixing and fallback” models; of the zero-heavy-element, rotating, massive and intermediate-mass stars; and of the Type II SNe with relativistic jets scenarios (discussed above), all of which lead to the expulsion of large amounts of these elements from the intermediate depths in stars where they are produced. See, for example, the model enhancements of Na, Mg, and Al produced by Iwamoto et al. (2005, Figures 1 and 2) (“mixing and fallback”), and by Meynet et al. (2006, Figures 8 and 10) (for zero-heavy-element, rotating, massive and intermediate mass stars). Currently (to our knowledge), a comparison of observation with theory is not available for Si and Ca for the fast-rotating models.
The fact that only half of the C-rich stars exhibit large Na, Mg, and Al enhancements seems readily explainable. In “mixing and fallback” models, it results from the admixing of different radial zones, their nuclear burning, and the expulsion of material that contains different relative amounts of synthesized Na, Mg and Al. We refer the reader to Iwamoto et al. (2005) for an explanation of the different abundance patterns of HE 0107–5240 and HE 1327–2326. For the “fast rotator” hypothesis, one might naturally expect the relative amounts of Na, Mg, and Al (products of H- and He-burning) to be a function of rotational velocity.
-
2.
Enhancements of Si and Ca exist in some stars, and are relatively small compared with those of C, N, O, Na, Mg, and Al
As noted above, the chemical enrichment produced by nucleosynthesis in zero-heavy-element models of “mixing and fallback” SNe, of rotating, massive and intermediate mass stars, and of SNe with relativistic jets best explains the relative abundances presented here. There is, however, a basic difference between the rotating star models, on the one hand, and the “mixing and fallback” and relativistic jet models, on the other. In principle at least, the two cases sample different regions of the stars that produce the enrichment. In the rotating models, the regions providing the enrichment are the outer layers that mix via meridional circulation, and much of the ejecta are expelled in stellar winds, before exhaustion of the nuclear fuel in the central regions leads to a potential explosion. In the other class of model, all enrichment patterns are determined in the supernova phase, during which there is mixing and expulsion, potentially at least, of material from all parts of the star outside the core. Insofar as Si and Ca are produced deeper in a star than are the lighter elements, they present the potential to test the predictions of the different models more closely. In particular, it would be interesting to have more accurate abundances of these elements in a larger sample of C-rich stars for comparison with more detailed predictions of the two classes of models. This could be a very useful avenue for investigation.
-
3.
The increasing fractions of stars enhanced in C, N, O, Na, Mg, Al, and Si relative to Fe as [Fe/H] decreases
The processes leading to the C-rich class appear to dominate at the lowest values of [Fe/H]. We suggest that below [Fe/H] –3.0 the data are consistent with the existence, among the stars we observe today, of two populations that have quite distinct abundance patterns of the light elements, with the observed C-rich population being the more dominant tracer at lowest [Fe/H] and earliest times in the Universe.
Impetus for this possibility comes from the extreme dependence of cooling at low metallicites and low temperatures on carbon and oxygen (e.g., Dalgarno & McCray, 1972), and the suggestion by Bromm & Loeb (2003) and Frebel et al. (2007a) that cooling through the fine-structure lines of C II and O I played the major role in the collapse and fragmentation of gas clouds in the early Universe, to produce the low mass stars we observe today. That is to say, the C-rich stars of Table 1 are the survivors of the earliest times, and objects that did not have C/Fe enhancements may no longer exist among the most Fe-poor stars because (i) the first generations of low C/Fe objects had a top-heavy IMF (i.e., having few low-mass stars) and/or (ii) these generations took longer to form and enrich the material from which later generations formed – by which time the C/Fe-enhanced stars had contributed significantly to the Fe abundance of the Universe.
-
4.
From a limited data set of some 13 C-rich stars in Table 1, only one exhibits evidence for radial velocity variations greater than 3 km s-1
There is currently little observational support for a universal binary production of C-rich stars with [Fe/H] –3.0 (i.e., CEMP-no and hyper metal-poor stars), such as exists for the CH stars and the CEMP-s subclass. That said, Monte Carlo analysis shows that binary systems having periods greater than years are not precluded by the bulk of the available data. A point worth noting is that none of the (binary) CH- and CEMP-s stars has a period in this range; all stars in these classes have P 12 years. A second interesting distinction between the CEMP-no and the CEMP-s stars is that CEMP-s stars are found only for [Fe/H] , while CEMP-no stars exist at all metallicities [Fe/H] –2.0.
We conclude that the available data offer no clear support for a binarity-related explanation of the C-rich stars with [Fe/H] . More velocities, systematically collected and on a timescale of decades, will be needed before a definitive statement based on radial velocity measurements can be made concerning the role of binarity in the production of C-rich stars.
6.3. On the Origins of the C-rich and C-normal Populations
Within the CDM paradigm of the early Universe, as described by Bromm et al. (2009, and references therein), we suppose that the first stars formed in dark matter “minihalos” from material containing no elements heavier than lithium; that the cooling was provided by molecular hydrogen; and that the mass function of these first objects was top-heavy relative to those observed today, and contained no low-mass, long-lived stars that might be observed today161616We recognize that the detail of the mass function of the first stars is the subject of ongoing investigation (see, e.g., Clark et al., 2011 and Dopcke et al., 2012). As emphasized to us by a referee, given current uncertainty, one may only conclude that the population contained “no stars with lifetimes longer than the age of the Universe”.. These are the so-called Population III.1 stars. We further suppose that some fraction of these objects produced large amounts of carbon and oxygen, as described, for example, by some or all of the stellar evolutionary models of the type described above – the rotating 250 – 300 M⊙ models of Fryer et al. (2001); the “mixing and fallback” models of Umeda & Nomoto (2003, 2005); the relativistic jet-induced explosion of Tominaga et al. (2007); and the rapidly-rotating stars of Meynet et al. (2006, 2010). We also expect that some fraction of the Population III.1 stars did not produce large amounts of carbon (as the result perhaps of canonical SNe explosions without fallback, or slower rotation), but produced chemical abundance patterns that were rather more solar-like in nature. The ejecta from all of these objects provided the chemical enrichment of the material that later formed the second generations (Population III.2). We consider two possible scenarios.
6.3.1 Two cooling channels
Following Bromm & Loeb (2003) and Frebel et al. (2007a), we assume that during the subsequent star formation within the second generation, the material with large enhancements of carbon and oxygen fragmented to form low-mass, long-lived stars that are still observed today. We identify the C-rich population with stars formed from the carbon-enriched material. Support for this identification comes in particular from the work of Frebel et al. (2007a), who investigated the degree of carbon and/or oxygen enhancement that was necessary to produce the cooling and subsequent fragmentation of the first low-mass, long-lived stars. They introduced the transition discriminant )) and predicted that no metal-poor stars should exist below the critical value = . Inspection of the ultra metal-poor region ([Fe/H] –4.0) in Figure 23 ( vs. [Fe/H]) of Frebel & Norris (2011) (an update of Figure 1 of Frebel et al., 2007a) shows that, of the four stars with [Fe/H] –4.0, there are three above this critical value (the C-rich stars HE 0107–5240, HE 0557–4840. and HE 1327–2326 in our Table 1), and one (the C-normal SDSS J102915+17292711) below it. That is to say, the data for all C-rich stars with [Fe/H] –4.0 are consistent with the Bromm et al. hypothesis, while the non-C-rich star requires a different mechanism, as first pointed out by Caffau et al. (2011).
We note in passing that we are unaware of models of very massive rotating stars (M M⊙) that predict the observed, correlated enhancements of, e.g., Na, Mg, and Al, relative to C and O. Thus, at least from a nucleosynthetic point of view, further theoretical work is required to establish if these objects played a role in the chemical enrichment of the C-rich stars.
The existence of the C-normal star SDSS J102915+172927, with [Fe/H] = –4.7 and [C/Fe] +0.9 (Caffau et al., 2011, 2012), suggests that a different gas-cooling mechanism also existed at the earliest times. It lies beyond the scope of the present work to identify that process, and we refer the reader to Bromm et al. (2009, and references therein) for discussion of possibilities and uncertainties. Bearing in mind the caveats in that work, we draw the reader’s attention to the dust-induced star formation hypothesis of Schneider et al. (2006), which enables “fragmentation to solar or subsolar mass scales already at metallicities ZCr = 10-6Z⊙”. See also the more recent discussion by Schneider et al. (2012a, b). We conjecture here that there was a second cooling channel in the early Universe, and that it and cooling by C/O-rich material played commensurate roles in producing the C-normal and C-rich populations, respectively, having [Fe/H] –3.0, observed today.
6.3.2 One cooling channel plus binarity
An alternative suggestion is that all stars resulted from the second channel discussed in the previous paragraph, and that the C-rich stars acquired their surface carbon later from processes involving binary systems similar to those that produced CH stars and CEMP-s stars, and as described, e.g., by Suda et al. (2004), in the context of the C-rich hyper metal-poor star HE 0107–5240. While we currently find no evidence for the existence of a large fraction of binaries among the C-rich stars, more work is needed before the binary hypothesis may be rigorously excluded on observational grounds.
6.4. Comparison with the Chemical Abundances of High Redshift, z = 2 – 6, Galaxies
How do the abundances of the most metal-poor Galactic halo stars compare with those of high redshift galaxies? We conclude by comparing the stellar abundances discussed here with results for galaxies observed in quasar absorption line systems having redshifts z 2, in particular the metal-poor damped Lyman- (DLA) systems at lower redshifts 2 z 4 (e.g., Cooke et al., 2011b, and references therein) and the so-called sub-DLAs over the range 4 z 6 (e.g., Becker et al., 2012, and references therein).
In the lower redshift regime, Cooke et al. (2011a, b) report column densities for H, C, N, O, Al, Si, S, Ar, Cr, Fe, Ni, and hence relative abundances of the form [X/Y] (in particular [X/H]), as adopted in the present work. Three points of comparison are worth making: (i) in a sample of 21 objects with [Fe/H] –2.0, the three most metal-poor systems have [Fe/H] = –3.0, –3.2, and –3.5; (ii) the ratios of C/O and O/Fe are consistent with values determined for stars in the Galactic halo (when the [OI] 6300Å line is adopted in the stellar analyses); and (iii) one of the 10 systems with C and Fe abundances has the composition of a CEMP star – [Fe/H] = –3.0 and [C/Fe] = +1.5. (We note that this result has been challenged by Becker et al., 2012, their Section 4. See also Carswell et al., 2012.)
The results of Becker et al. (2012) for the sub-DLAs extend the dataset to redshift z = 6.3, and provide abundance information for C, O, Si, and Fe. Unfortunately, no estimates are available for the abundance of hydrogen because “the Ly at z is too highly absorbed to allow accurate HI column density measurement”, and no estimates of [X/H] (in particular [Fe/H]) are available in this regime. Becker et al. (2012) supplement their new results with those of others at lower redshift (including those of Cooke et al., 2011b, except for their system having the composition of a CEMP star) to provide a sample over the redshift range z = 2 – 6. The extremely important limitation for a comparison of this collective data set with the stellar abundances discussed in the present paper is that we do not know the metallicities, [X/H], for all of the high-redshift sample: indeed, the lowest available iron abundance is [Fe/H] = –3.5, at redshift z = 3.7. That said, Becker et al. (in their Figure 11) plot [C/O], [Si/O], [C/Si], [C/Fe], [O/Fe], and [Si/Fe] as functions of redshift, where one sees no evidence for a large variation in any of the relative abundances. In particular, for their four systems having C and O abundances over the range 4.7 z 6.3, they report mean values [C/Fe] = +0.17 0.07 and [O/Fe] =+0.50 0.05, respectively. That is to say, the C and O abundance of sub-DLA systems at the highest redshifts currently observed are the same as those of “normal” non-carbon-enhanced Galactic halo stars. In comparison with the abundances of carbon in the most Fe-poor stars in the Milky Way, Becker et al. (2012) suggest: “If carbon-enhanced stars fairly reflect their native ISM abundances, then these abundances are no longer common by z 6. This raises the intriguing possibility that most carbon-enhanced stars were formed at even earlier times [than the C and O observed in the sub-DLA systems].” Their conjecture resonates with our suggestion above that the C-rich stars were the first low-mass, long-lived, stars to form in the Universe.
7. SUMMARY
We have examined the chemical abundance patterns of 18 carbon-rich stars having [C/Fe] +0.7 and [Fe/H] 3.1 (16 CEMP-no stars and two other stars with [Fe/H] –5.5 and [C/Fe] +4, but no star from the CEMP-r, r/s and -s subclasses), based on high-resolution, high , 1D model-atmosphere analyses. These objects represent some 30% of stars below this iron-abundance limit for which carbon abundances or limits permit C-rich and C-normal determinations. These C-rich stars are also oxygen- and nitrogen-rich, while a large fraction of them is strongly enhanced in Na, Mg, and Al relative to Fe, and to a lesser degree in Si and Ca. These chemical signatures are consistent with the admixing and processing of material from H-burning and He-burning regions, as achieved by nucleosynthesis in the zero-heavy-element models of “mixing and fallback” SNe (Umeda & Nomoto 2003, 2005); of rotating, massive and intermediate mass stars (Meynet et al. 2006, 2010); and of Type II SNe with relativistic jets (Tominaga et al., 2007).
We suggest that the C-rich and C-normal populations below [Fe/H] –3.1 result from two different gas-cooling channels in the very early Universe, of material that formed the progenitors of the two populations. In the first, cooling was provided by fine-structure line transitions of C II and O I to form the C-rich population. In the second, the physical process, while not well-defined (perhaps dust-induced cooling?), led to the C-normal group. The available radial velocity data offer little support for a binary origin of these C-rich stars (at least with periods less than years), and more data are required before one could conclude that binarity is necessary for an understanding of the C-rich population.
A comparison of the abundances of the most Fe-poor, C-rich stars with those reported for high-redshift Damped Lyman- and sub-DLA systems in the range z = 2 – 6 is consistent with the view that the C-rich stars originated at even earlier times than material observed to date in the DLA and sub-DLA systems.
References
- Aoki (2010) Aoki, W. 2010, in IAU Symposium, Vol. 265, Chemical Abundances in the Universe: Connecting First Stars to Planets, ed. K. Cunha, M. Spite, & B. Barbuy, 111
- Aoki et al. (2007a) Aoki, W., Beers, T. C., Christlieb, N., et al. 2007a, ApJ, 655, 492
- Aoki et al. (2008) Aoki, W., Beers, T. C., Sivarani, T., et al. 2008, ApJ, 678, 1351
- Aoki et al. (2006) Aoki, W., Frebel, A., Christlieb, N., et al. 2006, ApJ, 639, 897
- Aoki et al. (2007b) Aoki, W., Honda, S., Beers, T. C., et al. 2007b, ApJ, 660, 747
- Aoki et al. (2004) Aoki, W., Norris, J. E., Ryan, S. G., et al. 2004, ApJ, 608, 971
- Aoki et al. (2002a) Aoki, W., Norris, J. E., Ryan, S. G., Beers, T. C., & Ando, H. 2002a, ApJ, 576, L141
- Aoki et al. (2002b) —. 2002b, PASJ, 54, 933
- Barklem et al. (2005) Barklem, P. S., Christlieb, N., Beers, T. C., et al. 2005, A&A, 439, 129
- Becker et al. (2012) Becker, G. D., Sargent, W. L. W., Rauch, M., & Carswell, R. F. 2012, ApJ, 744, 91
- Beers & Christlieb (2005) Beers, T. C., & Christlieb, N. 2005, ARA&A, 43, 531
- Beers et al. (1985) Beers, T. C., Preston, G. W., & Shectman, S. A. 1985, AJ, 90, 2089
- Beers et al. (1992) —. 1992, AJ, 103, 1987
- Beers & Sommer-Larsen (1995) Beers, T. C., & Sommer-Larsen, J. 1995, ApJS, 96, 175
- Bessell et al. (2004) Bessell, M. S., Christlieb, N., & Gustafsson, B. 2004, ApJ, 612, L61
- Bisterzo et al. (2012) Bisterzo, S., Gallino, R., Straniero, O., Cristallo, S., & Käppeler, F. 2012, MNRAS, 422, 849
- Bonifacio et al. (2012) Bonifacio, P., Caffau, E., Venn, K. A., & Lambert, D. L. 2012, A&A, 544, A102
- Bonifacio et al. (2007) Bonifacio, P., Molaro, P., Sivarani, T., et al. 2007, A&A, 462, 851
- Bonifacio et al. (2009) Bonifacio, P., Spite, M., Cayrel, R., et al. 2009, A&A, 501, 519
- Bromm & Loeb (2003) Bromm, V., & Loeb, A. 2003, Nature, 425, 812
- Bromm et al. (2009) Bromm, V., Yoshida, N., Hernquist, L., & McKee, C. F. 2009, Nature, 459, 49
- Caffau et al. (2011) Caffau, E., Bonifacio, P., François, P., et al. 2011, Nature, 477, 67
- Caffau et al. (2012) —. 2012, arXiv 1203.2607
- Campbell et al. (2010) Campbell, S. W., Lugaro, M., & Karakas, A. I. 2010, A&A, 522, L6
- Carney et al. (2003) Carney, B. W., Latham, D. W., Stefanik, R. P., Laird, J. B., & Morse, J. A. 2003, AJ, 125, 293
- Carollo et al. (2012) Carollo, D., Beers, T. C., Bovy, J., et al. 2012, ApJ, 744, 195
- Carswell et al. (2012) Carswell, R. F., Becker, G. D., Jorgenson, R. A., Murphy, M. T., & Wolfe, A. M. 2012, MNRAS, 422, 1700
- Cayrel et al. (2004) Cayrel, R., Depagne, E., Spite, M., et al. 2004, A&A, 416, 1117
- Christlieb et al. (2004) Christlieb, N., Gustafsson, B., Korn, A. J., et al. 2004, ApJ, 603, 708
- Christlieb et al. (2008) Christlieb, N., Schörck, T., Frebel, A., et al. 2008, A&A, 484, 721
- Clark et al. (2011) Clark, P. C., Glover, S. C. O., Klessen, R. S., & Bromm, V. 2011, ApJ, 727, 110
- Cohen et al. (2004) Cohen, J. G., Christlieb, N., McWilliam, A., et al. 2004, ApJ, 612, 1107
- Cohen et al. (2008) —. 2008, ApJ, 672, 320
- Cohen et al. (2007) Cohen, J. G., McWilliam, A., Christlieb, N., et al. 2007, ApJ, 659, L161
- Cohen et al. (2006) Cohen, J. G., McWilliam, A., Shectman, S., et al. 2006, AJ, 132, 137
- Cooke et al. (2011a) Cooke, R., Pettini, M., Steidel, C. C., Rudie, G. C., & Jorgenson, R. A. 2011a, MNRAS, 412, 1047
- Cooke et al. (2011b) Cooke, R., Pettini, M., Steidel, C. C., Rudie, G. C., & Nissen, P. E. 2011b, MNRAS, 417, 1534
- Dalgarno & McCray (1972) Dalgarno, A., & McCray, R. A. 1972, ARA&A, 10, 375
- Demarque et al. (2004) Demarque, P., Woo, J., Kim, Y., & Yi, S. K. 2004, ApJS, 155, 667
- Depagne et al. (2002) Depagne, E., Hill, V., Spite, M., et al. 2002, A&A, 390, 187
- Dopcke et al. (2012) Dopcke, G., Glover, S. C. O., Clark, P. C., & Klessen, R. S. 2012, arXiv:1203.6842
- François et al. (2007) François, P., Depagne, E., Hill, V., et al. 2007, A&A, 476, 935
- Frebel et al. (2006) Frebel, A., Christlieb, N., Norris, J. E., Aoki, W., & Asplund, M. 2006, ApJ, 638, L17
- Frebel et al. (2008) Frebel, A., Collet, R., Eriksson, K., Christlieb, N., & Aoki, W. 2008, ApJ, 684, 588
- Frebel et al. (2007a) Frebel, A., Johnson, J. L., & Bromm, V. 2007a, MNRAS, 380, L40
- Frebel & Norris (2011) Frebel, A., & Norris, J. E. 2011, arXiv:1102.1748
- Frebel et al. (2007b) Frebel, A., Norris, J. E., Aoki, W., et al. 2007b, ApJ, 658, 534
- Frenk & White (1980) Frenk, C. S., & White, S. D. M. 1980, MNRAS, 193, 295
- Fryer et al. (2001) Fryer, C. L., Woosley, S. E., & Heger, A. 2001, ApJ, 550, 372
- Fujimoto et al. (2000) Fujimoto, M. Y., Ikeda, Y., & Iben, Jr., I. 2000, ApJ, 529, L25
- Heger & Woosley (2010) Heger, A., & Woosley, S. E. 2010, ApJ, 724, 341
- Hirschi (2007) Hirschi, R. 2007, A&A, 461, 571
- Honda et al. (2004a) Honda, S., Aoki, W., Ando, H., et al. 2004a, ApJS, 152, 113
- Honda et al. (2004b) Honda, S., Aoki, W., Kajino, T., et al. 2004b, ApJ, 607, 474
- Ito et al. (2009) Ito, H., Aoki, W., Honda, S., & Beers, T. C. 2009, ApJ, 698, L37
- Iwamoto et al. (2005) Iwamoto, N., Umeda, H., Tominaga, N., Nomoto, K., & Maeda, K. 2005, Science, 309, 451
- Joggerst et al. (2010) Joggerst, C. C., Almgren, A., Bell, J., et al. 2010, ApJ, 709, 11
- Johnson (2002) Johnson, J. A. 2002, ApJS, 139, 219
- Johnson et al. (2007) Johnson, J. A., Herwig, F., Beers, T. C., & Christlieb, N. 2007, ApJ, 658, 1203
- Lai et al. (2008) Lai, D. K., Bolte, M., Johnson, J. A., et al. 2008, ApJ, 681, 1524
- Lai et al. (2009) Lai, D. K., Rockosi, C. M., Bolte, M., et al. 2009, ApJ, 697, L63
- Limongi et al. (2003) Limongi, M., Chieffi, A., & Bonifacio, P. 2003, ApJ, 594, L123
- Lind et al. (2009) Lind, K., Primas, F., Charbonnel, C., Grundahl, F., & Asplund, M. 2009, A&A, 503, 545
- Lucatello et al. (2005) Lucatello, S., Tsangarides, S., Beers, T. C., et al. 2005, ApJ, 625, 825
- Martin et al. (2008) Martin, N. F., de Jong, J. T. A., & Rix, H.-W. 2008, ApJ, 684, 1075
- Masseron et al. (2010) Masseron, T., Johnson, J. A., Plez, B., et al. 2010, A&A, 509, 93
- McClure & Woodsworth (1990) McClure, R. D., & Woodsworth, A. W. 1990, ApJ, 352, 709
- McWilliam et al. (1995) McWilliam, A., Preston, G. W., Sneden, C., & Searle, L. 1995, AJ, 109, 2757
- Meynet et al. (2006) Meynet, G., Ekström, S., & Maeder, A. 2006, A&A, 447, 623
- Meynet et al. (2010) Meynet, G., Hirschi, R., Ekstrom, S., et al. 2010, A&A, 521, A30
- Nomoto et al. (2006) Nomoto, K., Tominaga, N., Umeda, H., Kobayashi, C., & Maeda, K. 2006, Nuclear Physics A, 777, 424
- Norris (1986) Norris, J. 1986, ApJS, 61, 667
- Norris et al. (2012b) Norris, J. E., Bessell, M. S., Yong, D., et al. . 2012b, ApJ, in press (Paper I)
- Norris et al. (2012a) Norris, J. E., Christlieb, N., Bessell, M. S., et al. 2012a, ApJ, 753, 150
- Norris et al. (2007) Norris, J. E., Christlieb, N., Korn, A. J., et al. 2007, ApJ, 670, 774
- Norris et al. (2010) Norris, J. E., Gilmore, G., Wyse, R. F. G., Yong, D., & Frebel, A. 2010, ApJ, 722, L104
- Norris et al. (1997) Norris, J. E., Ryan, S. G., & Beers, T. C. 1997, ApJ, 489, L169
- Norris et al. (2001) —. 2001, ApJ, 561, 1034
- Preston & Sneden (2001) Preston, G. W., & Sneden, C. 2001, AJ, 122, 1545
- Ryan et al. (1996) Ryan, S. G., Norris, J. E., & Beers, T. C. 1996, ApJ, 471, 254
- Schneider et al. (2012a) Schneider, R., Omukai, K., Bianchi, S., & Valiante, R. 2012a, MNRAS, 419, 1566
- Schneider et al. (2006) Schneider, R., Omukai, K., Inoue, A. K., & Ferrara, A. 2006, MNRAS, 369, 1437
- Schneider et al. (2012b) Schneider, R., Omukai, K., Limongi, M., et al. 2012b, arXiv 1203.4234
- Sneden et al. (2008) Sneden, C., Cowan, J. J., & Gallino, R. 2008, ARA&A, 46, 241
- Sneden et al. (1996) Sneden, C., McWilliam, A., Preston, G. W., et al. 1996, ApJ, 467, 819
- Spite et al. (2011) Spite, M., Caffau, E., Andrievsky, S. M., et al. 2011, A&A, 528, A9
- Spite et al. (2005) Spite, M., Cayrel, R., Plez, B., et al. 2005, A&A, 430, 655
- Suda et al. (2004) Suda, T., Aikawa, M., Machida, M., Fujimoto, M., & Iben, I. 2004, ApJ, 611, 476
- Tominaga et al. (2007) Tominaga, N., Maeda, K., Umeda, H., et al. 2007, ApJ, 657, L77
- Umeda & Nomoto (2003) Umeda, H., & Nomoto, K. 2003, Nature, 422, 871
- Umeda & Nomoto (2005) —. 2005, ApJ, 619, 427
- Wisotzki et al. (1996) Wisotzki, L., Koehler, T., Groote, D., & Reimers, D. 1996, A&AS, 115, 227
- Venn & Lambert (2008) Venn, K. A., & Lambert, D. L. 2008, ApJ, 677, 572
- Yanny et al. (2009) Yanny, B., Rockosi, C., Newberg, H. J., et al. 2009, AJ, 137, 4377
- Yong et al. (2012) Yong, D., Norris, J. E., Bessell, M. S., et al. . 2012, ApJ, in press (Paper II)
- York et al. (2000) York, D. G., Adelman, J., Anderson, Jr., J. E., et al. 2000, AJ, 120, 1579