A Successful Broad-band Survey for Giant \lya Nebulae II: Spectroscopic Confirmation
Abstract
Using a systematic broad-band search technique, we have carried out a survey for large \lya nebulae (or \lya “blobs”) at within 8.5 square degrees of the NOAO Deep Wide-Field Survey (NDWFS) Boötes field, corresponding to a total survey comoving volume of 108 h Mpc3. Here, we present our spectroscopic observations of candidate giant \lya nebulae. Of 26 candidates targeted, 5 were confirmed to have \lya emission at , four of which were new discoveries. The confirmed \lya nebulae span a range of \lya equivalent widths, colors, sizes, and line ratios, and most show spatially-extended continuum emission. The remaining candidates did not reveal any strong emission lines, but instead exhibit featureless, diffuse blue continuum spectra. Their nature remains mysterious, but we speculate that some of these might be \lya nebulae lying within the redshift desert (i.e., ). Our spectroscopic follow-up confirms the power of using deep broad-band imaging to search for the bright end of the \lya nebula population across enormous comoving volumes.
Subject headings:
galaxies: formation — galaxies: evolution — galaxies: high-redshift — surveys1. Introduction
Giant radio-quiet \lya nebulae (also know as “\lya blobs”) provide a window into the physics of ongoing massive galaxy formation (e.g., Francis et al., 1996; Ivison et al., 1998; Steidel et al., 2000; Palunas et al., 2004; Matsuda et al., 2004; Dey et al., 2005; Saito et al., 2006; Nilsson et al., 2006; Smith & Jarvis, 2007; Prescott et al., 2009; Yang et al., 2009). Rare systems found primarily in overdense regions (Prescott et al., 2008; Matsuda et al., 2004, 2005, 2011; Saito et al., 2006; Yang et al., 2009, 2010), \lya nebulae are extremely luminous ( erg s-1) and are frequently associated with young, star-forming galaxy populations or obscured AGN (e.g., Basu-Zych & Scharf, 2004; Matsuda et al., 2004; Dey et al., 2005; Geach et al., 2007, 2009; Prescott et al., 2012b). Theoretical and observational investigations into the power source behind \lya nebulae have painted a varied picture, presenting arguments for AGN powering (Chapman et al., 2004; Basu-Zych & Scharf, 2004; Geach et al., 2007, 2009), starburst-driven winds (Taniguchi & Shioya, 2000; Taniguchi et al., 2001; Matsuda et al., 2004), spatially-extended star formation (Matsuda et al., 2007; Prescott et al., 2012b), cold accretion (Nilsson et al., 2006; Smith et al., 2008; Goerdt et al., 2010; Faucher-Giguère et al., 2010; Rosdahl & Blaizot, 2012), or some combination thereof (Dey et al., 2005; Prescott et al., 2009, 2012b; Webb et al., 2009; Colbert et al., 2011). Larger samples of giant radio-quiet \lya nebulae drawn from unbiased surveys are needed in order to accurately measure the space density of these sources, to determine the emission mechanisms primarily responsible for the \lya nebula class as a whole, and to understand their relationship to the more well-studied \lya haloes found around many high redshift radio galaxies (e.g., McCarthy 1993, and references therein; van Ojik et al. 1996; Weidinger et al. 2005; Miley et al. 2006; Barrio et al. 2008; Smith et al. 2009; Zirm et al. 2009).
Increasing the sample of such a rare class of objects requires surveying large comoving volumes, but the standard approach relying on narrow-band imaging is limited by observational expense. Our complementary approach was to design a new search technique using deep broad-band imaging (Prescott, 2009). We employed this method to select a sample of \lya nebula candidates from the Boötes Field of the NOAO Deep Wide-Field Survey (NDWFS; Jannuzi & Dey, 1999). A full presentation of our survey algorithm as well as the selection function of this approach and the implications for the space density of \lya nebulae can be found in companion papers (Prescott et al., 2012a, 2013, in preparation; hereafter, Papers I and III, respectively).
In this work (Paper II), we focus on the spectroscopic follow-up of \lya nebula candidates drawn from deep archival broad-band imaging of the NDWFS Boötes field. In Section 2, we give a brief outline of the survey design and candidate sample. In Section 3, we discuss our spectroscopic observations and reductions. Section 4 presents the 5 \lya nebulae discovered within this 8.5 square degree survey and discusses our primary contaminant sources, potentially an interesting population in their own right. Section 5 discusses the implications of this sample, and we conclude in Section 6.
We assume the standard CDM cosmology (, , ); 1″ corresponds to a physical scales of 8.3-7.8 kpc for redshifts of . All magnitudes are in the AB system (Oke, 1974).
2. Search Design
We have designed an innovative search for \lya nebulae in deep broad-band imaging and applied it to the NDWFS Boötes field (Paper I). Our search is most sensitive to the largest and brightest \lya nebulae because it leverages the deep blue () imaging of NDWFS to look for sources where bright \lya emission boosts the broad-band flux relative to the very dark sky. Thanks to the wide area (9 deg2) of the NDWFS and the large width of the filter (Å, corresponding to ), our survey is able to probe an enormous comoving volume (108 h Mpc3) with archival data and significantly reduce the required observational overhead. Our survey is therefore complementary to smaller volume surveys for \lya nebulae that rely on sensitive narrow-band imaging (e.g., Matsuda et al., 2004; Saito et al., 2006; Smith & Jarvis, 2007; Yang et al., 2009, 2010; Matsuda et al., 2011).
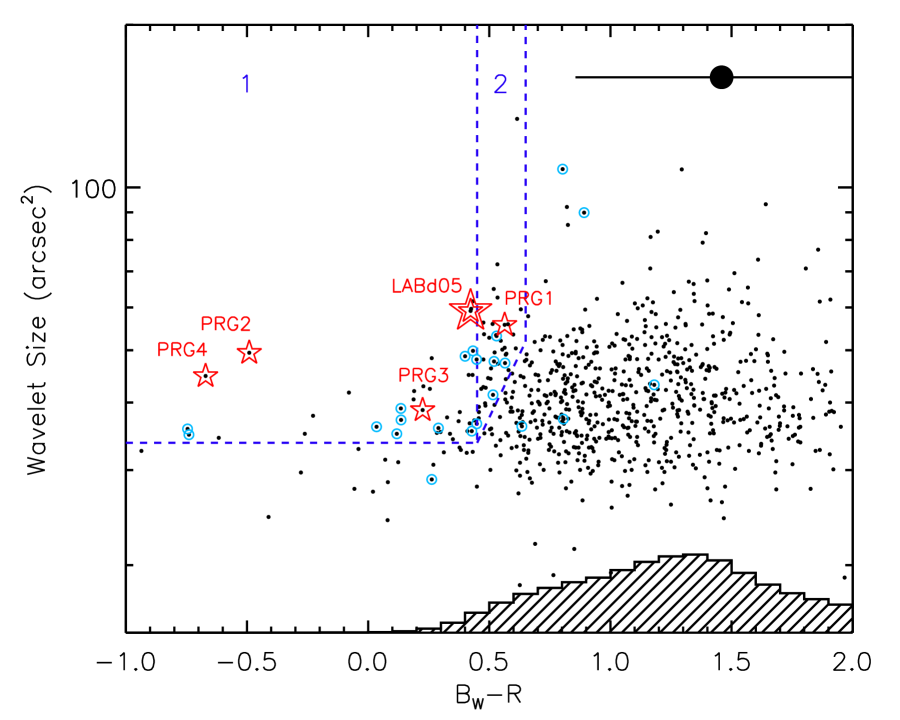
The search algorithm and candidate sample are discussed in detail in Paper I. In brief, we selected giant \lya nebula candidates using wavelet analysis of the compact-source-subtracted images. We selected a set of first and second priority candidates (Figure 1) based on their color, as measured using large 30 pix=7.7″ diameter apertures, and wavelet size, as determined using SourceExtractor (Bertin & Arnouts, 1996) on the wavelet-deconvolved images. The final candidate sample consisted of 39 first priority and 40 second priority sources over a search area of 8.5 square degrees. Both first and second priority samples contained candidates with diffuse morphologies (morphological category diffuse) as well as those that appear to be tight groupings of compact sources (morphological category group), as discussed in Paper I. In addition, we flagged 6 sources from outside these selection regions that showed promising morphologies (third priority).
3. Spectroscopic Follow-up
In this section we describe the spectroscopic follow-up of the \lya nebula candidate sample.
3.1. Observations & Reductions
We targeted a total of 26 Lya nebula candidates (15 first priority, 5 second priority, and all 6 third priority candidates). Longslit spectroscopic observations were obtained using the MMT and the Blue Channel Spectrograph during 2007 May, 2008 April and June (Table 1). The observations used the 300 l/mm grating with 10/15 wide slits resulting in a resolution FWHM of 2.6/3.4Å and a wavelength range of Å.
During our 2007 run, we chose slit orientations based primarily on the morphology of the candidate (i.e., aligned with the major axis of the emission as estimated from the -band morphology), and as a secondary criterion attempted to intersect a nearby bright reference object if possible. In practice, however, we found that the faintness of our candidates and the short duration of our spectroscopic exposures necessitated a positional reference. As a result, slit orientations during the 2008 runs were chosen to always include a positional reference object, and consequently do not always trace the major axis of the morphology. During these later runs, we dithered the target along the slit by between exposures to minimize the effect of any bad pixels. The full list of targeted candidates and the results of the spectroscopic observations are given in Table 2.
We reduced the spectroscopic data using IRAF.111IRAF is distributed by the National Optical Astronomy Observatories, which are operated by the Association of Universities for Research in Astronomy, Inc., under cooperative agreement with the National Science Foundation. We subtracted the overscan and bias, and applied a flat-field correction using normalized observations of the internal quartz flat-field lamps. Twilight flats were used to determine the illumination correction for the science frames. We removed cosmic rays from the 2D sky-subtracted data using xzap.222http://iraf.noao.edu/iraf/ftp/iraf/extern/xdimsum020627 One-dimensional spectra were generated using the task apall and optimal variance-weighted extraction (Valdes, 1992); the spectral trace was determined using bright unresolved sources on the slit. We determined the wavelength solution to an rms precision of 0.08-0.18Å using HeArNe and HgCd comparison lamps, and then corrected the data for any slight systematic offset using the night sky lines as a reference. The final wavelength calibration is accurate to 0.42Å. The relative flux calibration was based on observations of the standard stars BD+33 2642, BD+26 2606, BD+28 4211, Feige 34, and Wolf 1346.333KPNO IRS Standard Star Manual For each night, we applied a grey shift to compensate for any variable grey (i.e., independent of wavelength) extinction that may have affected a given standard star observation relative to one taken under better conditions. The sensitivity functions derived from individual standard star exposures were consistent to within 0.1 mag.
Due to the faintness of the candidates and the fact that we are searching for luminous \lya nebulae at , the aim of our follow-up spectroscopic program was to look for strong, high equivalent width line emission. A single strong line in the blue can be identified as \lya rather than an unresolved [Oii]3726,3729 doublet (the only other possibility at these wavelengths) due to the fact that a detection of [Oii] would be accompanied by stronger detections of [Oiii]4959,5007 and H as well. Candidates with strong \lya emission at in the -band are easily detectable with the MMT/Blue Channel down to a 5 limit of in 30 minutes (assuming a FWHMÅ \lya line measured within a 155″ aperture). This corresponds to limiting line luminosities of erg s-1, which are below the typical luminosities of giant \lya nebulae. However, continuum-only sources are much fainter and require longer integration times to yield high signal-to-noise ratio spectra, more than was available during our spectroscopic campaign. To allow us to target the largest number of candidates, we therefore carried out a quick reduction of the data in real-time and continued integrating on each of the 26 targeted candidates up until the point where we could either confirm the presence of a line or confirm the presence of continuum with no strong lines. The deeper spectroscopy necessary for studying the spectral properties of our confirmed \lya nebulae in detail as well as for detecting absorption features in continuum-only sources is left to future observations with larger telescopes.
4. Results
Of the 15 first priority and 5 second priority candidates targeted for spectroscopic follow-up, 4 first priority sources and 1 second priority source had confirmed \lya emission: we easily recovered the previously-discovered large \lya nebula at (LABd05; Dey et al., 2005) and discovered new, spatially-extended \lya nebulae at , , , and . In addition, we also targeted 6 third priority candidates that showed promising diffuse morphologies upon visual inspection. However, no \lya or [Oii] line emission was confirmed in any of the third priority candidates. In this section, we describe each of the confirmed sources in turn and then discuss the primary contaminants to our survey.
4.1. Confirmed \lya Sources
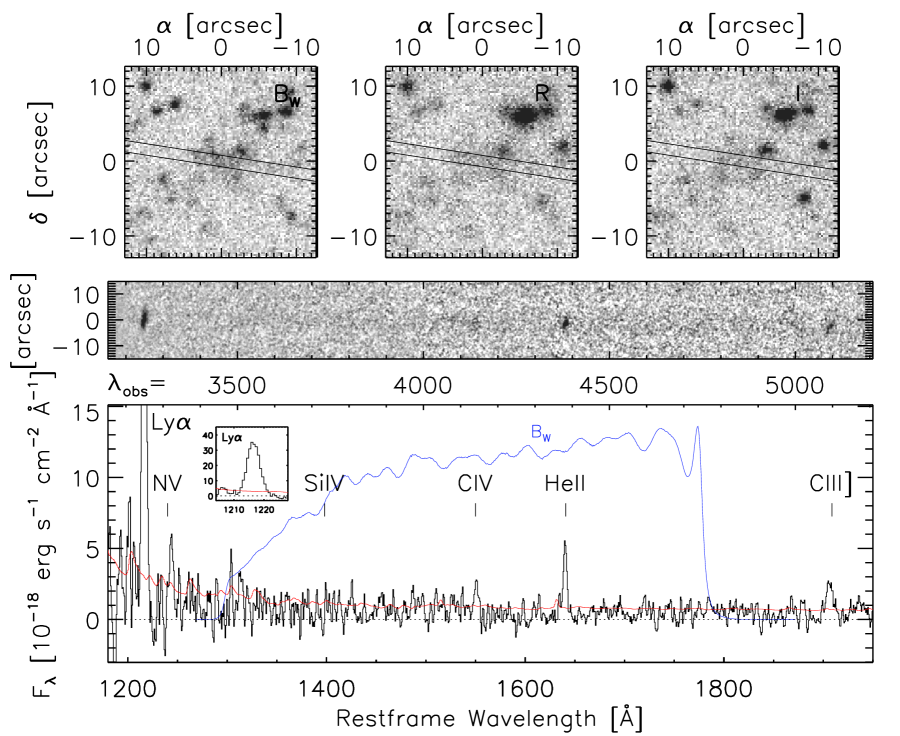
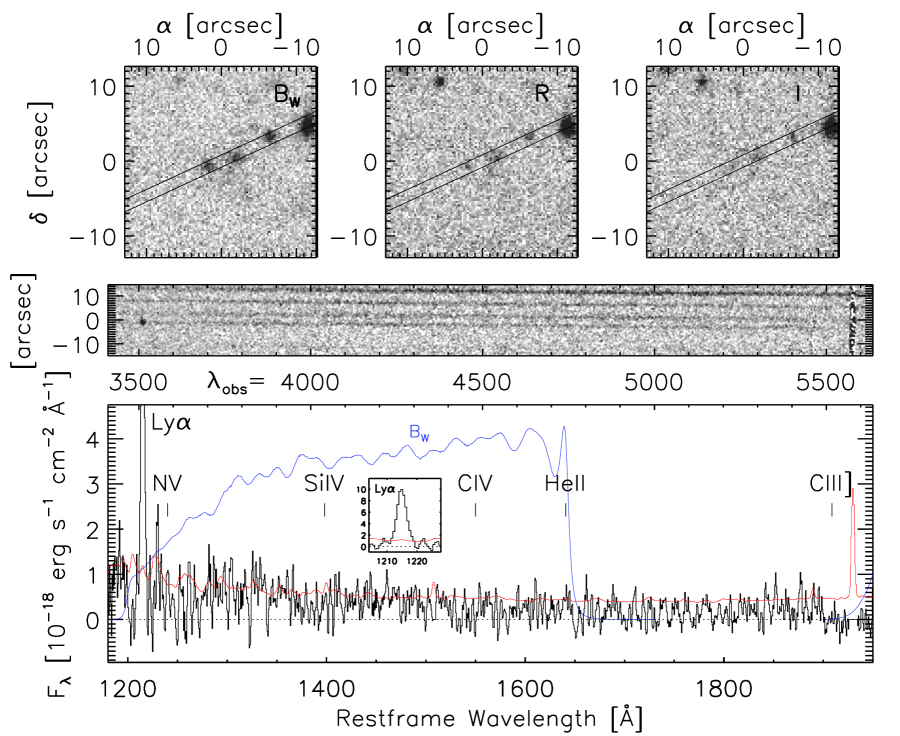
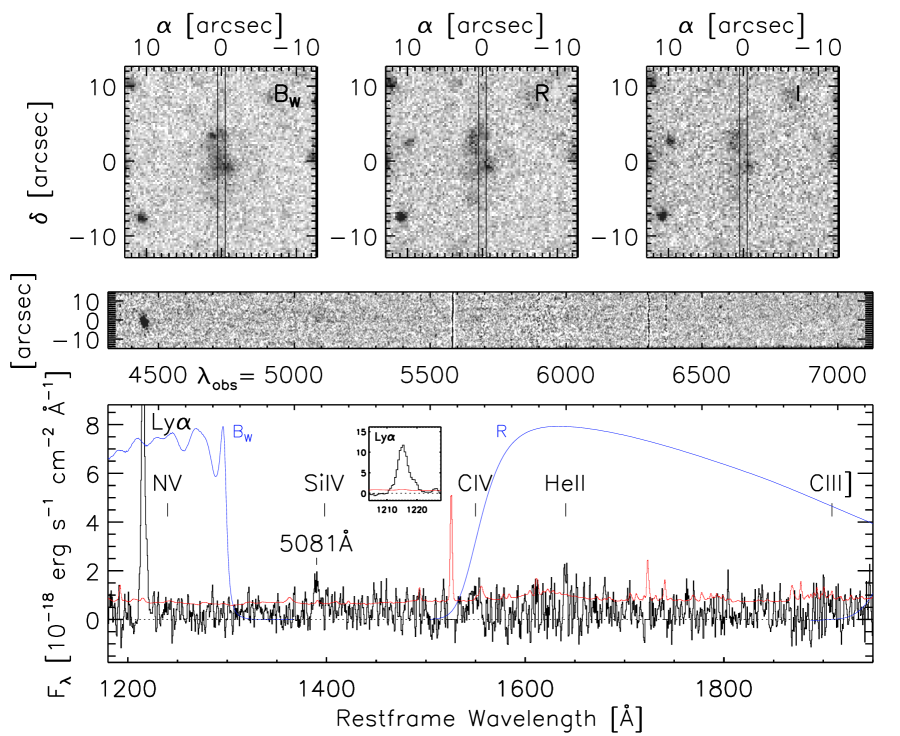
Figures 2-6 show the postage stamps, two-dimensional spectra, and one-dimensional spectra of the \lya sources; the measured properties are listed in Table 3. The spectral extraction apertures were chosen to maximize the signal-to-noise ratio of \lya. Redshifts were determined from the centroid of a Gaussian fit to the observed \lya line. No correction was included for \lya absorption, a potential source of bias in our redshift estimates. The sizes, isophotal areas, and surface brightnesses were measured above the median 1 surface brightness limit of the entire NDWFS survey from the original images using SourceExtractor (detect_minarea5, detect_thresh28.9 mag arcsec-2; Bertin & Arnouts, 1996). The \lya sizes were measured from the 2D spectra using SourceExtractor above the 1 surface brightness limit at the location of \lya (detect_minarea5, detect_thresh erg s-1 cm-2 Å-1 arcsec-2; see Table 3). The sizes along the slit can underestimate the \lya sizes measured from the 2D spectra; in the case of PRG3, our deepest spectrum, the size underestimates the \lya size by a factor of 1.3.
Estimates for the total \lya isophotal area and total \lya luminosity are also given in Table 3. The approximate total \lya isophotal area was estimated by correcting by a factor of , where is the isophotal area of the source on the image and is the ratio of the \lya and sizes measured along the slit. The approximate total \lya luminosity was derived by scaling the \lya luminosity within the spectroscopic aperture by the geometric correction factor , where is the slit width and is the spatial extent of the spectral extraction aperture. We stress, however, that in using area corrections based on broad-band imaging we are relying on the assumptions that the emission roughly traces the \lya emission in the source and that the relative factor between the and \lya sizes is the same throughout the object as it is along the slit; either of these assumptions may be violated in practice.
In what follows, we discuss each confirmed \lya source in detail. Of the confirmed \lya nebulae, four were originally categorized as having a diffuse morphology while one (PRG4) was categorized as having a group morphology (see Paper I).
4.1.1 PRG1
PRG1 is a remarkable \lya nebula (Figure 2). As discussed in Prescott et al. (2009), it is the first example of a \lya nebula with strong, spatially-extended Heii emission and weak metal lines, suggestive of a hard ionizing continuum and potentially low metallicity gas. The imaging shows a diffuse nebula and several compact sources, the brightest of which is located at the northwest edge of the nebula. Despite the strong \lya emission and large size (78 kpc), PRG1 was selected as a second priority candidate because, at , \lya is at the edge of the optical window and not contained within the band, giving the source a relatively red color. Thanks to its diffuse blue continuum (95%) and Heii emission (5%), however, this source was still selected by our survey. When first discovered, this source was the lowest redshift \lya nebula known and the only one that shows strong spatially-extended Heii emission; PRG1 is therefore an ideal target for detailed study of the physical conditions and kinematics within \lya nebulae. Analysis of the metallicity and source of ionization in PRG1 is given in Prescott et al. (2009), and more detailed analysis using deep Keck/LRIS spectroscopy is in progress (Prescott et al., in preparation).
4.1.2 PRG2
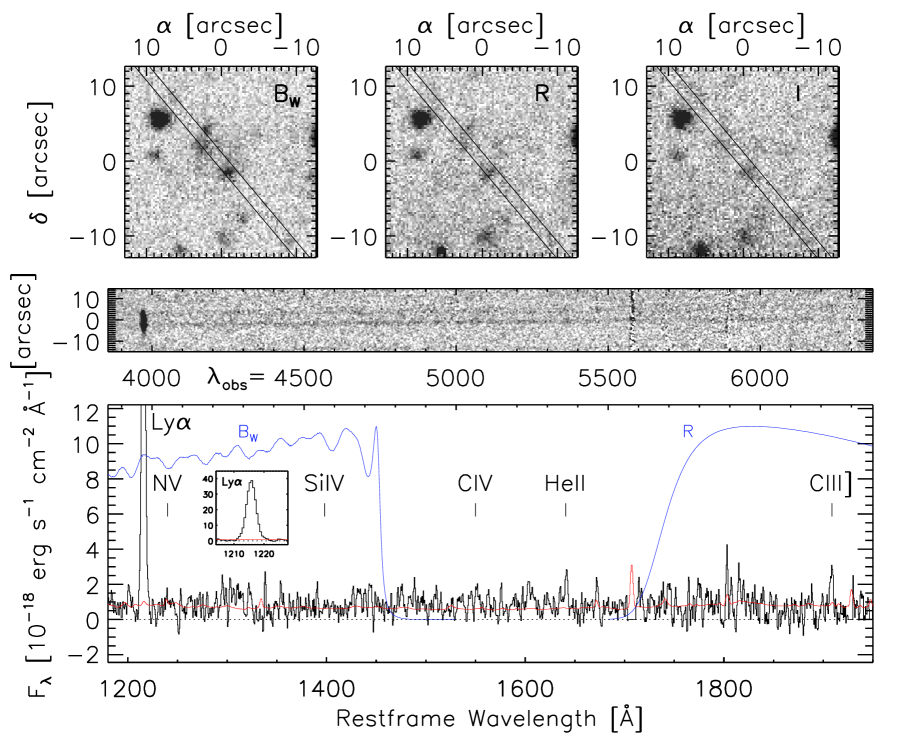
PRG2 is a large \lya nebula at with a roughly diamond-shaped morphology in the image (Figure 3). The identification of the strong line in the spectrum as \lya is secure based on the fact that no other lines are well-detected in the discovery spectrum and corroborated by weak detections at the positions of Civ1548,1550, Heii1640, and Ciii]1909. In the case of [Oii] at lower redshift, we would have easily detected [Oiii] and H instead. The \lya nebula spans almost 100 kpc, and at the southwestern corner there is a very blue compact source that appears to be a \lya-emitting galaxy from the spectrum. The redshift of this source is ideal for follow-up NIR spectroscopy as the rest-frame optical emission lines ([Oii], [Oiii], H, and H) will be observable in the , , and bands. Continuum emission is observed from two compact knots located at either end and from spatially-extended emission at fainter levels in between them.
4.1.3 PRG3
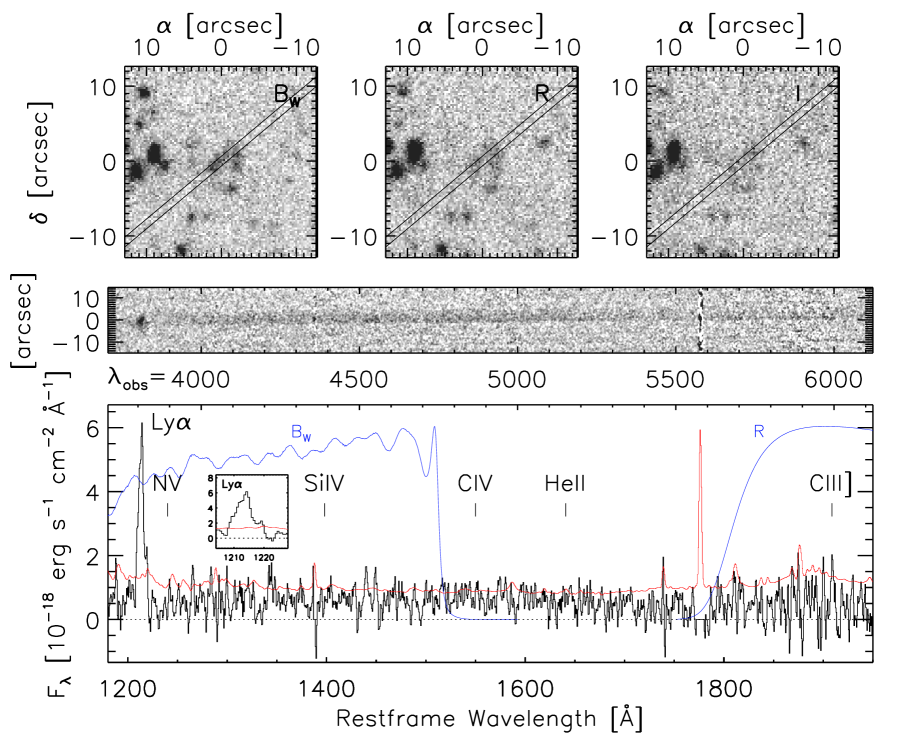
PRG3 is a \lya nebula at (Figure 4). It has a rather clumpy horseshoe-shaped morphology in the imaging and spans 74 kpc. The single strong line is identified as \lya rather than [Oii] based on the fact that we do not see corresponding detections of [Oiii] and H. The spectrum shows spatially-extended continuum, but no other strong emission lines.
4.1.4 PRG4
PRG4 appears to be a candidate that was selected due to a close grouping of compact blue sources (Figure 5). Due to the very blue color, it was flagged as a high priority target. At these wavelengths (blueward of the restframe wavelength of [Oii]), \lya is the only possible strong line. In addition, no other strong lines are seen in the spectrum. Although the size of the full grouping is roughly 7″, the observed \lya at is only marginally extended along the direction of the spectroscopic slit (3.9″, 33 kpc). The source may be larger in \lya: there is additional diffuse emission outside the slit that is visible to the southwest in the imaging, but without further spectroscopy, we cannot determine if it is associated with coincident \lya emission.
4.1.5 LABd05
LABd05 is the source that was the inspiration for our broad-band \lya nebula search (Figure 6; Dey et al., 2005). One of the largest \lya nebulae known ( kpc; Dey et al., 2005), it is located at . Our shallow MMT spectrum was taken at a slightly different position than the existing deeper spectroscopy from Keck but shows a hint of Heii emission and an emission line at 5081Å, both seen previously in the system (Dey et al., 2005). The emission line at 5081Å is thought to be \lya from a background interloper galaxy at , the compact source that is visible in the ground-based imaging and located at the western edge of the slit for this observation. Detailed study of ground-based data as well as high resolution imaging from HST showed that there are numerous compact galaxies, including a spectroscopically-confirmed Lyman break galaxy, within the system that are offset spatially from the \lya nebula itself (Dey et al., 2005; Prescott et al., 2012b). The HST imaging demonstrated that the nebula contains diffuse restframe UV continuum emission, that the \lya emission itself is smooth with a relatively round and disk-like morphology, and that the Heii emission is spatially extended by ″ ( kpc; Prescott et al., 2012b).
4.2. Survey Contaminants
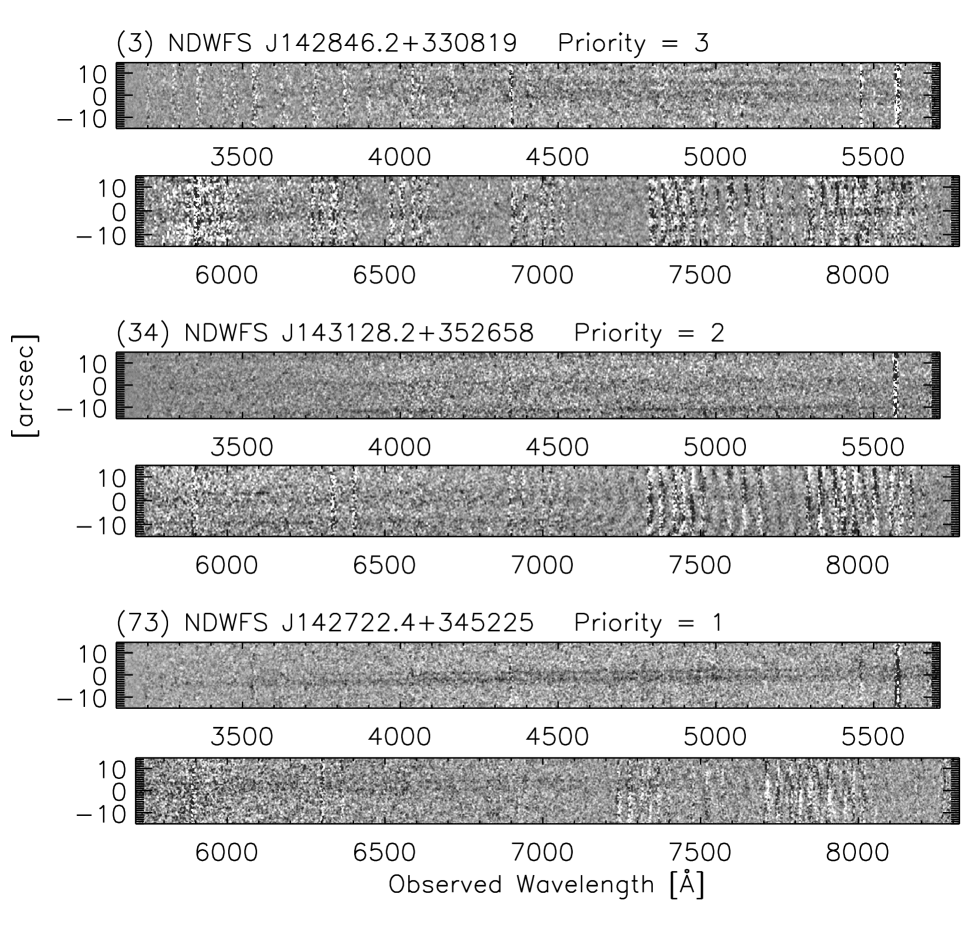
The dominant contaminants in both the first and second priority spectroscopic samples are sources with spatially resolved blue continuum emission but no visible emission lines. Despite the lack of strong line emission in the band, our morphological broad-band search selected these sources either due to sufficiently extended, blue continuum emission or due to a close projected grouping of blue galaxies. A few examples of these continuum-only sources are shown in Figure 7.
Without deeper spectroscopy, we can only speculate as to the nature of these continuum-only sources. The largest cases within the candidate sample (sources 1+2 and 3; Paper I) are so spatially extended (15-86″, which at would imply physical sizes of kpc in the continuum) and irregular in morphology that they are almost certainly located within the Galaxy, perhaps low surface brightness Galactic reflection nebulae. Since low redshift () blue star-forming populations or low surface brightness galaxies (LSBs) would be expected to show [Oii], [Oiii], or H emission lines in our spectra, some fraction of the remaining continuum-only contaminants may in fact be galaxies or \lya nebulae in the redshift desert (), for which \lya is blueward of the atmospheric cut-off (Å) but for which [Oii] has been redshifted past the red end of our MMT/Blue Channel spectra (Å). One of the \lya nebulae confirmed by our survey (PRG1, at ) is in fact below the redshift where \lya is covered by the -band. Instead, this source was selected by our survey primarily due to blue continuum emission, and it was only thanks to the excellent blue sensitivity of MMT/Blue Channel that we were still able to detect the \lya emission at 3250Å. The case of PRG1 lends credence to the hypothesis that at least a fraction of the continuum-only “contaminant” sources are in fact \lya nebulae at .
At the same time, however, our expectation from Paper I was that \lya nebulae in the redshift desert should make up roughly 25% of the candidate sample, under the optimistic assumption that the \lya nebula number density does not evolve significantly with redshift. In practice, we found continuum-only detections represented a much larger fraction (75%) of the target spectroscopic sample, suggesting that this explanation may not be the full story. While the presence of continuum emission in the spectra does confirm that these continuum-only sources are indeed real astrophysical objects and not artifacts within the NDWFS imaging, deeper ground-based optical spectroscopy or UV spectroscopy from space will be required to confirm their origin on a case by case basis. At this stage, their nature remains mysterious.
5. Discussion
5.1. A Successful Broad-band \lya Nebula Survey
This work is the first demonstration of the feasibility of conducting systematic surveys for large \lya nebulae using deep broad-band imaging datasets. The primary advantage of our unusual survey approach is the enormous comoving volume that can be surveyed using deep archival datasets. In addition, since this search technique is best used in the blue where the sky is dark, the resulting \lya nebula sample is weighted to lower redshifts () where we have the opportunity to undertake detailed studies of their properties. The obvious trade-off is that our approach is not as sensitive to \lya nebulae that are intrinsically faint, low surface-brightness, or compact in morphology, as discussed in Papers I and III. Our search, therefore, provides a measurement of the bright end of the \lya nebula luminosity function, nicely complementing standard narrow-band surveys that probe to fainter luminosities.
The success rate for finding sources with \lya emission was % for first priority and % for second priority candidates. Therefore, if we were able to target all the \lya nebula candidates in our sample, we would expect to find a total of \lya nebulae ( and from the first and second priority set, respectively). While one of the goals of our broad-band survey for \lya nebulae is to place constraints on the space density of these rare objects, a robust estimate of the space density requires a detailed analysis of the selection function and is beyond the scope of the present paper. Here, we briefly discuss our detection rate in the context of traditional narrowband \lya nebula surveys.
Based on the results of the narrowband survey carried out at by Yang et al. (2009), in Paper I we estimated the expected number of \lya nebulae in our survey volume to be 60-400, assuming a 100% detection rate, the same detection limit as Yang et al. (2009), and a constant volume density as a function of redshift. Instead, we have confirmed 5 \lya nebulae, and scaling these results to the unobserved candidates, we expect to find only 18. While this estimate is extremely crude, it does suggest that the space density of the detected \lya nebulae in our sample is lower than that of the Yang et al. (2009) sample. Possible reasons for this difference are that (a) the Yang et al. (2009) narrow-band survey is more sensitive to fainter, and therefore less luminous, \lya nebulae than our broad-band survey; (b) the Yang et al. (2009) survey does not exclude \lya nebulae with bright central sources whereas our survey does due to the nature of the morphological search algorithm; and/or (c) the Yang et al. (2009) survey is more sensitive to cosmic variance than our larger volume survey. We defer a more detailed discussion of the space density of \lya nebulae implied by our survey to Paper III.
5.2. Dispersion within the \lya Nebula Class
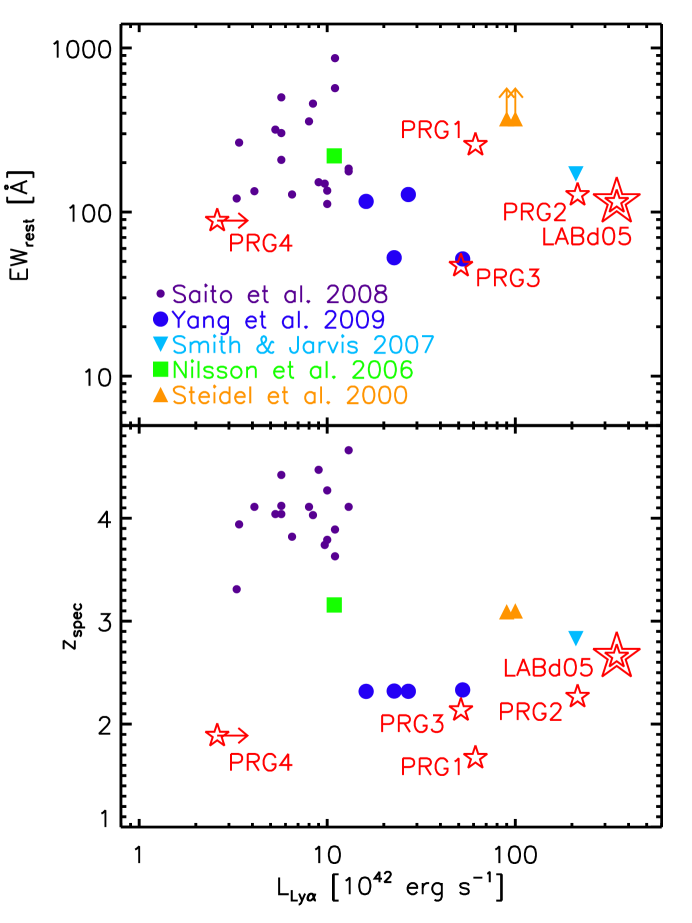
The power of a systematic survey is the opportunity it provides to find out what is common among a class of objects and also what the dispersion in properties is among members of that class. The four large cases in our sample (PRG1, PRG2, PRG3, LABd05) span nearly an order of magnitude in total \lya luminosity ( erg s-1), show a range of \lya equivalent widths (Å), and are at least kpc in diameter. Morphologically, the four large \lya nebulae all show clumps and knots of emission in the broad-band imaging. The brightest compact knot in PRG1 is very red while that in PRG2 is remarkably blue. In addition, all four show what appears to be diffuse continuum emission in the ground-based spectroscopy. This could either be due to many unresolved clumps, or due to a continuum component that is truly spatially extended. Analysis of HST imaging of one system (LABd05) lends support to the latter hypothesis, revealing that most of the continuum in this one source is unresolved even at high resolution (0.1″; Prescott et al., 2012b). In three cases (PRG1, PRG2, LABd05) there is evidence for emission in other lines (e.g., Civ, Heii, or Ciii]).
Given that diffuse continuum emission will have a larger impact on the observed broad-band color than line emission, one might ask if our survey is biased towards finding lower equivalent width sources than narrow-band surveys. In fact, however, Figure 8 shows that our survey uncovered \lya nebulae with rest-frame equivalent widths comparable to those of luminous \lya nebulae found using standard narrow-band surveys but over a much larger redshift range.
6. Conclusions
We have carried out an innovative and economical systematic search for large \lya nebulae using archival deep, broad-band data. While our technique is only sensitive to the largest and brightest \lya nebulae, it is able to probe enormous comoving volumes ( h Mpc3) using existing deep broad-band datasets. The details of our search algorithm, the selection function, and implied space density are discussed in Papers I and III of this series. In this paper (Paper II), we presented details of our spectroscopic follow-up of \lya nebula candidates. Within our 8.5 square degree survey area and a redshift range of , we confirmed 4 new \lya nebulae and recovered 1 previously known case. The brightest 4 \lya nebulae have \lya luminosities of erg s-1 and sizes of 70 kpc. Our broad-band search found \lya nebulae with large \lya luminosities and equivalent widths comparable to those found with narrow-band surveys, but revealed a new common theme: at least some large \lya nebulae show diffuse, spatially-extended continuum emission. The primary contaminants in our survey are sources that show nothing but blue continuum in the optical range, some of which we suspect may be galaxies or \lya nebulae located in the redshift desert. Deep continuum spectroscopy and comparisons to GALEX photometry will be required to confirm this claim. This work uncovered the first example of a giant \lya nebula at and has demonstrated the feasibility of using deep broad-band datasets to efficiently locate luminous \lya nebulae within enormous comoving volumes.
References
- Barrio et al. (2008) Barrio, F. E., et al. 2008, Monthly Notices of the Royal Astronomical Society, 389, 792
- Basu-Zych & Scharf (2004) Basu-Zych, A., & Scharf, C. 2004, The Astrophysical Journal, 615, L85
- Bertin & Arnouts (1996) Bertin, E., & Arnouts, S. 1996, Astronomy and Astrophysics Supplement, 117, 393
- Chapman et al. (2004) Chapman, S. C., Scott, D., Windhorst, R. A., Frayer, D. T., Borys, C., Lewis, G. F., & Ivison, R. J. 2004, The Astrophysical Journal, 606, 85
- Colbert et al. (2011) Colbert, J. W., Scarlata, C., Teplitz, H., Francis, P., Palunas, P., Williger, G. M., & Woodgate, B. 2011, The Astrophysical Journal, 728, 59
- Dey et al. (2005) Dey, A., et al. 2005, The Astrophysical Journal, 629, 654
- Faucher-Giguère et al. (2010) Faucher-Giguère, C.-A., Kereš, D., Dijkstra, M., Hernquist, L., & Zaldarriaga, M. 2010, The Astrophysical Journal, 725, 633
- Francis et al. (1996) Francis, P. J., et al. 1996, The Astrophysical Journal, 457, 490
- Geach et al. (2007) Geach, J. E., Smail, I., Chapman, S. C., Alexander, D. M., Blain, A. W., Stott, J. P., & Ivison, R. J. 2007, The Astrophysical Journal, 655, L9
- Geach et al. (2009) Geach, J. E., et al. 2009, The Astrophysical Journal, 700, 1
- Goerdt et al. (2010) Goerdt, T., Dekel, A., Sternberg, A., Ceverino, D., Teyssier, R., & Primack, J. R. 2010, Monthly Notices of the Royal Astronomical Society, 407, 613
- Haberzettl et al. (2007) Haberzettl, L., Bomans, D. J., Dettmar, R.-J., & Pohlen, M. 2007, Astronomy and Astrophysics, 465, 95
- Ivison et al. (1998) Ivison, R. J., Smail, I., Le Borgne, J.-F., Blain, A. W., Kneib, J.-P., Bezecourt, J., Kerr, T. H., & Davies, J. K. 1998, Monthly Notices of the Royal Astronomical Society, 298, 583
- Jannuzi & Dey (1999) Jannuzi, B. T., & Dey, A. 1999, in Photometric Redshifts and the Detection of High Redshift Galaxies, ed. R. Weymann, R., Storrie-Lombardi, L., Sawicki, M., & Brunner, Vol. 191 (Astronomical Society of the Pacific Conference Series), 111
- Matsuda et al. (2007) Matsuda, Y., Iono, D., Ohta, K., Yamada, T., Kawabe, R., Hayashino, T., Peck, A. B., & Petitpas, G. R. 2007, The Astrophysical Journal, 667, 667
- Matsuda et al. (2004) Matsuda, Y., et al. 2004, The Astronomical Journal, 128, 569
- Matsuda et al. (2005) Matsuda, Y., et al. 2005, The Astrophysical Journal, 634, L125
- Matsuda et al. (2011) Matsuda, Y., et al. 2011, Monthly Notices of the Royal Astronomical Society: Letters, 410, L13
- McCarthy (1993) McCarthy, P. J. 1993, Annual Review of Astronomy and Astrophysics, 31, 639
- Miley et al. (2006) Miley, G. K., et al. 2006, The Astrophysical Journal, 650, L29
- Nilsson et al. (2006) Nilsson, K. K., Fynbo, J. P. U., Mø ller, P., Sommer-Larsen, J., & Ledoux, C. 2006, Astronomy and Astrophysics, 452, L23
- Oke (1974) Oke, J. B. 1974, The Astrophysical Journal Supplement Series, 27, 21
- Palunas et al. (2004) Palunas, P., Teplitz, H. I., Francis, P. J., Williger, G. M., & Woodgate, B. E. 2004, The Astrophysical Journal, 602, 545
- Prescott (2009) Prescott, M. K. M. 2009, Phd, University of Arizona
- Prescott et al. (2009) Prescott, M. K. M., Dey, A., & Jannuzi, B. T. 2009, The Astrophysical Journal, 702, 554
- Prescott et al. (2012a) Prescott, M. K. M., Dey, A., & Jannuzi, B. T. 2012a, The Astrophysical Journal, 748, 125
- Prescott et al. (2008) Prescott, M. K. M., Kashikawa, N., Dey, A., & Matsuda, Y. 2008, The Astrophysical Journal, 678, L77
- Prescott et al. (2012b) Prescott, M. K. M., et al. 2012b, The Astrophysical Journal, 752, 86
- Rosdahl & Blaizot (2012) Rosdahl, J., & Blaizot, J. 2012, Monthly Notices of the Royal Astronomical Society, 423, 344
- Saito et al. (2006) Saito, T., Shimasaku, K., Okamura, S., Ouchi, M., Akiyama, M., & Yoshida, M. 2006, The Astrophysical Journal, 648, 54
- Saito et al. (2008) Saito, T., Shimasaku, K., Okamura, S., Ouchi, M., Akiyama, M., Yoshida, M., & Ueda, Y. 2008, The Astrophysical Journal, 675, 1076
- Smith & Jarvis (2007) Smith, D. J. B., & Jarvis, M. J. 2007, Monthly Notices of the Royal Astronomical Society: Letters, 378, L49
- Smith et al. (2008) Smith, D. J. B., Jarvis, M. J., Lacy, M., & Martínez-Sansigre, A. 2008, Monthly Notices of the Royal Astronomical Society, 389, 799
- Smith et al. (2009) Smith, D. J. B., Jarvis, M. J., Simpson, C., & Martínez-Sansigre, A. 2009, Monthly Notices of the Royal Astronomical Society, 393, 309
- Steidel et al. (2000) Steidel, C. C., Adelberger, K. L., Shapley, A. E., Pettini, M., Dickinson, M., & Giavalisco, M. 2000, The Astrophysical Journal, 532, 170
- Taniguchi & Shioya (2000) Taniguchi, Y., & Shioya, Y. 2000, The Astrophysical Journal, 532, L13
- Taniguchi et al. (2001) Taniguchi, Y., Shioya, Y., & Kakazu, Y. 2001, The Astrophysical Journal, 562, L15
- Valdes (1992) Valdes, F. 1992, Astronomical Data Analysis Software and Systems I, 25
- van Ojik et al. (1996) van Ojik, R., Roettgering, H. J. A., Carilli, C. L., Miley, G. K., Bremer, M. N., & Macchetto, F. 1996, Astronomy and Astrophysics
- Webb et al. (2009) Webb, T. M. A., Yamada, T., Huang, J.-S., Ashby, M. L. N., Matsuda, Y., Egami, E., Gonzalez, M., & Hayashimo, T. 2009, The Astrophysical Journal, 692, 1561
- Weidinger et al. (2005) Weidinger, M., Mø ller, P., Fynbo, J. P. U., & Thomsen, B. 2005, Astronomy and Astrophysics, 436, 825
- Yang et al. (2010) Yang, Y., Zabludoff, A., Eisenstein, D., & Davé, R. 2010, The Astrophysical Journal, 719, 1654
- Yang et al. (2009) Yang, Y., Zabludoff, A., Tremonti, C., Eisenstein, D., & Davé, R. 2009, The Astrophysical Journal, 693, 1579
- Zirm et al. (2009) Zirm, A. W., Dey, A., Dickinson, M., & Norman, C. J. 2009, The Astrophysical Journal, 694, L31
| UT Date | Instrumental ResolutionaaQuoted instrumental resolution is the average of measurements of the Hg i4047, Hg i4358, Hg i5461, and O i5577 sky lines. | Unvignetted Slit | Spatial Binning | Seeing | Conditions |
|---|---|---|---|---|---|
| (arcsec) | (Å) | (arcsec/pixel) | (arcsec) | ||
| 2007 May 20 | 2.6 | 1.0120 | 0.56 | 1.0-1.2 | Clear, high winds |
| 2007 May 21 | 2.6 | 1.0120 | 0.56 | 1.0-1.2 | Clear, high winds |
| 2007 May 22 | 3.4 | 1.5120 | 0.56 | 1.3-1.7 | Clear, high winds |
| 2008 April 3 | 3.4 | 1.5120 | 0.28 | 1.0 | Mostly clear |
| 2008 April 30 | 3.4 | 1.5120 | 0.28 | 1.2-1.9 | Clear, high winds |
| 2008 June 8 | 3.4 | 1.5120 | 0.28 | 1.0 | Clear |
| 2008 June 9 | 3.4 | 1.5120 | 0.28 | 1.1-2.0 | Clear, high winds |
| Candidate Name | Right Ascension | Declination | Priority | UT Date | Exposure | ClassaaSpectroscopic targets were classified as either showing “\lya” or “Continuum” emission. | Notes | |
|---|---|---|---|---|---|---|---|---|
| (hours) | (degrees) | Time (s) | ||||||
| (2) | NDWFS J143006.9+353437 | 14:30:06.864 | 35:34:36.73 | 3 | 2007 May 20-21 | 2400 | Continuum | Galactic? |
| (3) | NDWFS J142846.2+330819 | 14:28:46.228 | 33:08:19.42 | 3 | 2007 May 20-21 | 10800 | Continuum | Galactic? |
| (10) | NDWFS J143411.0+331731 | 14:34:10.975 | 33:17:31.26 | 1 | 2007 May 20 | 1800 | \lya | LABd05 |
| (14) | NDWFS J143512.3+351109 | 14:35:12.336 | 35:11:08.62 | 2 | 2008 Jun 8-9 | 7200 | \lya | PRG1 |
| (18) | NDWFS J143222.8+324943 | 14:32:22.768 | 32:49:42.67 | 2 | 2008 Jun 8 | 1800 | Continuum | - |
| (24) | NDWFS J142614.7+344434 | 14:26:14.714 | 34:44:34.22 | 1 | 2008 Jun 8 | 3600 | Continuum | - |
| (26) | NDWFS J142622.9+351422 | 14:26:22.905 | 35:14:22.02 | 1 | 2008 Apr 3 | 3600 | \lya | PRG2 |
| (29) | NDWFS J142526.3+335112 | 14:25:26.332 | 33:51:12.16 | 1 | 2008 Jun 9 | 3600 | Continuum | - |
| (31) | NDWFS J142547.1+334454 | 14:25:47.126 | 33:44:54.13 | 1 | 2008 Apr 30 | 2400 | Continuum | - |
| (33) | NDWFS J142714.8+343155 | 14:27:14.791 | 34:31:54.55 | 2 | 2008 Jun 8 | 1800 | Continuum | - |
| (34) | NDWFS J143128.2+352658 | 14:31:28.245 | 35:26:57.91 | 2 | 2007 May 22 | 5400 | Continuum | - |
| (40) | NDWFS J142653.2+343855 | 14:26:53.172 | 34:38:55.39 | 1 | 2008 Apr 30 | 3600 | \lya | PRG4 |
| (44) | NDWFS J142927.8+345906 | 14:29:27.837 | 34:59:06.14 | 3 | 2007 May 21 | 3600 | Continuum | - |
| (52) | NDWFS J143706.6+335653 | 14:37:06.588 | 33:56:52.65 | 2 | 2007 May 20-21 | 4800 | Continuum | - |
| (58) | NDWFS J142516.6+324335 | 14:25:16.629 | 32:43:35.47 | 1 | 2008 Jun 8 | 3600 | Continuum | - |
| (59) | NDWFS J143412.7+332939 | 14:34:12.722 | 33:29:39.19 | 1 | 2008 May 20 | 10800 | \lya | PRG3 |
| (65) | NDWFS J143207.2+343101 | 14:32:07.224 | 34:31:01.34 | 3 | 2007 May 22 | 3600 | Continuum | - |
| (66) | NDWFS J142539.9+344959 | 14:25:39.859 | 34:49:59.19 | 1 | 2008 Jun 8 | 3600 | Continuum | - |
| (70) | NDWFS J142753.8+341204 | 14:27:53.762 | 34:12:04.10 | 1 | 2007 May 20-21 | 8400 | Continuum | - |
| (71) | NDWFS J142600.8+350252 | 14:26:00.842 | 35:02:52.36 | 3 | 2008 Apr 3 | 3600 | Continuum | - |
| (72) | NDWFS J142643.9+340937 | 14:26:43.850 | 34:09:36.82 | 1 | 2008 Jun 9 | 3600 | Continuum | - |
| (73) | NDWFS J142722.4+345225 | 14:27:22.408 | 34:52:24.74 | 1 | 2008 Apr 3 | 3600 | Continuum | - |
| (74) | NDWFS J142620.0+340427 | 14:26:19.982 | 34:04:27.01 | 1 | 2008 Apr 30 | 2400 | Continuum | - |
| (80) | NDWFS J142548.3+322957 | 14:25:48.283 | 32:29:56.58 | 1 | 2008 Jun 9 | 3600 | Continuum | - |
| (82) | NDWFS J142449.8+324743 | 14:24:49.761 | 32:47:42.61 | 1 | 2008 Apr 30 | 3600 | Continuum | - |
| (85) | NDWFS J142533.0+343912 | 14:25:32.966 | 34:39:11.95 | 3 | 2008 Apr 3 | 3600 | Continuum | - |
| PRG1 | PRG2 | PRG3 | PRG4 | LABd05 | |
|---|---|---|---|---|---|
| Aperture (arcsec) | 1.5 5.04 | 1.5 7.84 | 1.0 5.60 | 1.5 1.68 | 1.0 4.48 |
| (Å) | 3249.61 0.39 | 3971.41 0.13 | 3813.28 0.90 | 3511.23 0.67 | 4444.99 0.31 |
| Redshift | 1.6731 0.0003 | 2.2668 0.0001 | 2.1368 0.0007 | 1.8883 0.0005 | 2.6564 0.0003 |
| (10-17 erg s-1 cm-2) | 44.1 4.0 | 49.2 1.1 | 10.2 1.2 | 10.3 1.2 | 19.0 0.9 |
| (1042 erg s-1) | 8.2 0.7 | 19.3 0.4 | 3.5 0.4 | 2.6 0.3 | 10.9 0.5 |
| \lya EWrest (Å) | 257.1 29.1 | 127.3 6.3 | 47.1 6.4 | 88.7 11.8 | 115.5 9.5 |
| \lya FWHMobs (Å) | 9.19 0.60 | 8.52 0.19 | 23.36 7.90 | 6.51 0.89 | 15.44 0.70 |
| \lya (km s-1) | 361.2 23.7 | 273.9 6.1 | 782.1 264.3 | 236.8 32.2 | 443.3 20.0 |
| (10-17 erg s-1 cm-2)aaLine flux upper limits are 2 values. | 2.1 1.1 | 1.8 0.8 | 0.8 | 0.8 | 5.4 |
| (10-17 erg s-1 cm-2)aaLine flux upper limits are 2 values. | 5.8 1.0 | 1.8 0.9 | 0.9 | 0.7 0.5 | 1.4 1.3 |
| (10-17 erg s-1 cm-2)aaLine flux upper limits are 2 values. | 4.8 0.9 | 3.0 1.1 | 1.5 | 1.4 | 1.8 |
| Diameter Along Slitbb sizes, isophotal areas, and surface brightnesses measured from the NDWFS imaging using SourceExtractor with a detection threshold of 28.9 mag arcsec-2, the median 1 surface brightness limit of NDWFS. (arcsec) | 8.96 | 10.12 | 6.72 | 6.75 | 9.32 |
| Isophotal Areabb sizes, isophotal areas, and surface brightnesses measured from the NDWFS imaging using SourceExtractor with a detection threshold of 28.9 mag arcsec-2, the median 1 surface brightness limit of NDWFS. (arcsec2) | 40.9 | 73.2 | 45.3 | 38.7 | 54.4 |
| Surface Brightnessbb sizes, isophotal areas, and surface brightnesses measured from the NDWFS imaging using SourceExtractor with a detection threshold of 28.9 mag arcsec-2, the median 1 surface brightness limit of NDWFS. (mag arcsec-2) | 27.2 | 27.0 | 26.8 | 27.0 | 27.0 |
| \lya Diameter Along Slitcc\lya sizes measured from the 2D spectra using SourceExtractor with detection thresholds of [2.5, 1.0, 0.8, 2.1, 1.5] erg s-1 cm-2 Å-1 arcsec-2, the respective 1 line surface brightness limits at the position of \lya. (arcsec) | 9.24 | 12.04 | 8.96 | 3.92 | 8.96 |
| \lya Diameter Along Slitcc\lya sizes measured from the 2D spectra using SourceExtractor with detection thresholds of [2.5, 1.0, 0.8, 2.1, 1.5] erg s-1 cm-2 Å-1 arcsec-2, the respective 1 line surface brightness limits at the position of \lya. (kpc) | 78.3 | 99.0 | 74.4 | 33.0 | 71.3 |
| Approximate \lya Isophotal AreaddApproximate \lya isophotoal area computed by correcting the isophotal area by a factor of , where is the ratio of the \lya and diameters measured along the slit. (arcsec2) | 43.4 | 103.7 | 80.4 | 5.9ffAs the emission is not an accurate tracer of the \lya emission in PRG4, approximate luminosity and area estimates have been replaced with lower limits derived from the spectroscopic data alone. | 50.3 |
| Approximate Total eeApproximate total \lya luminosity computed by scaling the \lya luminosity measured within the spectroscopic aperture by a geometric correction factor of , where is the isophotal area of the source on the image, is the ratio of the \lya and diameters measured along the slit, is the slit width, and is the spatial extent of the spectral extraction aperture. (1042 erg s-1) | 47.2 4.3 | 170.2 3.7 | 49.6 6.1 | 2.6ffAs the emission is not an accurate tracer of the \lya emission in PRG4, approximate luminosity and area estimates have been replaced with lower limits derived from the spectroscopic data alone. | 122.8 6.0 |