Efficiency vs. multi-photon contribution test for quantum dots
Abstract
The development of linear quantum computing within integrated circuits demands high quality semiconductor single photon sources. In particular, for a reliable single photon source it is not sufficient to have a low multi-photon component, but also to possess high efficiency. We investigate the photon statistics of the emission from a single quantum dot with a method that is able to sensitively detect the trade-off between the efficiency and the multi-photon contribution. Our measurements show, that the light emitted from the quantum dot when it is resonantly excited possess a very low multi-photon content. Additionally, we demonstrated, for the first time, the non-Gaussian nature of the quantum state emitted from a single quantum dot.
The ideal single photon state is quantum mechanically represented by the Fock state , a quantum counterpart of the classical particle. The particle nature of a single photon is traditionally verified by observing an anticorrelation effect on a beam splitter Grangier86 . This measurement of the intensity autocorrelation is commonly accepted as the way to test a light source for non-classicality Scheel . Nonetheless, such a measurement is an intensity-normalized measurement and therefore completely insensitive to the vacuum contribution, . In practice, however, all single-photon sources emit a stochastic mixture of the vacuum and the Fock state . For many applications, which do not depend on the efficiency of the single-photon source the intensity autocorrelation is a sufficient test. On the other hand, applications like linear optical quantum computing KLM crucially depend on the overall source and detector efficiency Brien1 ; Varnava ; Jennewein .
Seen from this perspective, the characterization of a quantum state produced by realistic single photon sources would strongly benefit from a measurement that is sensitive to the vacuum contribution as well as the multiphoton component. By measuring the density matrix one obtains the full information about the quantum state of a real single photon source; regrettably, such a full state tomography is usually quite challenging. An alternative approach is to measure a quantum phase-space description of the state, its so-called Wigner function Leonhardt . It is well known that the single photon state has a negative Wigner function Glauber ; Bachor . Furthermore, there is a whole class of states that possess negative Wigner functions (so called non-Gaussian states of light) as shown by Hudson’s theorem Hudson . The Wigner function is usually measured by homodyne tomography. This is a very tedious procedure and in some cases even impossible. However, when it is possible, it can detect the negativity of the states Wigner function, as was demonstrated for heralded single photon sources Lvovsky . The practical obstacle for such a measurement is that the negativity depends crucially on the overall source and detector efficiency . Namely, if the measured Wigner function is positive, even though the photon source may give a perfectly antibunched intensity autocorrelation measurement. Therefore, the Wigner function has never been reconstructed for solid-state single photon sources, mainly because the collection and detection efficiencies are very unfavourable.
Recently, some of us proposed a novel non-Gaussianity criterion (NG criterion) designed to characterize single photon sources Filip11 . The NG criterion is based on the measurement of photon statistics but, in contrast to the intensity autocorrelation measurement, is sensitive to the overall source (collection and detection) efficiency. Light characterization by measurement and reconstruction of the Wigner function shares some similarities with the NG criterion. In particular: it is sensitive to the losses and is able to distinguish Gaussian from non-Gaussian states Kimble ; Schnabel ; Akira . Additionally, this criterion Filip11 is still applicable in the case of low emission and detection efficiency in contrast to the direct measurement of the negativity of the Wigner function. In other words, this criterion enables an efficiency-sensitive evaluation of real single photon sources without the necessity for complete quantum state tomography.
In this letter, we present measurements performed on the light emitted by a single quantum dot and by a parametric down-conversion heralded single photon source. With these measurements we performed an advanced study of the statistics of the emission from a single quantum dot. In particular, we characterized the efficiency and multiphoton contribution and then tested the obtained results using the NG criterion Filip11 . Further, we compared the results obtained under different types of quantum dot excitation as detailed below. For reference, we also measured this on a parametric down-conversion-based heralded single photon source.
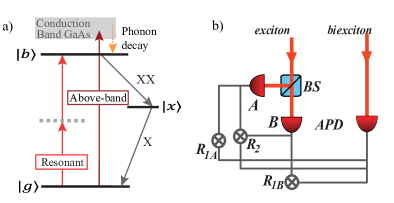
To drive our quantum dot system we used two types of excitation: the first one continuous and above-band and the second one pulsed and resonant. In above-band excitation the energy of the excitation laser is much larger than the quantum dot emission energy. It produces carriers in the surrounding material that can be randomly trapped in the quantum dot potential. Secondly, we performed resonant excitation Jayakumar by two-photon excitation of the biexciton state. Here, we exploited the biexciton binding energy Flissikowski ; Jayakumar in order to use an excitation laser not resonant with any single photon transition. By applying a laser pulse of a specific pulse area we drove the quantum dot system from the ground state to the biexciton state with very high probability (60) and in a coherent and controlled manner Jayakumar . The scheme of the energy levels of the quantum dot is shown in Fig. 1a and the detection scheme is shown in Fig. 1b.
The sample contained low density self-assembled InAs quantum dots embedded in a planar micro-cavity. It was placed in a continuous-flow cryostat and held at a temperature of 5 K. The excitation light was derived from a tunable Ti:Sapphire laser that could be operated in picosecond-pulsed (84 MHz repetition rate) or continuous-wave mode.
The light was directed onto a dot from the side, where we used the lateral wave-guiding mode of the micro-cavity Jayakumar . The emission was then collected from the top. The exciton and biexciton photons were separated by a grating and sent into optical fibres. For the above-band measurements we used a single mode fibre for the biexciton spectral line and, in order to increase the detection efficiency, a multi-mode fibre and a beamsplitter for the exciton line. Under resonant excitation it was not possible to use multi-mode fibres due to the spectral proximity of the scattered laser so we used a single mode fibre for the biexciton line and a single mode fibre and a beamsplitter for the exciton line. Two single photon detectors detected the exciton photons and one detected biexciton photons (see Fig. 1b). The photon detection events were recorded by a multichannel event timer.
The NG criterion Filip11 uses two key parameters, the success rate (efficiency) and the error rate (multiphoton contribution) of the single photon source, which directly apply to the use of single photon sources for linear optical quantum computing Jennewein .
To analyse the photon statistics of the exciton emission triggered on the detection of a biexciton photon, we started by deriving the number of single counts, two-fold, and three-fold coincidences from the measured data, which includes the arrival times of all the recorded photon detection events. Here, single counts are detections of a biexciton photon (trigger event) without an exciton photon. A two-fold coincidence is the detection of a biexciton photon followed by a detection of an exciton photon in one of the arms of the beamsplitter. A three-fold coincidence stands for a detection event on all three detectors (two exciton photons). The coincidence window was varied as detailed below.
We used the number of single counts, two-fold, and three-fold coincidences to estimate the contribution of vacuum , single photon , and multiphoton terms , to the emitted exciton signal, Filip11b . In particular, it is shown in Filip11b that the probability of no event, , can be expressed as
| (1) |
Here is the total number of counts (”singles”) in the biexciton signal. , are total numbers of the two-fold coincidences between the biexciton signal and either exciton signals, respectively. is the total number of the three-fold coincidences. The lower bound estimator of the single photon contribution is given by
| (2) |
where is the splitting ratio of the beamsplitter used in the measurements. The contribution of the multi-photon terms can be estimated as
| (3) |
We determine the photon statistics (, , ) using this method because we are interested in calculating as the lower bound estimator, . The lower bound estimation takes into account the splitting ratio of the beamsplitter. In this way we avoid that the number of coincidences is artificially modified by an unbalanced beamsplitter.
The NG criterion defines a witness, , that the given state is not a mixture of Gaussian states , where is the set of all mixtures of Gaussian states Filip11b . It also derives a boundary (NG boundary) between the states that can be described as a mixture of Gaussian states and those that cannot. This boundary is given as Filip11b
| (4) |
where the squeezing constant Walls is used to parametrize the curve with the displacement given by Filip11b . The witness, is the directed minimum distance between the measured point (, ) and the NG boundary. indicates that the measured state is non-Gaussian. The results are shown in Fig. 2b and Tables 1 and 2.
Due to the very low collection and detection efficiency ( 0.3) the vacuum term prevails. The statistical uncertainties for , , and were determined from the Poissonian statistics of the recorded events. In Tables 1 and 2 the last column gives the value of the witness, , in units of the standard deviation. For example, the result given in the first row of Table 2 indicates a non-Gaussian state, (+), which is situated 2.63 standard deviations away from the boundary. In Fig. 2b, the states of light in the white area are non-Gaussian and produced by a source incompatible with only quadratic non-linear processes.
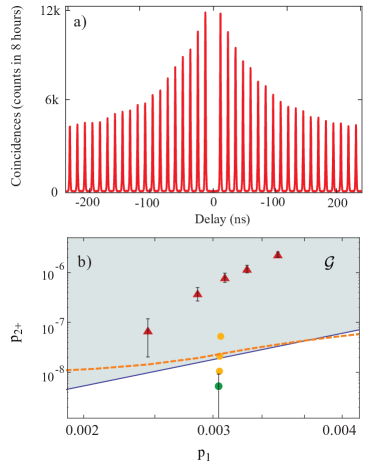
For the resonantly excited quantum dot our results unambiguously prove that the state cannot be expressed as a mixture of Gaussian states, because the witness, is positive for any coincidence window that is smaller than the repetition period of the laser pulses. For example, for a coincidence window of 10 ns the measured state exceeds the Gaussian boundary by 2.63 standard deviations (green circle in Fig. 2b). Extending the coincidence window to 10.24 ns, which includes the beginning of the consecutive pulse, we find the measured state to move towards the boundary of the Gaussian states. Further extension of the coincidence window places the state in the region where we cannot distinguish it from a coherent mixture of Gaussian states (shown in Fig. 2b in yellow circles).
| [ns] | [] | |||
|---|---|---|---|---|
| 1.54 | 0.997553(6) | 2.446(6) | - 1.21 | |
| 2.05 | 0.997140(7) | 2.859(7) | - 3.18 | |
| 2.56 | 0.996885(7) | 3.114(7) | - 4.67 | |
| 3.07 | 0.996660(7) | 3.339(7) | - 5.70 | |
| 3.84 | 0.996319(8) | 3.678(8) | - 8.00 |
| [ns] | [ ] | |||
|---|---|---|---|---|
| 10.00 | 0.996939(3) | 3.061(3) | + 2.63 | |
| 10.24 | 0.996938(3) | 3.062(3) | + 1.16 | |
| 10.75 | 0.996935(3) | 3.064(3) | – 0.17 | |
| 11.24 | 0.996931(3) | 3.067(3) | – 0.60 |
The results obtained in above-band excitation (red triangle in Fig. 2) strongly depend on the chosen coincidence window. If the coincidence window is larger than the exciton lifetime, the dot may get re-excited and thus emit multiple photons. If on the other hand, the coincidence window is smaller than the lifetime, the efficiency will be reduced and eventually detector dark counts will dominate and form the noise floor. As a result for a decreasing coincidence window our data show a tendency of approaching the NG boundary, but cannot cross it. The overall measurement time in this case was close to 8 hours and the average single count rates in the heralding (biexciton) channel and the signal (exciton) channels and were {5.4, 358, and 196} kcounts per second, respectively. The beamsplitter ratio for these measurements was =0.64(1) and the detector dark count rate was 500 counts per second. Given these parameters we estimate a noise floor of 0.41 three-fold coincidences in eight hours for the smallest chosen coincidence window of 1.54 ns. This noise floor, which is depicted for the various coincidence windows as an orange dashed line in Fig. 2b), ultimately limits the sensitivity of the measurement system.
All the above-band excitation results shown in Fig. 2 were calculated for coincidence windows longer (see Table 1) than the lifetime of the exciton state (0.71 ns). While we tried analyses using shorter coincidence windows we did not observe any three-fold coincidences then during the entire measurement run. This puts our estimation of to zero, but will yield a statistical error that is much larger than the NG boundary itself providing only an inconclusive result. This exemplifies that our measurements and analysis do take into account the entire system of source, collection and detection and when we observe a non-Gaussian state it is a direct observation, not an extrapolation.
In comparison under resonant excitation the measured single rates were { , and } = {37, 20, and 17} kcounts per second with the respective beamsplitter ratio of =0.54(1). The measurement time was 3 hours. The use of resonant excitation gives an excellent suppression of multiphoton events, as evident in Fig. 2a. For resonant excitation we estimate the noise floor to be 0.04 three-fold coincidences per 8 hour measurement. This threshold is lower than the one we obtain in above-band excitation due to the different nature of the excitation. Namely, resonant excitation produces predominantly cascaded emissions therefore the heralding efficiency and thus is a bit higher than with above-band excitation despite the lower overall exciton detection rates.
It is also interesting to compare the results presented in Table 2 with the traditional intensity autocorrelation measurement. We modified the post-processing of the measurements obtained in resonant excitation, and used the laser pulse arrival as the trigger event instead of the detection of the biexciton. Here, we obtain =0.43444(4) and =0.41(2). The results show a multiphoton contribution that is comparable to the data presented in the first row of Table 2, but the efficiency of the source is significantly reduced. In particular, /=0.14. This result is to be expected due to the blinking of the quantum dot and the imperfect emission probability achieved in resonant excitation. In Jayakumar we showed, in measurements performed on the same single quantum dot, that about 2/3 of the time the blinking stops the emission from the device. Additionally, we demonstrated Jayakumar that due to the level dephasing in the quantum dot the the maximal emission probability achievable is 70. The measurements presented here were obtained with a laser pulse energy capable of bringing 60 of the population from the ground to the biexciton state. In other words, we expected /=0.30.6=0.18. We can then can estimate as 2[1--]/[2(1-)-]2 and the Grangier’s Grangier86 anticorrelation parameter =/, which is equal to for a symmetric beamsplitter as in our case. For the biexciton triggered measurement in resonant excitation we obtain =0.0030(1). The same measurement triggered on the laser pulse arrival gives =0.041(2). The later result is comparable with the autocorrelation parameter extracted from the traditional intensity autocorrelation measurement of 0.031(2).
As stated above, due to the different nature of the excitation, resonant and above-band, we obtain different noise thresholds. In addition, it is expected that the efficiency of these two processes is different. Only a coherent process such as resonant excitation can bring 100 of the population from the ground to the excited state. To compare the respective efficiencies we performed biexciton-triggered measurements of in above-band excitation for various excitation powers. The results are shown as gray dots in Fig. 3a. For comparison the dashed line shows the value we obtained in resonant excitation. An interesting feature is that decreases with excitation power, reaching its minimum at the biexciton line saturates. We believe that this happens because the biexciton is re-excited directly from the exciton state before the system has reached the ground state and thus couldn’t emit an exciton photon. Therefore the ratio of emitted exciton to biexciton photons is reduced. This is ultimately limits how strongly quantum dot-based pair sources can be driven incoherently.
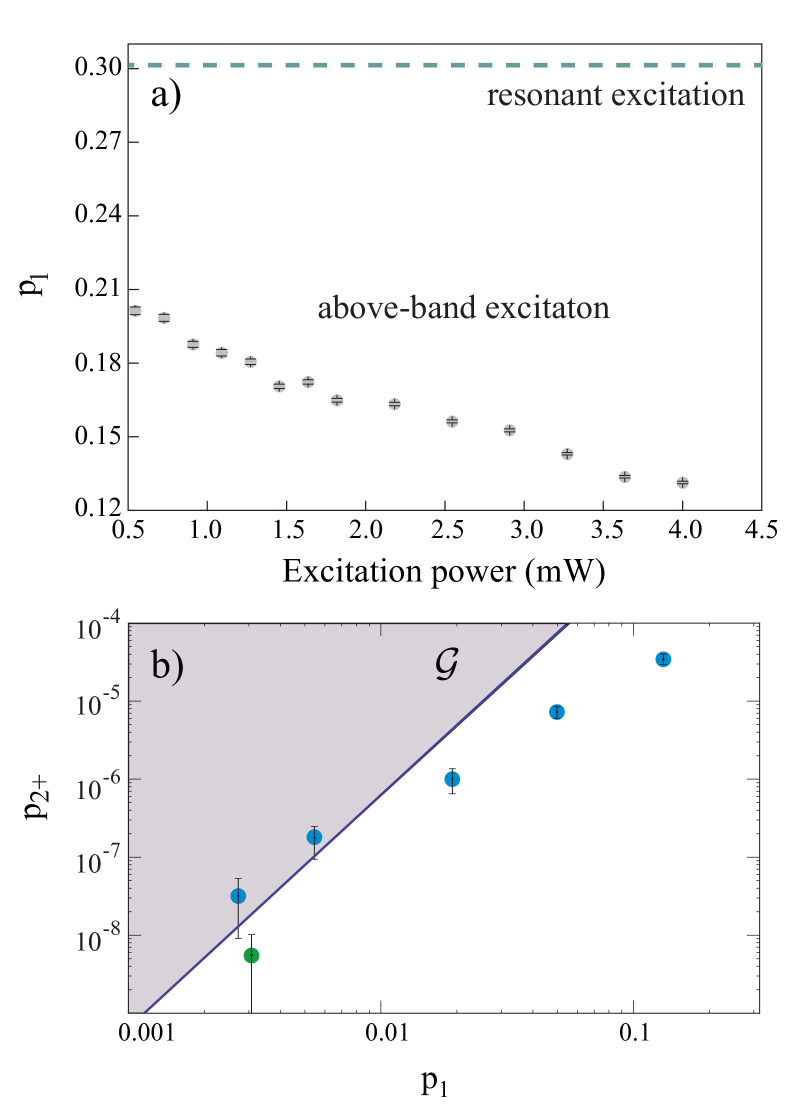
To complete the study we also measured the photon statistics from a parametric down-conversion heralded single photon source. For this purpose we used the Sagnac-interferometer-based down-conversion source of entangled photon pairs described in sagnac . The pair production rate was kept at the low value of 0.003 pairs per pulse in order to maintain a high quality of the entanglement comment1 . It has been shown that entanglement decreases with increased pump power and photon pair creation probability kuzucu . The results are given in Table 3 and Fig. 3b. Here, we used the signal photons to trigger the measurement (corresponding to the biexciton photons) and the idler photons were sent onto a fibre beamsplitter (corresponding to the exciton photons).
A quantum dot is a point like source in a large refractive index medium that emits light in all directions. This limits the collection efficiency into a single mode fibre to 1.5 in our case. On the other hand, the photons produced in down-conversion are well directed in space and we can collect them into a single mode fibre with 74 efficiency. Furthermore, the quantum dot emission has a wavelength of around 920 nm while our down-conversion source produces photons at 808 nm. This yields detector quantum efficiencies of 0.2 and 0.5, respectively. The initial of the down-conversion source was 14 and in the experiment we gradually attenuated the idler beam to simulate losses comparable to the quantum dot case. The results show that for comparable overall efficiency and for the range of operating parameters available, the down-conversion source emission contains a higher proportion of multiphoton events than the emission from a single quantum dot.
| [] | |||
|---|---|---|---|
| 0.8685(2) | 131.4(3) | + 146 | |
| 0.95018(7) | 49.81(7) | + 56.7 | |
| 0.98081(3) | 19.18(3) | + 10.1 | |
| 0.99455(1) | 5.45(1) | – 0.98 | |
| 0.997277(5) | 2.723(5) | – 0.80 |
In conclusion, we demonstrated the non-Gaussian nature of the emission of a single quantum dot under resonant excitation. With this we detected a higher order non-classicality than usually detected by autocorrelation measurements. Therefore, we gained an intrinsically higher sensitivity to possible contributions from other emitters Filip11 . In particular, we used a pulsed laser to resonantly bring the quantum dot system from the ground to the biexciton state which showed exceptionally pure quantum states of light.
Our measurement is the first demonstration of the non-Gaussian nature of photons produced by a semiconductor device. For completeness, we contrasted our results with the traditional auto-correlation measurement and with a parametric down-conversion heralded single photon source. We concluded that for a comparable overall efficiency quantum dot single photon source shows a smaller multiphoton contribution.
The non-Gaussian nature of a quantum state is a very important resource for quantum communication Eisert and quantum computing Niset ; Veitch ; Mari . Furthermore, it is a fundamental property of the single photons state Glauber . With the increased detection efficiencies available in other device geometries Pascale the criterion we used becomes an important measure of the quality of the produced light. The combination of resonant excitation, deterministic excitation of the quantum dot, and very pure single photon states is essential for using semiconductor photon sources for integrated linear optical quantum computing KLM ; Brien ; Brien1 ; Kok .
This work was funded by the European Research Council (project EnSeNa) and the Canadian Institute for Advanced Research through its Quantum Information Processing program. G.S.S. acknowledges partial support through the Physics Frontier Center at the Joint Quantum Institute (PFC@JQI). R.F. acknowledges project P205/12/0577 of GAČR.
References
- (1) P. Grangier, G. Roger, and A. Aspect, Europhys. Lett. 1, 173-179 (1986).
- (2) S. Scheel, Journal of Modern Optics 56, 141 (2009).
- (3) E. Knill, R. Laflamme, and G. J. Milburn, Nature 409, 46 (2001).
- (4) J. L. O’Brien, Science 318, 1567 (2007).
- (5) M. Varnava, D. E. Browne and T. Rudolph, Phys. Rev. Lett. 100, 060502 (2008).
- (6) T. Jennewein, M. Barbieri, and A. White, Journal of Modern Optics 58, 276 (2011).
- (7) U. Leonhardt, Measuring the Quantum State of Light, (Cambridge University Press, 1997).
- (8) R. Glauber, Quantum Theory of Optical Coherence, (Wiley-VCH, Weinheim, 2007).
- (9) H. Bachor, and T. Ralph A Guide to Experiments in Quantum Optics, (Wiley-VCH, Weinheim, 2004).
- (10) R. L. Hudson, Rep. Math. Phys. 6, 249 (1974).
- (11) A. I. Lvovsky, H. Hansen, T. Aichele, O. Benson, J. Mlynek, and S. Schiller, Phys. Rev. Lett. 87, 050402 (2001).
- (12) R. Filip and L. Mišta, Jr., Phys. Rev. Lett. 106, 200401 (2011).
- (13) Z. Y. Ou, S. F. Pereira, and H. J. Kimble, Phys. Rev. Lett. 70, 3239 (1993).
- (14) H. Vahlbruch, M. Mehmet, S. Chelkowski, B. Hage, A. Franzen, N. Lastzka, S. Goßler, K. Danzmann, and R. Schnabel, Phys. Rev. Lett. 100, 033602 (2008).
- (15) Y. Takeno, M. Yukawa, H. Yonezawa, and A. Furusawa, Optics Express 15, 4321 (2007).
- (16) H. Jayakumar, A. Predojević, T. Huber, T. Kauten, G. S. Solomon, and G. Weihs, Phys. Rev. Lett. 110, 135505 (2013).
- (17) T. Flissikowski, A. Betke, I. A. Akimov, and F. Henneberger, Phys. Rev. Lett. 92, 227401 (2004).
- (18) M. Ježek, I. Straka, M. Mičuda, M. Dušek, J. Fiurášek, and R. Filip, Phys. Rev. Lett. 107, 213602 (2011).
- (19) D. F. Walls, and G. J. Milburn, Quantum Optics, (Springer, 2008).
- (20) C. Santori, D. Fattal, J. Vučković, G. S. Solomon, E. Waks, and Y. Yamamoto, Phys. Rev. B. 69, 205324 (2004).
- (21) A. Predojević, S. Grabher, and G. Weihs, Optics Express 20, 25022 (2012).
- (22) At production rate of 0.003 pairs per pulse we measured H/V, and A/D visibilities to be 99.86(3) and 98.65(3), respectively. The corresponding value of the tangle was T=0.961(7).
- (23) O. Kuzucu and F. N. C. Wong, Optics Express 15, 15377 (2007).
- (24) J. Eisert, S. Scheel, and M. B. Plenio, Phys. Rev. Lett. 89, 137903 (2002).
- (25) J. Niset, J. Fiurášek, and N. J. Cerf, Phys. Rev. Lett. 102, 120501 (2009).
- (26) V. Veitch, C. Ferrie, D. Gross and J. Emerson, New.J.Phys 14, 113011 (2012).
- (27) A. Mari and J. Eisert, Phys. Rev. Lett. 109, 230503 (2012).
- (28) A. Dousse, J. Suffczyński, A. Beveratos, O. Krebs, A. Lemaître, I. Sagnes, J. Bloch, P. Voisin and P. Senellart, Nature 466, 217 (2010).
- (29) J. L. O’Brien, A. Furusawa, and J. Vučković, Nature Photonics 3, 687 (2009).
- (30) P. Kok, W. J. Munro, K. Nemoto, T. C. Ralph, J. P. Dowling, and G. J. Milburn, Rev. Mod. Phys. 79, 135 (2007).