A Galactic short gamma-ray burst as cause for the 14C peak in AD 774/5
Abstract
In the last 3000 yr, one significant and rapid increase in the concentration of 14C in tree rings was observed; it corresponds to a -ray energy input of erg at Earth within up to one year in AD 774/5 (Miyake et al., 2012). A normal supernova and a solar or stellar flare are unlikely as cause (Miyake et al., 2012), so that the source remained unknown. Here, we show that a short gamma-ray burst (GRB) in our Galaxy is consistent with all observables: Such an event is sufficiently short and provides the necessary energy in the relevant spectral range of -rays. Its spectral hardness is consistent with the differential production rates of 14C and 10Be as observed. The absence of reports about a historic sighting of a supernova in AD 774/5 or a present-day supernova remnant are also consistent with a short GRB. We estimate the distance towards this short GRB to be to kpc - sufficiently far away, so that no extinction event on Earth was triggered. This is the first evidence for a short GRB in our Galaxy.
keywords:
gamma-rays bursts, supernovae, neutron stars, white dwarfs1 Introduction: The AD 774/5 event
A significant increase in the 14C to 12C isotope ratio was detected in Japanese trees in AD 774/5 and a subsequent decrease for yr (Miyake et al., 2012, henceforth M1). It is consistent with an increase in 14C in American and European trees with to yr time resolution (Stuiver et al., 1998). If deposited within one year or less - best consistent with an atmospheric deposition model - the increase is 10 times larger than the average production due to Galactic cosmic rays and 20 times larger than expected from the yr solar cycle (M12). This requires a -ray energy input of erg at Earth (M12). Also, a increase in 10Be around AD 775 was observed in Antarctica, but with lower time resolution (Horiuchi et al., 2008). Solar or stellar flare were found to be unlikely because of the insufficient energetics and spectrum of such flares (M12). A normal supernova (SN) was also found to be unlikely from the lack of any historical sighting or a SN remnant (SNR) (M12).
2 Supernova or magnetar flare ?
A strongly absorbed SN was not considered quantitatively, yet: Absorption in the line-of-sight would not affect -rays, but would decrease the observable optical flux of a SN. Of the total energy output of a SN, E(event) = erg, a fraction goes into -rays (Richardson et al., 2002). The ratio between the -ray energy emitted by a SN event spread homogeneously into the total area of a spherical shell around the SN ( with distance from the event to Earth) and the -ray energy E(obs) observed at Earth is equal to the ratio between the surface area of that sphere and the Earth solid angle (with Earth radius ):
| (1) |
Therefore, a normal SN (with ),
of which a -ray flux of E(obs) = erg was observed at Earth,
would have a distance pc, independent of absorption.
If the AD 774/5 event were one of the rare () over-luminous SNe, up to four times brighter
than normal SNe (Richardson et al., 2002), then the expected distance is pc.
From the peak absolute magnitude (Richardson et al., 2002), we can estimate the unabsorbed apparent peak magnitude:
m= mag, 124 pc, M= mag, SN Ia,
m= mag, 124 pc, M= mag, SN II,
m= mag, 260 pc, M= mag, SN Ibc.
One would need absorption of at least mag
to disable a historical sighting by naked eye (limit mag for discovery of a new object, Strom, 1994).
Such a strong absorption within or pc is not possible,
except in small areas towards dark clouds (Reipurth, 2008):
The closest dark clouds with mag are
Lynds 183 at pc with up to A mag (Pagani et al., 2004)
and Oph at pc with up to A mag (Lombardi et al., 2008; Sadavoy et al., 2010).
Absorption of mag is limited to deg2 on the sky (Dobashi, 2011, and K. Dobashi priv. comm.)
and less for distances within to pc (Reipurth, 2008). The probability of an event within deg2
of the whole sky is . Even then, a large, young, and bright SNR would be
detectable by X-ray pointings, but can be excluded (Green, 2009, Chandra SNR catalog111hea-www.harvard.edu/ChandraSNR/snrcatgal.html).
Given the measurement precision achieved in 14C for the peak in AD 774/5 (M12), potential 14C from SNe can be detected up to pc with . Indeed, there are no SNe, pulsars, nor SNR known within a few hundred pc with age of some 300 to 2000 yr (Strom, 1994; Green, 2009; Manchester et al., 2005, footnote 1; McGill SGR/AXP catalog222www.physics.mcgill.ca/ pulsar/magnetar/main.html) There are eleven events with evidence (historic observation, detected SNR and/or known pulsar) for a SN within 2000 yr and 5 kpc (Strom, 1994; Green, 2009; Manchester et al., 2005, footnote 1 & 2) and for all of them, a SNR is detected (Green, 2009), and at least eight were observed historically (Strom, 1994). While a missing historic observation is possible, a missing SNR is very unlikely.
Magnetar flares (soft gamma-ray repeaters or anomalous X-ray pulsars) were not yet considered: The largest flare observed was the X- and -ray flare of SGR 1806-20 on 2004 Dec 27 with peak energy ( erg/s at 15 kpc (Hurley et al., 2005), or E(event) = erg at kpc (Bibby et al., 2008). If the AD 774/5 event were such a flare, it would have taken place at pc (Equ. 1 with ), but there is no neutron star known within such a small distance (Manchester et al., 2005, footnote 2) Even if a magnetar with G dipole field could produce an event with erg (Hurley et al., 2005), the distance of such a neutron star to produce the AD 774/5 event would have to be pc. A magnetar at that small distance would have been detected by the ROSAT all-sky X-ray survey: For a persistent bolometric luminosity (mostly X-rays) of erg/s with typical observed spectral components of magnetars (blackbody with peak energy keV and power-law index , footnote 2), we expect 150 to 800000 cts/s in the ROSAT energy band 0.1-2.4 keV at 10 to even 100 pc, i.e. easily detectable. Hence, we can exclude magnetar flares for the AD 774/5 event.
3 A short gamma-ray burst
Given that events on Earth as well as solar and stellar flares (M12) including neutron star flares (see above) as well as unabsorbed (M12) and absorbed supernovae are very unlikely to be the cause for the AD 774/5 cosmic-ray event (see above), we will now consider a gamma-ray burst (GRB). The observed duration and spectral hardness of GRBs allows to divide them into long (s) and short (s) GRBs, the latter are harder regarding the spectrum (power-law with exponential cutoff) and are not related to SNe nor SNRs (Nakar, 2007). While long GRBs are caused by the core collapse of a very massive star, short GRBs are explained by the merger of two compact objects (Nakar, 2007). A merger of two previously orbiting compact objects is the coalescence of a neutron star with either a black hole becoming a more massive black hole, or with another neutron star becoming either a relatively massive stable neutron star or otherwise a black hole, if the total mass exceeds the upper mass limit of neutron stars, somewhere between 2 and 3 M⊙. E.g., the merger of two magnetized neutron stars can produce a spinning black hole launching a relativistic jet as observed in short GRBs (Rezzolla et al., 2011), if the Earth is located in the jet. Let us now consider a short GRB.
3.1 Energetics, time-scale, and spectrum
A short GRB emits an isotropic equivalent energy of E(event) = to erg in the observed energy range 10 keV to 30 GeV (Nakar, 2007; Berger, 2007), most or all in -rays ( to 1). We estimate the distance towards a short GRB from Equ. 1 to to kpc, i.e. within our Galaxy. Hence, the energetics of the 14C peak on Earth are consistent with a short GRB.
Effects of nearby long GRBs on the Earth biosphere due to the direct hit ( erg/s for 10s) on one half-sphere were found to be lethal within kpc (Melott et al., 2004; Thomas et al., 2005). This can be scaled to a short GRB with to erg. Hence, for a short GRB within kpc, strong extinction effects are expected. Because no extinction event was observed on Earth for AD 774/5, the short GRB was more distant, probably to kpc.
A transient event is expected in the optical (macronova) from compact mergers with mag at peak (Metzger & Berger, 2012; Piran et al., 2012). This corresponds to (0.1 kpc) or mag (4 kpc) for negligible absorption. Hence, it may have been observable by naked eye, but only for up to one day, i.e. much shorter than a typical SN. If reports about such a sighting remain missing, it can be due to the short time-scale, strong absorption, bad weather, and/or sky location near the Sun and/or above unpopulated areas such as the Pacific during the short visibility period. A missing historical observation and a missing SNR are fully consistent with a short GRB.
Since the peak of 14C observed in AD 774/5 is consistent with a sharp increase within 0.1 to 1 yr (M12), a short GRB typically lasting less than 2s (Nakar, 2007; Rezzolla et al., 2011) and being undispersed in interstellar space is consistent with the observations regarding the short time-scale.

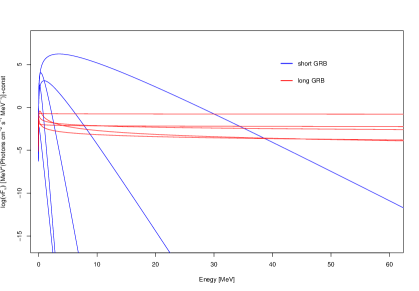
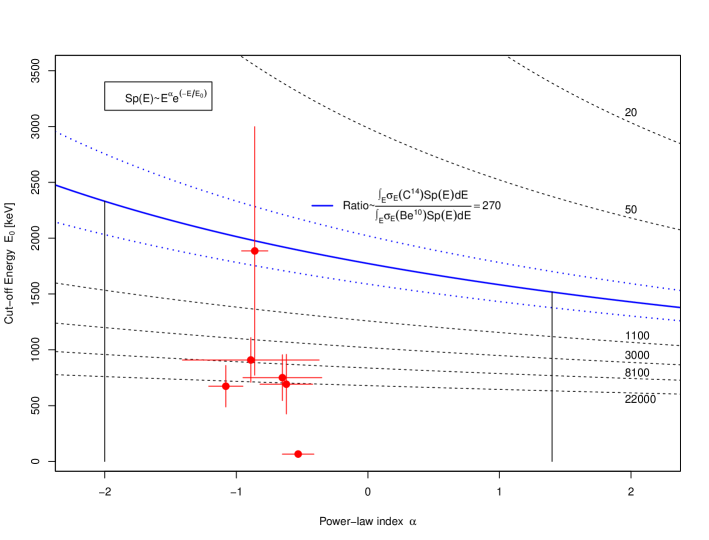
Given the cross-sections333www-nds.iaea.org, (Dimbylow, 1980; Burger & Ebert, 1981) of the relevant reactions producing 14C and 10Be (Fig. 1) and the full range of observed spectral parameters of short (Nakar, 2007; Ghirlanda et al., 2009) and long (Band function, Band et al., 1993) GRBs (Fig. 2), we computed the outcome (Fig. 3). We assume that the peaks in 14C ( atoms/cm2/s in yr, M12), and 10Be ( increase with 10 yr time resolution, Horiuchi et al., 2008) were both due to the same event, i.e. produced within one year. Then, with the known background rates for 14C (M12) and for 10Be (Horiuchi et al., 2008), we conclude that (1 error) times more 14C was produced than 10Be, above the respective backgrounds. Since some of the 10Be production may have been produced by some other effects in that decade (lower time resolution), this ratio can be considered as a lower limit. We can compare this to the expected outcome for a short GRB: The typical energy spectrum of a short GRB is
| (2) |
with a power-law index and a cutoff energy E0 (Nakar, 2007; Ghirlanda et al., 2009). We obtained the cross-sections for the reactions 14N(n,p)14C and 14N(n,p+)10Be from E = 10 to 60 MeV (footnote 3). We show the dependence of the cross-sections on the energy E for both reactions in Fig. 1. Then, we integrated the cross-section at that energy range E multiplied by the typical short GRB spectra Sp(E) over the energy E from 10 to 60 MeV for both 14C and 10Be to obtain the expected ratio:
| (3) |
Given the definition of cross-section, both the nominator and the denominator in this equation are proportional to the respective number of atoms produced.
We estimated the ratio as expected differential production rates for a grid of and E0 as observed for short GRBs, i.e. power law index from to 1.4 and cutoff energy E0 from 49 to 1900 keV (Nakar, 2007; Ghirlanda et al., 2009), using XSPEC. The results are shown in Fig. 3. We then also estimated the expected fraction of 14C to 10Be production over the backgrounds for a long GRB with a Band function as spectrum (Band et al., 1993), i.e. a smoothly broken power-law. Again, we used the full range of parameters observed for all those long GRBs, where all three spectral parameters were obtained by good fits, namely for the 1st index from to 0.07, for the 2nd index from to , and for the cutoff energy E0 from 52 to 2867 keV (not redshifted) for long GRBs observed by FERMI or BATSE (Nakar, 2007; Ghirlanda et al., 2009; Zhang et al., 2011).
Fig. 2 already shows qualitatively that a long GRB with a model of a smoothly broken power law (Band function) cannot explain that the 14C production was so much larger than the 10Be production given the energy-dependence of the cross-sections of those reactions. Our detailed calculations show that a long GRB with the Band function would produce only up to 18 times more 14C than 10Be. Only a short GRB can explain this observable (ratio ).
3.2 Rates of gamma-ray bursts and mergers
The rate of 14C peaks (1 in 3000 yr) is not well constrained, but non-zero; the error of the rate is fully unconstrained.
The rate of short GRBs is Gpc-3 yr-1 (Coward et al., 2012), all observed and pointed at us. Using then Mpc-3 as number density of typical galaxies (Melott et al., 2004), we have one short Galactic GRB in kyr beamed towards Earth. If we restrict this estimate to the Galactic disk within 4 kpc, the observed rate is 10 times lower, i.e. one nearby Galactic GRB beamed at us in kyr. Given the sensitivity limits of detectors like BATSE and SWIFT, this is a highly uncertain lower limit. While this is not consistent with 1 event in 3000 yr within , it is consistent within . Given that the error of the 14C event rate is unknown, it is consistent with the rate of local short GRBs even within .
Even though the possible connection between short GRBs and compact mergers are not of central importance for our arguments, because we use only real observables of short GRBs, we will now consider the rates of mergers of compact objects. From the three known double neutron stars, one can expect the rate of mergers per galaxy to be 3 to 190 Myr-1 ( error range) with the mean being 13 Myr-1 (Kim et al., 2010). From the initial mass function and, hence, birth rate of massive stars that can become neutron stars, then taking into account the multiplicity rate, evolution, and interaction of massive stars, one can predict 0.3 to 50 mergers per galaxy Myr-1 ( error range) with the mean being 15 Myr-1 (Dominik et al., 2012). Thus, at most we expect 190 mergers per galaxy Myr-1 or up to one merger in yr. If such a merger would be observable as short GRB, one would have to correct the rate for the beaming fraction to 0.13 for short GRBs (Rezzolla et al., 2011). For , one would then expect up to one merger in yr (within error bars), pointed towards Earth as short GRB (ten times less within 4 kpc).
Because of sensitivity limits of observational techniques, both the observed multiplicity rate of massive stars and the estimated number of double neutron stars and mergers are lower limits. We can add the rates of mergers between neutron stars and black holes and between two black holes.
Neither the highly uncertain rates of observed short GRBs nor of neutron star mergers are consistent with the observed rate of the 14C event (one event in 3000 yr) within , but all are consistent within . Furthermore, a short GRB is the only known phenomenon that can provide correct energetics, correct spectrum, and correct time-scale for the observed event; it also does not produce a typical SN light curve for several month nor a detectable SNR nor a mass extinction event on Earth, which are all missing. If the AD 774/5 event was a short GRB and if the probability to observe one Galactic GRB within 3000 yr is too small, one would have to conclude that there are more (fainter) short GRBs than observed so far, and/or that there is another astrophysical population contributing to short GRBs, which was not yet fully recognized.
Short GRBs with extended emission may partly be due to either an accretion-induced collapse of a white dwarf or the merger of two white dwarfs (Berger, 2011; Bucciantini et al., 2012; Metzger et al., 2011). In such an event, a magnetar can form (Bucciantini et al., 2012). The rate of mergers of two white dwarfs with a total mass above the Chandrasekhar mass limit of M⊙ has been estimated to be per M⊙ with error bars (Badenes & Maoz, 2012). This corresponds to only about one tenth of the SN Ia rate, so that the merger of two white dwarfs with super-Chandrasekhar mass cannot explain all SN Ia events. However, it is suggested that such super-Chandrasekhar mergers can be observed as short GRBs (Berger, 2011; Bucciantini et al., 2012; Metzger et al., 2011). For our Galaxy with M⊙, we obtain a rate of mergers of white dwarf binaries with super-Chandrasekhar mass in 3000 yr. If we assume that such an event can be observed as short GRB with extended emission with a beaming factor of up to (Bucciantini et al., 2012), and if we also restrict the rate to the disk within 4 kpc (the maximum distance of a short GRB to explain the AD 774/5 event), we expect such mergers in 3000 yr. Since the error of the rate of 14C events (as in AD 774/5) is unconstrained, one cannot claim that the rates of white dwarf binary mergers with super-Chandrasekhar mass (pointing towards us a short GRB) and the 14C event rate are inconsistent.
Since short GRBs with extended emission may have lower total energies (Bucciantini et al., 2012), which can be below the BATSE and SWIFT sensitivity limits, they may often remain undetected, so that their observable rates could be underestimated. There is evidence for short GRBs with lower energies and their rate is probably much higher (Levan & Tanvir, 2005; Tanvir et al., 2005; Nakar et al., 2006). Given the discussion of the rates, we can speculate that some short GRBs, like possibly one in AD 774/5, are due to an accretion-induced collapse of a white dwarf or the merger of two white dwarfs, and that such (possibly frequent) short GRBs typically have energies below the current sensitivity limit of erg and possibly wide beaming angles; they may produce a neutron star, but no SNR.
4 Concluding remarks
A long GRB can be accompanied by a SN and a SNR, but none were observed for AD 774/5; this could be due to strong absorption (no optical sighting of the SN) and large distance (faint SNR with very small angular extension on sky). With the typical isotropic equivalent energy output E(event) = to erg of a long GRB in -rays of 10 keV to 30 GeV and to 1 (Nakar, 2007), we estimate its putative distance towards Earth from Equ. 1 to to kpc, i.e. in our Galaxy or the neighbouring Canis Major, Sagittarius, or Ursa Major II dwarf galaxies. To avoid a historical sighting of a SN brighter than mag (Strom, 1994) at the minimum distance of 1 kpc, one would need an absorption of mag for a peak absolute magnitude of mag for a collapsar/hypernova (Richardson et al., 2002). An area of deg2 has an absorption of mag (Dobashi, 2011), an even smaller area for clouds within 1 kpc. There is no such SNR detected behind these areas (Green, 2009, footnote 1). Considering also that long GRBs are 20 times less frequent than short GRBs (Nakar, 2007), a long GRB behind such strong absorption is then times less likely than a short GRB to explain the 14C peak in AD 774/5. Also, sampling the whole observed range of spectral parameters of long GRBs with their smoothly broken power law or Band function (Nakar, 2007; Ghirlanda et al., 2009; Band et al., 1993; Zhang et al., 2011), we cannot explain the differential 14C to 10Be production observed (Fig. 1). Hence, a short GRB remains the only plausible explanation for the 14C peak in AD 774/5.
We list in Table 1 all known neutron stars with characteristic age yr (Manchester et al., 2005, footnote 2) at distances from 1 to 4 kpc, but without any known SNR (Green 2009; footnote 1). The list includes two Anomalous X-ray Pulsars (AXPs), one Fermi Gamma-ray Large area telescope pulsar (FGL), and one Soft Gamma-ray Repeater (SGR). We use a larger pulsar age upper limit (25000 yr) than the time since AD 774/5, because characteristic ages are usually upper limits and can be 20 times larger than the true age (Kramer et al., 2003). We include SGR 0418+5729 with an upper limit for the period derivative and, hence, a lower limit on the age (which is below 25000 yr). If a neutron star was formed in AD 774/5, it is also possible that it was not yet discovered, e.g. because of misdirected pulsar beaming, or that distance and/or age have not yet been determined. For the five pulsars listed here, one should obtain deep X-ray, -ray, H, and radio observations to search for SNRs: If a SNR can be excluded in one of them, that pulsar may be a good candidate for the product of the AD 774/5 event. Three of the five neutron stars listed are AXPs or SGRs, which can form by a short GRB with extended emission (Berger, 2011; Bucciantini et al., 2012; Metzger et al., 2011)
Table 1: Young neutron stars at 1-4 kpc without SNR. We list pulsar name with position for J2000.0, rotation/pulse period , period derivative ,
distance, and characteristic age , data from Manchester et al. (2005) or McGill SGR/AXP catalog (footnote 2).
Name
Period
P-dot
Dist.
Age
Re-
J2000.0
P [s]
[s/s]
[kpc]
[kyr]
mark
SGR 0418+5729
9.0784
0.0006
2
24
PSR J1048-5832
0.1237
9.6e-14
2.98
20.3
FGL
PSR J1708-4009
11.0013
1.9e-11
3.08
9.01
AXP
PSR J1740-3015
0.6069
4.6e-13
3.28
20.6
PSR J1809-1943
5.5404
7.8e-12
3.57
11.3
AXP
In summary, all observables of the 14C peak in AD 774/5 are consistent with a Galactic short GRB at 1-4 kpc: Sufficient energetics, correct spectrum, and correct time-scale, also neither a SN nor a SNR nor a mass extinction event. The only assumptions made were the following: From comparing their 14C tree ring data with a model of incorporation of 14C into the biosphere, M12 concluded that the event duration was one year or shorter, and they could then derive the 14C flux and energy deposited on Earth which was also used in our work; we also used the 10Be flux observed in the same decade (Horiuchi et al., 2008) and assumed that it was produced by the same event (see e.g. Stuiver et al., 1998) to derive the differential 14C to 10Be production rate; we derived a lower limit to the differential production rate, because some of the 10Be observed in that decade could have been produced by other effects. The derived lower limit was then found to be inconsistent with long GRBs, but fully consistent with the spectra of short GRBs. Rates of short GRBs and neutron star mergers are marginally consistent with one event in 3000 yr, but the error of the rate of the AD 774/5 event is unknown. The merger of two white dwarfs with super-Chandrasekhar mass or an accretion-induced collapse of a white dwarf producing a short GRB (with erg at kpc) should also be considered. The product could be a neutron star without SNR, so that our conclusions are testable.
Acknowledgments
We would like to thank the German national science foundation DFG (Deutsche Forschungsgemeinschaft) for financial support through the collaborative research center Sonderforschungsbereich SFB TR 7 Gravitational Wave Astronomy sub-project C7. We used the online catalog of Supernova Remnants by D. Green, the Chandra supernova remnant catalog maintained by F. Seward, the ATNF online catalog of pulsars maintained by G.B. Hobbs and R.N. Manchester, and the McGill online catalog of SGRs and AXPs maintained by the McGill Pulsar Group. We also thank Kazuhito Dobashi for information about the size of the sky area, where the extinction is or mag, considering the whole sky.
References
- Badenes & Maoz (2012) Badenes C. & Maoz D., 2012, ApJ 749, L11
- Band et al. (1993) Band D., Matteson J., Ford L., et al., 1993, ApJ 413, 281
- Berger (2007) Berger E., 2007, ApJ 670, 1254
- Berger (2011) Berger E., 2011, NewARev. 55, 1
- Bibby et al. (2008) Bibby J.L., Crowther P.A., Furness J.P., Clark J.S., 2008, MNRAS 386, L23
- Bucciantini et al. (2012) Bucciantini N., Metzger B.D., Thompson T.A., Quataert E., 2012, MNRAS 419, 1537
- Burger & Ebert (1981) Burger G. & Ebert H.G. (Eds.), 1981, Proc. 4th Symp. neutron dosimetry, Munich
- Coward et al. (2012) Coward D.M., Howell E.J., Piran T., et al., 2012, MNRAS 425, 2668
- Dimbylow (1980) Dimbylow P.J., 1980, Phys. Med.Biol. 25, 637
- Dobashi (2011) Dobashi K., 2011, PASJ 63, 1
- Dominik et al. (2012) Dominik M., Belczynski, K., Fryer, C., Holz, D.E., Berti, E., Bulik, T., Mandel, I., O’Shaughnessy, R., 2012, ApJ 759, 52
- Ghirlanda et al. (2009) Ghirlanda G., Nava L., Ghisellini G., Celotti A., Firmani C., 2009, A&A 496, 585
- Green (2009) Green D.A., 2009, Bull. Astron. Soc. India 37, 45
- Horiuchi et al. (2008) Horiuchi K. et al., 2008, Quat. Geochronol. 3, 253
- Hurley et al. (2005) Hurley K., Boggs S.E., Smith, D.M., et al., 2005, Nat. 434, 1098
- Kim et al. (2010) Kim C., Kalogera V., Lorimer D., 2010, NewARev. 54, 148
- Kramer et al. (2003) Kramer M., Lyne A.G., Hobbs G., Löhmer O. Carr P. Jordan C., Wolszczan A., 2003, ApJ 593, L31
- Levan & Tanvir (2005) Levan A. & Tanvir N., 2005, GCN Circ. 3927
- Lombardi et al. (2008) Lombardi M., Lada C.J., Alves J., 2008, A&A 489, 143
- Manchester et al. (2005) Manchester R.N., Hobbs G.B., Teoh A., Hobbs M., 2005, AJ 129, 1993 (updates on http://www.atnf.csiro.au/people/pulsar/psrcat)
- Melott et al. (2004) Melott A.L., et al., 2004, JBioA 3, 56
- Metzger & Berger (2012) Metzger B.D. & Berger E., 2012, ApJ 746, 48
- Metzger et al. (2011) Metzger B.D., Giannios D., Thompson T.A., Bucciantini N., Quataert E., 2011, MNRAS 413, 2013
- Miyake et al. (2012) Miyake F., Nagaya K., Masuda K., Nakamura T., 2012, Nat 486, 240 (M12)
- Nakar (2007) Nakar E., 2007, Phys. Rep. 442, 166
- Nakar et al. (2006) Nakar E., Gal-Yam A., Fox D.B., 2006, ApJ 650, 281
- Pagani et al. (2004) Pagani L., et al., 2004, A&A 417, 605
- Piran et al. (2012) Piran T., Nakar E., Rosswog S., 2012, ArXiv:1204.6242
- Reipurth (2008) Reipurth B., 2008, Handbook of Low Mass Star Forming Regions, Astron. Soc. Pacific
- Rezzolla et al. (2011) Rezzolla L., Giacomazzo B., Baiotti L., Granot J., Kouveliotou C., Aloy M.A., 2011, ApJ 732, L6
- Richardson et al. (2002) Richardson D., Branch D., Casebeer D., Millard J., Thomas R.C., Baron E.A., 2002, AJ 123, 745
- Sadavoy et al. (2010) Sadavoy S.I., Di Francesco J., Bontemps S., et al., 2010, ApJ 710, 1247
- Strom (1994) Strom R.G., 1994, A&A 288, L1
- Stuiver et al. (1998) Stuiver M., et al., 1998, Radiocarbon 40, 1041
- Tanvir et al. (2005) Tanvir N., Chapman R. Levan A., Priddey R., 2005, Nat 438, 991
- Thomas et al. (2005) Thomas B.C., Melott, A.L., Jackman, C.H., et al., 2005, ApJ 634, 509
- Zhang et al. (2011) Zhang, B., Zhang, B., Liang, E.W., et al., 2011, ApJ 730, 141