–
Waldmeier relations and the solar cycle dynamics by the mean-field dynamos
Abstract
The long-term variability of the sunspot cycle, as recorded by the Wolf numbers, are imprinted in different kinds of statistical relations which relate the cycle amplitudes, duration and shapes. This subject always gets a special attention because it is important for the solar activity forecast. We discuss statistical properties of the mean-field dynamo model with the fluctuating -effect. Also, we estimate dynamical properties of the model for the long and short time-scale and compare it with the dynamics of the sunspot numbers data sets.
keywords:
Solar activity, Sun: magnetic field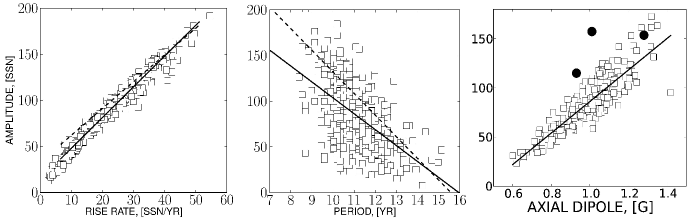
1 Waldmeier relations by the mean-field dynamos
Recently, Pipin & Kosovichev (2011) showed that the Waldmeier relations can be explained by the mean field dynamo model with a variable magnitude of the -effect. The idea was elaborated further by Pipin & Sokoloff (2011) and Pipin et al. (2012) for dynamo models that take into account the fluctuating -effect. Figure 1 shows some of the results obtained in those papers. Note, that the model reproduces the Gnevyshev-Ohl rule as well (Pipin et al, 2012). We suggest that the obtained statistical relations can be interpreted as an evidence for the solar cycle to be a nonlinear self-excited oscillation that tends to preserve the property of the attractor under random perturbations. The strength of the link between the parameters of the subsequent cycles is controlled by the fluctuation amplitude and by the perturbation’s decrement. The latter strongly depends on the nonlinear mechanisms involved in the dynamo.
2 The correlation dimension and Lyapunov exponents
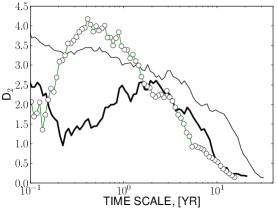
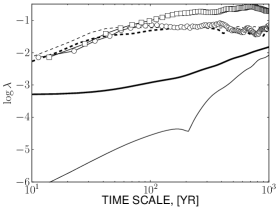
Bearing in mind the results discussed above, we tried to estimate some of the nonlinear characteristics of the dynamo models, such as the largest Lyapunov exponent, , and the correlation dimension . The first one shows the growth rate of deviations from a nominal cycle with time (see, e.g., Kantz & Schreiber 2004). The correlation dimension quantifies the topological complexity of the dynamical trajectories in the attractor.
Figure 2 (left) shows the correlation dimension for the time series yielded by different types of nonlinear dynamo models (those include the dynamical quenching due to magnetic helicity), including the 1D- and 2D models. We observe that in all the data sets the value of decreases to zero when the time scale approach the period of the cycle. The internal dynamics of 1D model (which anyway fails to reproduce the Waldmeier relations) differs from the 2D case. This is confirmed by the results for the Lyapunov exponent spectrum which are shown at the right panel in Figure 2. The synthetic SSN data (Solanki et al, 2004) shows no exponential dynamics on the long-time scale. Dynamo models have it on the short-time scale but lose on the long-time scale. This is resulted from the different time resolutions of the data sets. For comparison we put the spectrum for the simulated the 1D Brownian motion process. This lead us to conclusion that on the long time scale the sunspot activity looks like a random walk. The same behaviour is caught by the nonlinear dynamo models with fluctuations.
Acknowledgments. VVP and DDS thank for the support the RFBR grants 12-02-00170-a. VVP thanks the support of the Integration Project of SB RAS N 34, and support of the state contracts 02.740.11.0576, 16.518.11.7065 of the Ministry of Education and Science of Russian Federation.
References
- [] Kantz, H. & Schreiber, T. 2004, Nonlinear Time-Series Analysis, CUP, UK
- [] Pipin, V. V. & Kosovichev, A. G. 2011, ApJ, 741, 1
- [] Pipin, V.V., & Sokoloff, D.D. 2011, Phys. Scripta, 84, 065903
- [] Pipin, V.V., Sokoloff, D.D., & Usoskin, I.G. 2012, A&A, 542, A26
- [] Solanki, S. K., Usoskin, I. G., Kromer, B., Schüssler, M., & Beer, J. 2004, Nature, 431, 1084