Shape Evolution of Massive Early-Type Galaxies: Confirmation of Increased Disk Prevalence at
Abstract
We use high-resolution -band VLT/HAWK-I imaging over 0.25 square degrees to study the structural evolution of massive early-type galaxies since . Mass-selected samples, complete down to such that ‘typical’ () galaxies are included at all redshifts, are drawn from pre-existing photometric redshift surveys. We then separated the samples into different redshift slices and classify them as late- or early-type galaxies on the basis of their specific star-formation rate. Axis-ratio measurements for the 400 early-type galaxies in the redshift range are accurate to 0.1 or better. The projected axis-ratio distributions are then compared with lower redshift samples. We find strong evidence for evolution of the population properties: early-type galaxies at are, on average, flatter than at and the median projected axis ratio at a fixed mass decreases with redshift. However, we also find that at all epochs the very most massive early-type galaxies () are the roundest, with a pronounced lack among them of galaxies that are flat in projection. Merging is a plausible mechanism that can explain both results: at all epochs merging is required for early-type galaxies to grow beyond , and all early types over time gradually and partially loose their disk-like characteristics.
Subject headings:
galaxies: evolution — galaxies: formation — galaxies: structure — galaxies: elliptical and lenticular, cD — cosmology: observations1. Introduction
In our theory of galaxy formation, the initial angular momentum, radiative energy loss of the gas, and some degree of angular momentum conservation result in gas settling into disks before most of the stars form, which makes for oblate, rotating stellar systems. Observationally, all but the most massive galaxies in the present-day universe have a disk-like structure and are rotating (Dressler, 1980; Kormendy & Djorgovski, 1989; Marinoni et al., 1999; Krajnović et al., 2008; Holden et al., 2009; Emsellem et al., 2011; Cheng et al., 2011).
Nonetheless, even in disk-like, rotating galaxies, many stars reside in pressure-supported bulges. Photometric decompositions indicate that in the present-day Universe 587% of stars are in the spheroids and 427% are in the disks (Benson et al., 2007). Violent mergers are thought to scramble the orbits that originally were formed and lived in disks (Toomre, 1977; White & Rees, 1978; Joseph & Wright, 1985; Schweizer et al., 1990; Kauffmann et al., 1993; Steinmetz & Navarro, 2002). This process dominates the evolution of the most massive galaxies, which do not show evidence for disks and are generally round and entirely supported by pressure instead of rotation (Jorgensen & Franx 1994; Vincent & Ryden 2005; van der Wel et al. (2009b, hereafter vdW09); Bernardi et al. 2011; Emsellem et al. 2011; Holden et al. (2012, hereafter H12)).
In this paper we use a low specific star formation as the definition of early-type galaxy, motivated by the smooth appearance of the light profiles of galaxies with little or no young stars or (star-forming) gas. Early-type galaxies show a relatively abrupt change in their structure as a function of galaxy mass. vdW09 and H12 show that galaxies with have a broad projected axis-ratio distribution, indicative of a disk-like stellar body (with typical short-to-long intrinsic axis ratio about 1:3). In contrast, early-type galaxies with rarely appear highly flattened, suggesting that their formation channel destroyed any pre-existing stellar disks, with ‘dry’ merging between generally gas-poor progenitors as a very plausible mechanism.
Such ‘dry’ mergers can reconcile the relatively late, and continuous, assembly of massive early types with their old, passively evolving stellar populations. In addition, the observed small radii and high densities of early-type galaxies at redshifts (e.g., van Dokkum et al., 2008; van der Wel et al., 2008) can also be explained by ‘dry’ merging (e.g., Khochfar & Silk, 2006; van der Wel et al., 2009a; Hopkins et al., 2010). Minor mergers are plausibly the driver of size growth, given that major mergers are less efficient in ‘puffing up’ galaxies (e.g., Bezanson et al., 2009), such that major merging would overproduce the number of massive galaxies in the present-day universe (e.g., McLure et al., 2012). Given the strong evidence for continuous evolution of the number of early-type galaxies (e.g., Bell et al., 2004; Faber et al., 2007) and size evolution, one may expect that their structural properties also evolve, especially if merging is invoked as an evolutionary mechanism. To test this, H12 compared the axis-ratio distribution of a large sample of early-type galaxies at with that of the local population, but found no evidence for shape evolution for masses larger than . However, there could be shape evolution at higher redshifts, as major merging occurred more frequently at early epochs (e.g., Robaina et al., 2010) and the early-type galaxy number was much lower at than it is today.
van der Wel et al. (2011, hearafter vdW11) showed that a good portion of a small sample of early-type galaxies appeared flat in projection, indicative of a disk-like structure. Chevance et al. (2012) point out that existing, samples are too small to confirm or rule out evolution in the axis ratio distribution, but they attest, based on the Sérsic index distribution, that these galaxies have more disk-like structural properties than present-day early-type galaxies. Recently, Bruce et al. (2012) used bulge-disk decompositions of massive early-type galaxies at to show that many of them host pronounced disks. Whitaker et al. (2012) show a hint of an evolving axis ratio distribution of early-type galaxies out to , but these authors did not explore this in detail.
In this paper we explore the (projected) shapes for a large sample (400 objects) of early-type galaxies, selected to have masses and low star formation rates (, see Section 2.5.), which were drawn from a wide, high-resolution, near-infrared (-band) imaging mosaic from VLT/HAWK-I; we investigate whether early-type galaxies at show evolution in structure compared to present-day counterparts. Specifically, we will address the question whether early-type galaxies are more or less disk-like than at the present epoch, and whether early-type galaxies at those epochs also become rounder with increasing mass, as seen today.
The structure of this paper is as follows. In § 2 we describe the data and select our sample of early-type galaxies. In § 3 we analyze the projected axis-ratio distribution and its evolution since . In § 4 we summarize our conclusions.
In this paper, we use AB magnitudes and adopt the cosmological parameters (,,)=(0.3,0.7,0.7).
2. Data
The first step is to compile a catalog with photometric redshifts and stellar masses of galaxies in the extended Chandra Deep Field South (ECDFS) from MUSYC (Multiwavelength Survey by Yale-Chile, Taylor et al., 2009; Cardamone et al., 2010). Then we use high-resolution VLT/HAWK-I K-band imaging available over essentially the full E-CDFS (ESO Program ID: 082.A-0890) to determine structural parameter (sizes, Sérsic indices and projected axis ratios) for these galaxies. The high fidelity of these measurements, verified through the comparison with results from HST imaging, allows us to select early-type galaxies up to .
2.1. Multi-Wavelength Data and SED Fitting
MUSYC compiled observations in 32 bands, ranging from the UV to the near-infrared for the ECDFS, for which Cardamone et al. (2010) provide an optically selected catalog that we use here. We use the method and algorithms described by Wuyts et al. (2011a) to infer photometric redshifts, stellar masses and rest-frame colors. Briefly, to estimate photometric redshifts () we use EAzY (Brammer et al., 2008), and to estimate stellar masses, star-formation rates, and rest-frame colors we use FAST (Kriek et al., 2009). We only include objects with significant detection of , and -band imaging, and reject stars by choosing only objects with . We adopt the Bruzual & Charlot (2003) model, and a Chabrier (2003) stellar Initial Mass Function. A range of ages, star formation histories and extinction parameters is explored. This parent catalog contains 19642 objects.
H12 independently determined the stellar masses of early-type galaxies in the ECDFS in the redshift range . Those mass estimates are designed to match the stellar mass estimates of present-day early-type galaxies. Since we aim to do the same we add 0.1 dex to all our stellar mass estimates to correct for the median difference between the galaxies that are included both in our parent sample and the H12 sample. This correction is likely incorrect for star-forming galaxies, but those are not considered in this work. A full investigation of the absolute mass scale for is beyond the scope of this paper.
Star formation rates (SFRs) were derived following the procedures outlined in Wuyts et al. (2011b). Briefly, the unobscured SFR traced by the was added to the dust-reemitted SFR inferred from FIDEL 24 photometry (Magnelli et al., 2009) for 24 -detected sources, and for sources without 24 detection a dust-corrected SFR was derived from stellar population modeling of the U-to-8 SED.
2.2. High-Resolution, Near-Infrared VLT/HAWK-I imaging
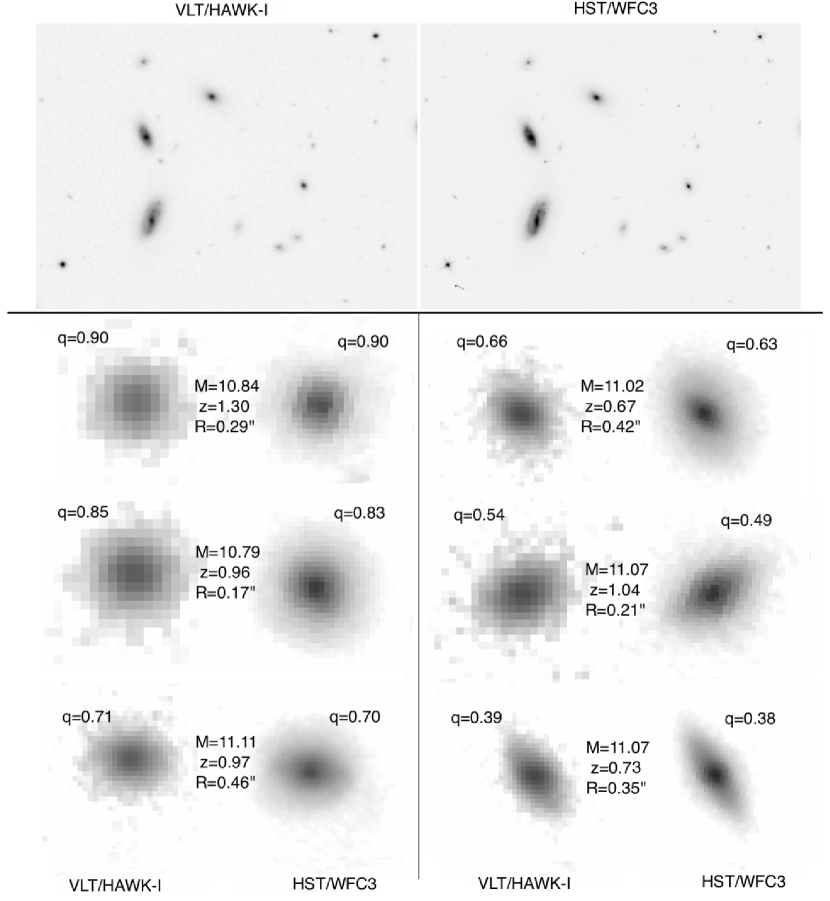
High-resolution -band imaging from VLT/HAWK-I, is central to our study to provide the structural parameters. We have obtained 1-hour exposures for each of 16 adjacent tiles in a 30’30’ mosaic that covers the full ECDFS (Taylor et al., 2009), which is coincident with the HST/ACS coverage from GEMS (Galaxy Evolution from Morphologies and SEDs, Rix et al., 2004). Observation and reduction of the HAWK-I images have been performed by S. Z. using a customized pipeline based on the original version distributed by ESO. Most notably we implemented improved recipes for the construction of the master flat field and for the frame coaddition, which properly take into account object masks and variance maps. The new effective mask implementation in particular eliminates the effects of background over-subtraction which is often seen in correspondence of (bright) sources. The 5- point source limit is (AB)=24.3, and the Point Spread Function (PSF) has a FWHM of 0.5” or smaller across the field. At that resolution, this ground-based -band imaging allows us to quantify the rest-frame optical structural properties of galaxies with spatial resolution that differs by no more than a factor of from that obtained with HST/WFC3 in the -band (see Figure 1). The image quality of our data is substantially better than the 0.6-0.7” seeing data used by Whitaker et al. (2012).
2.3. Galaxy Structural Parameters
| ID | M [] | ||||
|---|---|---|---|---|---|
| 4032 | 1.15 | 10.72 | 20.68 | 0.25 | 0.49 |
| 4213 | 1.11 | 10.73 | 20.25 | 0.35 | 0.83 |
| 4619 | 1.00 | 10.87 | 21.72 | 0.09 | 0.87 |
| 4844 | 1.59 | 10.94 | 20.94 | 0.35 | 0.56 |
| 5375 | 1.13 | 11.33 | 19.46 | 0.44 | 0.96 |
| . | . | . | . | . | . |
| . | . | . | . | . | . |
| . | . | . | . | . | . |
We use GALAPAGOS (Galaxy Analysis over Large Areas: Parameter Assessment by GALFITting Objects from SExtractor, Barden et al., 2012) to separately process each of the 16 HAWK-I tiles. Here we briefly describe the process as relevant for the present study. For a full description, see Barden et al. (2012). GALAPAGOS first constructs a catalog with SExtractor (Software for source extraction, Bertin & Arnouts, 1996). We choose the SExtractor detection parameters such that the catalog is only complete down to K(AB)=23: as we will demonstrate below this is well beyond the limit down to which structural parameters can accurately be determined. GALAPAGOS then creates image and noise cutouts for each object, including neighboring objects as necessary. The noise map is obtained from the variance map that was produced for each of the HAWK-I tiles. The background is estimated for each object by identifying a set of sky pixels that are not influenced by any of the objects in the catalog.
For each of the 16 tiles a single star is taken as the PSF, chosen among the 5 brightest, isolated stars in each tile. This choice is made after subtracting a flux-scaled version of each of those 5 stars from 25 stars in a tile and examining the residuals from this fit. The star that produces the cleanest residuals is selected as the PSF for that tile.
Then GALFIT (v3.0.3, Peng et al., 2002, 2010a) is called to perform the actual measurement of the structural parameters. A single Sérsic profile is fit to each target object. Neighboring objects are either masked or fit simultaneously. The free parameters in the fit are position, magnitude (), effective radius as measured along the major axis (), Sérsic index (), axis ratio (), and position angle. The input values of these parameters are taken from the SExtractor catalog (with the exception of , for which 2.5 is adopted).
2.4. Precision and Accuracy of Axis-Ratio Measurements
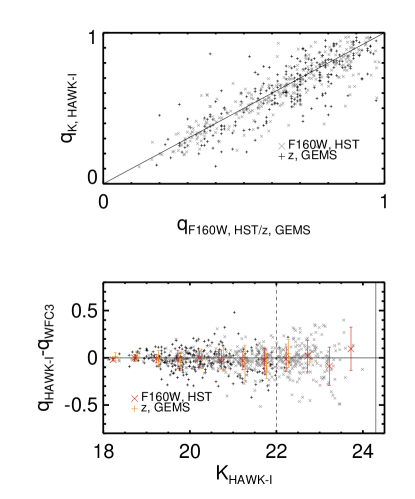
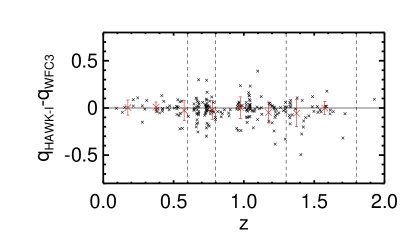
Our ability to determine axis ratios for distant galaxies is the limiting factor in our study. To establish the precision and accuracy of our measurements we compare the axis ratios inferred from the HAWK-I imaging with those from GEMS(Häussler et al., 2007) for galaxies in the redshift range (the sample from H12). The wavelength difference between GEMS (z-band) and HAWK-I (-band) could cause intrinsic differences between axis-ratio measurements that cannot be attributed to measurement errors. For this reason, we also compare with the axis ratio estimates from objects in our sample that are contained with HST/WFC3 F160W imaging from ERS (Windhorst et al., 2011). GALAPAGOS is deployed in a similar fashion as described above – full details will be provided by van der Wel (2012, in prep.). Through the comparison with HST/ACS and HST/WFC3 (see Figure 2) we find that the precision of our HAWK-I axis ratio estimates is better than 10% for galaxies brighter than K(AB)=22. In addition, we see no systematic difference between HST and VLT measurements shown in Figure 2. The differences in the median are -0.019 and -0.025, respectively. Our axis-ratio measurements remain accurate over the entire magnitude range of our sample. In Figure 3 we show that, in addition, the accuracy of our axis ratio measurements does not depend on redshift.
2.5. Sample Selection
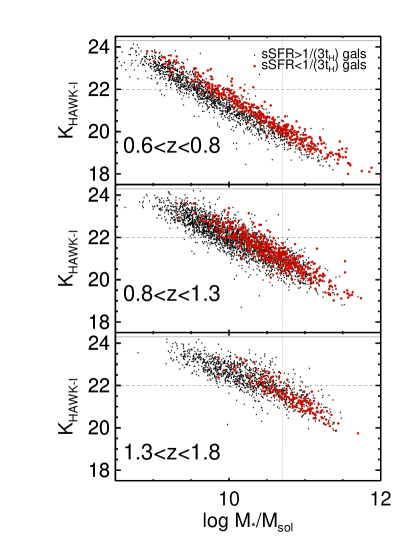
We match the MUSYC-based catalog (containing photometric redshifts and stellar population properties) with the HAWK-I based catalog (containing -band magnitudes and structural parameters) by searching within apertures with radius 1”. In Figure 4 we show the distribution of -band magnitude as a function of stellar mass in three redshift bins. Given the magnitude limit of that we adopted to ensure precise axis-ratio measurements (see above), we find that our catalog is complete down to for all redshifts .
We select galaxies with stellar masses and redshifts , using spectroscopic redshifts when available, and, otherwise, photometric redshifts. We select as early-type galaxies those with specific star-formation rates () smaller than , where is the Hubble time at the photometric redshift of the galaxy. This is similar to the strategy adopted by H12, who also selected their samples by star-formation activity, rather than morphological appearance.
Visual morphological classifications are not possible for the galaxies in our sample as they are too faint. Automated classifiers based on, for example, concentration or Sérsic index have the problem that, by definition, they will select against disk-like objects. This motivates our choice to select early-type galaxies by their star-formation activity. This is justified further by the well-established agreement between morphological appearance and star formation activity at all redshifts (e.g., Bell et al., 2004), and the correlation between structure and star formation activity that is observed to persist out to at least (e.g., Szomoru et al., 2011; Patel et al., 2012).
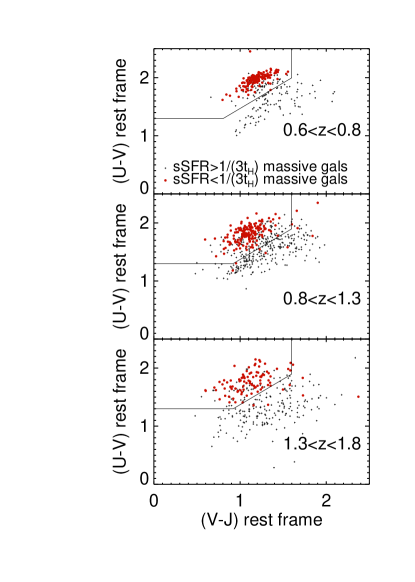
In Figure 5 we show that our selection technique is compatible with the rest-frame selection technique that is often adopted to identify passive, early-type galaxies (e.g, Wuyts et al., 2007; Williams et al., 2009). Almost all of our low sSFR galaxies would also be identified as early-type galaxies by selecting them in this diagram. There is a substantial number of galaxies in the ‘passive’ color-color box that are star forming according to our direct star formation estimates fits. This number is far larger than the number of galaxies with low star formation rates that are located outside the ‘passive’ color box. While we include the latter in our subsequent analysis, we note that this does not affect our results. Samples selected by , star-formation rate or a combination all have have the same median axis ratio within 0.05.
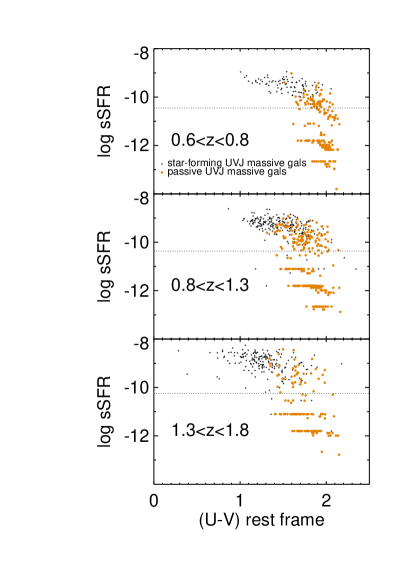
In Figure 6 we show the correlation between rest-frame color and sSFR. Even in our highest redshift bin the populations of star-forming and passive galaxies separate cleanly, which implies little cross-contamination between the two types of galaxies.
Finally, we visually inspected all GALFIT fitting results, rejecting 10 objects with corrupted fits. The final sample consists of 394 galaxies (see Table 2) in the redshift range , , and . There are 134, 163 and 97 galaxies in the redshift bins, , and , respectively.
| number | median | mean | stddev | median of | |
|---|---|---|---|---|---|
| (vdW11) | 14 | 0.665 | 0.681 | 0.186 | 1.69 |
| 97 | 0.634 | 0.612 | 0.200 | 1.38 | |
| 163 | 0.646 | 0.619 | 0.213 | 1.09 | |
| 134 | 0.734 | 0.662 | 0.222 | 0.69 | |
| (H12) | 533 | 0.710 | 0.692 | 0.179 | 0.69 |
| (vdW09) | 18316 | 0.719 | 0.692 | 0.181 | 0.06 |
3. Structural Evolution of Massive Early-Type Galaxies
We now examine two aspects of the structural evolution of early-type galaxies. First, we address the question whether the most massive galaxies are intrinsically round at redshifts , as is observed at by vdW09 and H12. Second, we address the question whether, in general, early-type galaxies are flatter or rounder (e.g., disk-like or bulge-like) at than at ; H12 showed that there is little evolution up to , but vdW11 presented tentative evidence for a higher incidence of disk-like early-type galaxies at .
3.1. The Mass-Dependence of Early-Type Galaxy Shapes up to
In Figure 7 we show the projected axis ratios of our sample of early-type galaxies as a function of their stellar mass, split into three redshift bins, each with galaxies.
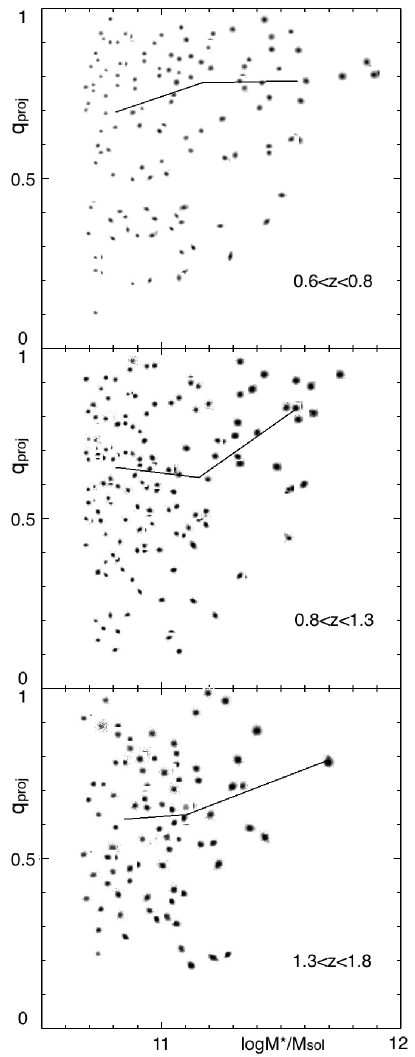
Qualitatively speaking, Figure 7 shows the same trend in all redshift bins: there appears to be a mass dependence for the projected axis-ratio, such as was seen in vdW09. As previously demonstrated by H12, at we find that the most massive () early-type galaxies are round in projection and we find a lack of objects that are flat in projection among the most massive early-type galaxies. In Figure 7 a similar trend is seen for early-type galaxies at : at and below masses of the galaxies in our sample show a broad range in axis ratios, whereas more massive galaxies are predominantly round. This is consistent with the conclusion reached by Targett et al. (2011), who found that very luminous radio galaxies at have morphological properties similar to today’s most massive elliptical galaxies in clusters.
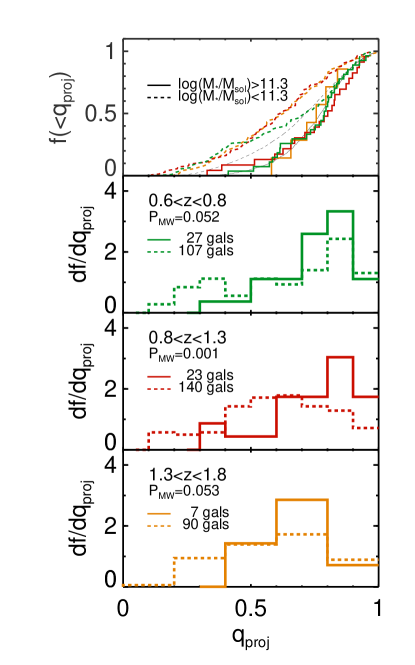
In Figure 8 we compare the axis-ratio distributions of galaxies with masses below and above . The Mann-Whitney U test shows that the trend seen in Figure 7 is marginally significant in each of the redshift bins. For the combined sample of galaxies at redshifts we find that the most massive galaxies are rounder than the less massive galaxies with high confidence (, i.e., a 3.66 result). For comparison, the equivalent value from the classifical Kolmogorov-Smirnov test is also low (, i.e., a 3.12 result).
Combining the results from vdW09, H12 and from this paper, we conclude that at all redshifts the most massive early-type galaxies are predominantly round in projection. This implies that at all these cosmological epochs the formation mechanism for such massive galaxies precludes the formation of or requires the destruction of pre-existing disks. Our interpretation is that merging, accompanied with little dissipation and star formation, has been the dominant formation channel for galaxies more massive than since . This process is reproduced in early-type galaxy formation models (e.g., Naab et al., 2009; Oser et al., 2012), and the observed major merger rates up to are consistent with theoretical expectations (e.g., Man et al., 2012).
3.2. Shape Evolution at
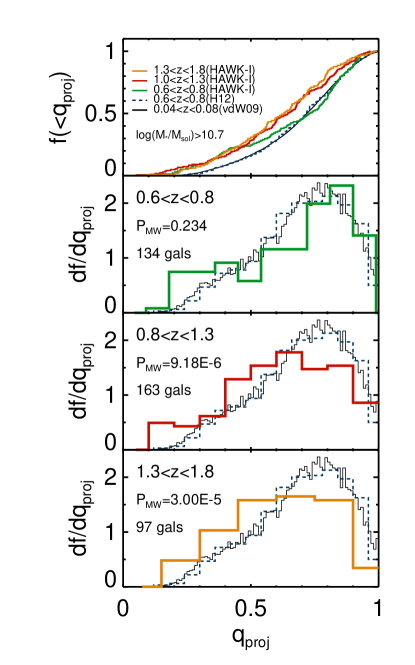
Now we turn to the question whether the structural population properties evolve with redshift. vdW11 found an indication of a high incidence of disk-like early-type galaxies at , but their sample is too small to confirm or rule out evolution with respect to the structure of early-type galaxies at the present day. In Figure 9 we compare the shape distributions of early-type galaxies with masses across a broad range in redshift, . We reproduce the lack of strong evolution in the range , reported by H12.
Vulcani et al. (2011) showed that cluster early-type galaxies are rounder at z=0.5-1 than in the local universe. This result is not necessarily at odds with our measurements: their signal is mostly driven by galaxies below our mass limit and, moreover, structural differences between cluster and field galaxies (e.g., van der Wel et al., 2010) can be explained by environmental processes such gas stripping that can produce flat early-type galaxies in clusters. An indication that the chosen mass range is relevant is that low-mass galaxies show stronger environmental dependencies in their properties than high-mass galaxies (see, e.g., Peng et al., 2010b). Observations over a broader range of environments and down to lower stellar masses than what is possible with our data set are required to address these issues.
| (vdW11) | - | 0.463 | 0.549 | 0.671 | 0.668 | 0.688 |
| 0.463 | - | 0.875 | *1.02E-2*[[footnotemark: a] | *2.58E-3* | *1.54E-4* | |
| 0.549 | 0.875 | - | *1.26E-2* | *8.93E-4* | *1.21E-4* | |
| 0.671 | *1.02E-2* | *1.26E-2* | - | 0.060 | 0.035 | |
| (H12) | 0.668 | *2.58E-3* | *8.93E-4* | 0.060 | - | 0.584 |
| (vdW09) | 0.688 | *1.54E-3* | *1.21E-4* | 0.035 | 0.584 | - |
| (vdW11) | - | 0.139 | 0.167 | 0.456 | 0.372 | 0.373 |
| 0.139 | - | 0.315 | *1.12E-2* [[footnotemark: a] | *1.20E-4* | *3.00E-5* | |
| 0.167 | 0.315 | - | *2.06E-2* | *8.71E-5* | *9.18E-6* | |
| 0.456 | *1.12E-2* | *2.06E-2* | - | 0.249 | 0.234 | |
| (H12) | 0.372 | *1.20E-4* | *8.71E-5* | 0.249 | - | 0.445 |
| (vdW09) | 0.381 | *3.00E-5* | *9.18E-6* | 0.234 | 0.445 | - |
However, in our higher redshift bins () we see an excess of flat galaxies and a detectable evolution compared to the samples. A Kolmogorov-Smirnov (K-S) and Mann-Whitney U (M-W) tests shows that this trend is highly significant (see Tables 3 and 4). Note that the axis ratio distribution from vdW11, due to their small sample size, is consistent with both the low- and high-z axis ratio distributions we analyze here.
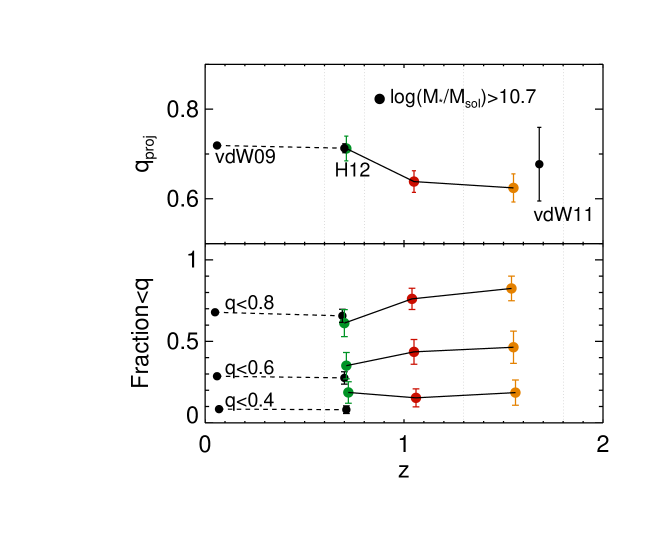
Figure 10 summarizes the observed evolution in the mean projected shape of early type galaxies. Beyond we see a gradual decrease in the median axis ratio of early-type galaxies, which is the result of an increased fraction of galaxies with axis ratios smaller than 0.6. The observed axis-ratio distributions imply that the intrinsic thickness of the typical early-type galaxy is no more than about 0.4. In a forthcoming paper we will quantify this intrinsic shape through detailed modeling.
The observations presented here can now put on a firmer footing the claim by vdW11 that many high-redshift early-type galaxies display a disk-like structure and that, plausibly, these galaxies will grow into larger, intrinsically round galaxies through merging. The vdW11 sample had been too small to confirm or rule evolution at a fixed stellar mass, which is important in order to differentiate evolutionary paths that galaxies of a given mass take at different cosmic times. Even at the present-day, the typical early-type galaxy with a mass below is rather flattened (vdW09), which also corresponds to a disk-like kinematic structure (rotation) as shown by, for example, Emsellem et al. (2011). Here we show that such galaxies had yet thinner intrinsic shapes at . Good correspondence between rotation of the stellar body and flattening has been confirmed up to by van der Wel & van der Marel (2008). Although such confirmation is, so far, lacking at higher redshifts it is reasonable to assume that flattening implies rotation at all redshifts.
We note that beyond the simple observation that early-type galaxies, here defined as galaxies with little star-formation activity, are on average flatter at than at lower redshifts, we cannot distinguish between the different varieties of such galaxies – such as quiescent spirals, barred/ringed S0s, etc. – and their evolution.
Our results do not argue against a morphological transition that occurs along with the truncation of star formation, as argued by, for example, Bell et al. (2012) on the basis of the high Sérsic indices of quiescent galaxies: high-redshift early-type galaxies such as those studied here, despite the generally disk-like character inferred from their axis ratio distribution, are not pure disks and have higher Sérsic indices than star forming galaxies (e.g., Wuyts et al., 2011a). Based on bulge-disk decompositions, Bruce et al. (2012) arrive at the conclusion that the early-type galaxy population at is mix of bulge- and disk-dominated galaxies, indicating that the transition from actively star-forming to quiescent need not always coincide with the formation of a dominant bulge. Taken together, these observations are consistent with a picture in which gas had time to settle in a disk before star formation was truncated, and that this disk wholly or partially survived the process that truncated star formation.
4. Conclusions
We measured the projected axis ratios from VLT/HAWK-I -band imaging of a sample of early-type galaxies in the redshift range selected by their low specific star formation rates. We find that at all redshifts the most massive galaxies are predominantly round. The lack of very massive, highly flattened galaxies suggests a universal ceiling mass for the formation of disks, independent of cosmic epoch. In order for galaxies to grow beyond this ceiling mass, separate evolutionary channel, presumably merging, has to be invoked.
In the full sample (), we find, at all redshifts, a large range in projected axis ratios, reflecting a more disk-like structure. In addition, we find quantitative evidence that early-type galaxies at are more disk-like than their equally massive, present-day counterparts. Therefore, for most early-type galaxies gas had time to settle into a disk before star formation ceased to produce a more passive galaxy. Plausibly, such galaxies grow in mass over time, through mostly dissipationless merging and accretion of satellites, losing some of the angular momentum, and growing in size.
References
- Barden et al. (2012) Barden, M., Häußler, B., Peng, C. Y., McIntosh, D. H., & Guo, Y. 2012, MNRAS, 422, 449
- Bell et al. (2004) Bell, E. F., et al. 2004, ApJ, 608, 752
- Bell et al. (2012) —. 2012, ApJ, 753, 167
- Benson et al. (2007) Benson, A. J., Džanović, D., Frenk, C. S., & Sharples, R. 2007, MNRAS, 379, 841
- Bernardi et al. (2011) Bernardi, M., Roche, N., Shankar, F., & Sheth, R. K. 2011, MNRAS, 412, 684
- Bertin & Arnouts (1996) Bertin, E., & Arnouts, S. 1996, A&AS, 117, 393
- Bezanson et al. (2009) Bezanson, R., van Dokkum, P. G., Tal, T., Marchesini, D., Kriek, M., Franx, M., & Coppi, P. 2009, ApJ, 697, 1290
- Brammer et al. (2008) Brammer, G. B., van Dokkum, P. G., & Coppi, P. 2008, ApJ, 686, 1503
- Bruce et al. (2012) Bruce, V. A., et al. 2012, MNRAS, in press (arXiv:1206.4322)
- Bruzual & Charlot (2003) Bruzual, G., & Charlot, S. 2003, MNRAS, 344, 1000
- Cardamone et al. (2010) Cardamone, C. N., et al. 2010, ApJS, 189, 270
- Chabrier (2003) Chabrier, G. 2003, PASP, 115, 763
- Cheng et al. (2011) Cheng, J. Y., Faber, S. M., Simard, L., Graves, G. J., Lopez, E. D., Yan, R., & Cooper, M. C. 2011, MNRAS, 412, 727
- Chevance et al. (2012) Chevance, M., Weijmans, A.-M., Damjanov, I., Abraham, R. G., Simard, L., van den Bergh, S., Caris, E., & Glazebrook, K. 2012, ApJ, 754, L24
- Dressler (1980) Dressler, A. 1980, ApJ, 236, 351
- Emsellem et al. (2011) Emsellem, E., et al. 2011, MNRAS, 414, 888
- Faber et al. (2007) Faber, S. M., et al. 2007, ApJ, 665, 265
- Häussler et al. (2007) Häussler, B., et al. 2007, ApJS, 172, 615
- Holden et al. (2012) Holden, B. P., van der Wel, A., Rix, H.-W., & Franx, M. 2012, ApJ, 749, 96
- Holden et al. (2009) Holden, B. P., et al. 2009, ApJ, 693, 617
- Hopkins et al. (2010) Hopkins, P. F., Bundy, K., Hernquist, L., Wuyts, S., & Cox, T. J. 2010, MNRAS, 401, 1099
- Jorgensen & Franx (1994) Jorgensen, I., & Franx, M. 1994, ApJ, 433, 553
- Joseph & Wright (1985) Joseph, R. D., & Wright, G. S. 1985, MNRAS, 214, 87
- Kauffmann et al. (1993) Kauffmann, G., White, S. D. M., & Guiderdoni, B. 1993, MNRAS, 264, 201
- Khochfar & Silk (2006) Khochfar, S., & Silk, J. 2006, MNRAS, 370, 902
- Kormendy & Djorgovski (1989) Kormendy, J., & Djorgovski, S. 1989, ARA&A, 27, 235
- Krajnović et al. (2008) Krajnović, D., et al. 2008, MNRAS, 390, 93
- Kriek et al. (2009) Kriek, M., van Dokkum, P. G., Labbé, I., Franx, M., Illingworth, G. D., Marchesini, D., & Quadri, R. F. 2009, ApJ, 700, 221
- Magnelli et al. (2009) Magnelli, B., Elbaz, D., Chary, R. R., Dickinson, M., Le Borgne, D., Frayer, D. T., & Willmer, C. N. A. 2009, A&A, 496, 57
- Man et al. (2012) Man, A. W. S., Toft, S., Zirm, A. W., Wuyts, S., & van der Wel, A. 2012, ApJ, 744, 85
- Marinoni et al. (1999) Marinoni, C., Monaco, P., Giuricin, G., & Costantini, B. 1999, ApJ, 521, 50
- McLure et al. (2012) McLure, R. J., et al. 2012, MNRAS, in press (arXiv:1205.4058)
- Naab et al. (2009) Naab, T., Johansson, P. H., & Ostriker, J. P. 2009, ApJ, 699, L178
- Oser et al. (2012) Oser, L., Naab, T., Ostriker, J. P., & Johansson, P. H. 2012, ApJ, 744, 63
- Patel et al. (2012) Patel, S. G., et al. 2012, ArXiv e-prints
- Peng et al. (2002) Peng, C. Y., Ho, L. C., Impey, C. D., & Rix, H.-W. 2002, AJ, 124, 266
- Peng et al. (2010a) —. 2010a, AJ, 139, 2097
- Peng et al. (2010b) Peng, Y.-j., et al. 2010b, ApJ, 721, 193
- Rix et al. (2004) Rix, H.-W., et al. 2004, ApJS, 152, 163
- Robaina et al. (2010) Robaina, A. R., Bell, E. F., van der Wel, A., Somerville, R. S., Skelton, R. E., McIntosh, D. H., Meisenheimer, K., & Wolf, C. 2010, ApJ, 719, 844
- Schweizer et al. (1990) Schweizer, F., Seitzer, P., Faber, S. M., Burstein, D., Dalle Ore, C. M., & Gonzalez, J. J. 1990, ApJ, 364, L33
- Steinmetz & Navarro (2002) Steinmetz, M., & Navarro, J. F. 2002, New Astronomy, 7, 155
- Szomoru et al. (2011) Szomoru, D., Franx, M., Bouwens, R. J., van Dokkum, P. G., Labbé, I., Illingworth, G. D., & Trenti, M. 2011, ApJ, 735, L22
- Targett et al. (2011) Targett, T. A., Dunlop, J. S., McLure, R. J., Best, P. N., Cirasuolo, M., & Almaini, O. 2011, MNRAS, 412, 295
- Taylor et al. (2009) Taylor, E. N., et al. 2009, ApJS, 183, 295
- Toomre (1977) Toomre, A. 1977, ARA&A, 15, 437
- van der Wel et al. (2010) van der Wel, A., Bell, E. F., Holden, B. P., Skibba, R. A., & Rix, H.-W. 2010, ApJ, 714, 1779
- van der Wel et al. (2009a) van der Wel, A., Bell, E. F., van den Bosch, F. C., Gallazzi, A., & Rix, H.-W. 2009a, ApJ, 698, 1232
- van der Wel et al. (2008) van der Wel, A., Holden, B. P., Zirm, A. W., Franx, M., Rettura, A., Illingworth, G. D., & Ford, H. C. 2008, ApJ, 688, 48
- van der Wel et al. (2009b) van der Wel, A., Rix, H.-W., Holden, B. P., Bell, E. F., & Robaina, A. R. 2009b, ApJ, 706, L120
- van der Wel & van der Marel (2008) van der Wel, A., & van der Marel, R. P. 2008, ApJ, 684, 260
- van der Wel et al. (2011) van der Wel, A., et al. 2011, ApJ, 730, 38
- van Dokkum et al. (2008) van Dokkum, P. G., et al. 2008, ApJ, 677, L5
- Vincent & Ryden (2005) Vincent, R. A., & Ryden, B. S. 2005, ApJ, 623, 137
- Vulcani et al. (2011) Vulcani, B., et al. 2011, MNRAS, 413, 921
- Whitaker et al. (2012) Whitaker, K. E., Kriek, M., van Dokkum, P. G., Bezanson, R., Brammer, G., Franx, M., & Labbé, I. 2012, ApJ, 745, 179
- White & Rees (1978) White, S. D. M., & Rees, M. J. 1978, MNRAS, 183, 341
- Williams et al. (2009) Williams, R. J., Quadri, R. F., Franx, M., van Dokkum, P., & Labbé, I. 2009, ApJ, 691, 1879
- Windhorst et al. (2011) Windhorst, R. A., et al. 2011, ApJS, 193, 27
- Wuyts et al. (2007) Wuyts, S., et al. 2007, ApJ, 655, 51
- Wuyts et al. (2011a) —. 2011a, ApJ, 742, 96
- Wuyts et al. (2011b) —. 2011b, ApJ, 738, 106