Cyanogen in NGC 1851 RGB and AGB Stars: Quadrimodal Distributions
Abstract
The Galactic globular cluster NGC 1851 has raised much interest since HST photometry revealed that it hosts a double subgiant branch. Here we report on our homogeneous study into the cyanogen (CN) bandstrengths in the RGB population (17 stars) and AGB population (21 stars) using AAOmega/2dF spectra with R . We discover that NGC 1851 hosts a quadrimodal distribution of CN bandstrengths in its RGB and AGB populations. This result supports the merger formation scenario proposed for this cluster, such that the CN quadrimodality could be explained by the superposition of two ‘normal’ bimodal populations. A small sample overlap with an abundance catalogue allowed us to tentatively explore the relationship between our CN populations and a range of elemental abundances. We found a striking correlation between CN and [O/Na]. We also found that the four CN peaks may be paired – the two CN-weaker populations being associated with low Ba and the two CN-stronger populations with high Ba. If true then s-process abundances would be a good diagnostic for disentangling the two original clusters in the merger scenario. More observations are needed to confirm the quadrimodality, and also the relationship between the subpopulations. We also report CN results for NGC 288 as a comparison. Our relatively large samples of AGB stars show that both clusters have a bias towards CN-weak AGB populations.
Subject headings:
Stars: AGB and post-AGB — globular clusters: general — globular clusters: individual(NGC 1851, NGC 288)1. Introduction
Galactic globular clusters (GCs) are no longer thought to be perfectly homogeneous, simple stellar populations. Although almost all are chemically homogeneous with respect to Fe and heavier elements (omega Cen, M22, Terzan 5 and NGC 1851 being exceptions), it has long been known that GCs show large star-to-star abundance variations for light elements (e.g., C, N, O, Na, Mg, Al; see reviews by Kraft 1994; Gratton et al. 2004, 2012a). These inhomogeneities are considered anomalous because they are seen in very few halo field stars of similar metallicity (Gratton et al. 2000; Martell & Grebel 2010). Studies of all phases of evolution, including the red giant branch (RGB), main sequence (MS) and subgiant branch (SGB; e.g. in NGC 6752, Gratton et al. 2001), have shown the same anomalies. This suggests that many of the abundance variations arose in the early phases of cluster evolution.
Recently it was discovered that the globular cluster NGC 1851 has a double SGB, whereby two evolutionary sequences are clearly visible (HST photometry, Milone et al. 2008, 2009). The RGB has also been shown to split into two when using particular filters (Han et al., 2009). Spectroscopic observations of this cluster show bimodality in s-process abundances (Yong & Grundahl, 2008; Villanova et al., 2010; Gratton et al., 2012b) and a small spread in [Fe/H] (rms scatter dex, Carretta et al. 2011). Gratton et al. 2012b report that the two SGB populations have slightly different heavy element contents on average. Carretta et al. (2011) find they can split their RGB sample into a metal-rich and metal-poor population based on the Fe-Ba plane, and that each population has its own O-Na anticorrelation. This ties in well with the horizontal branch (HB) observations of Gratton et al. (2012c) who also report two separate O-Na anticorrelations. As an explanation for these abundance anomalies, as well as the bimodal HB, it has been suggested that NGC 1851 may be a product of a merger between two GCs (van den Bergh, 1996; Catelan, 1997; Carretta et al., 2010). Bekki & Yong (2012) recently showed that a merger scenario for NGC 1851 is dynamically plausible. For reviews on the phenomenon of multiple populations in GCs see e.g. Piotto (2009), Martell (2011) and Gratton et al. (2012a).
One of the first inhomogeneities discovered in globular clusters was that of the molecule cyanogen (CN, often used as a proxy for nitrogen). A picture of ‘CN-bimodality’ emerged in the 1970s and 80s (Hesser, 1978; Norris & Freeman, 1979; Cottrell & Da Costa, 1981) whereby stars in one population show weak absorption by CN (‘CN-weak’ stars) and stars in the the other show strong absorption by CN (‘CN-strong’ stars). This has been observed in most, if not all, clusters. With the recent interest in NGC 1851 there have been a couple of studies of CN, on the MS (Pancino et al., 2010) and the two SGBs (Lardo et al., 2012). There does however appear to be a dearth of studies of CN in giants in NGC 1851 – here we report on observations focusing on cyanogen band strengths in the RGB and AGB stars of NGC 1851.
2. Stellar Sample, Observations and Data Reduction
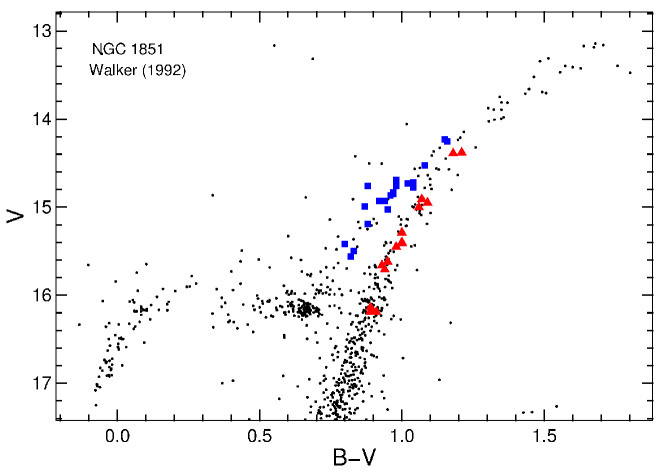
Our stellar sample was taken from the BV photometry catalogue of Walker (1992). This catalogue was chosen because the photometry is precise enough to distinguish between the RGB and AGB populations and because it provides accurate astrometry, an important feature for multi-fibre spectroscopy. The chosen sample of stars was cross-matched with the 2MASS catalogue (Skrutskie et al., 2006), thus all of our sample stars are actually 2MASS objects, with positions accurate to arcsec. Since the two giant branches merge in the CMD at higher luminosities we limited our RGB and AGB samples to V . We show our program stars against the Walker (1992) CMD in Figure 1 and provide a list in Table 1.
Our observational data were taken over the second halves of the nights of the 5th, 7th, 8th and 9th of September 2009 at the AAT using the multi-fibre spectrograph, AAOmega/2dF (Lewis et al. 2002; Saunders et al. 2004; Sharp et al. 2006). A total of 9 hours of exposures were taken, using 3 field plate setups. The 1700B grating was used on the blue arm of the spectrograph, which gave a spectral coverage of and includes the violet CN bands around Å. Spectral resolution in this region was R .
Data reduction was carried out using the 2dF pipeline software (version 3.211, April 2009) provided by the AAO. Tram-map fits to the multiple spectra from each plate were checked by eye, as were the arc reductions and final reduced science spectra. Our final sample of spectra contained 17 RGB and 21 AGB stars.
3. Results and Discussion
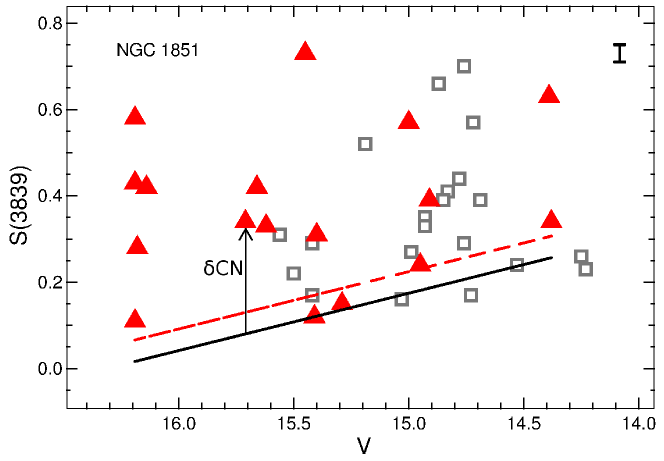
In Table 1 we list the S(3839) measurements for each star, while in Figure 2 we plot them versus V magnitude. CN absorption is known to have a temperature dependence so we have ‘de-trended’ the data in the same manner as in previous CN studies (e.g. Norris et al. 1981; Ivans et al. 1999; Martell et al. 2008) by fitting a line to the lower envelope of the observations. The value S(3839) (hereafter CN) is then the distance from this line to each data point. The resultant CN values are shown in the lower panel of Figure 3 and listed in Table 1. Errors in wavelength calibration or doppler offsets due to velocity dispersion were checked and found to be of order in CN. The much larger characteristic error bar for S(3839) given in the figures () reflects the typical differences between measurements of S(3839) in two observations of the same star. These pairs of observations were taken on different nights and with different field plates (other clusters in our broader observational campaign were used for this, but the data were taken during the same timeframe as for NGC 1851). We found that this was by far the largest source of error. This is probably to be expected since it reflects the combination of many sources of error, including the uncertainties of fibre placement, fibre throughput, slight pointing errors, seeing variability, as well as errors in the data reduction (for example).
| TYPE | ID(Walk.) | ID(2MASS) | ID(Carr.) | V | B-V | S(3839) | S(3839) |
|---|---|---|---|---|---|---|---|
| RGB | 24 | 05134832-4003151 | – | 15.40 | 1.00 | 0.31 | 0.19 |
| RGB | 28 | 05134897-4001199 | 41113 | 15.71 | 0.94 | 0.34 | 0.26 |
| RGB | 71 | 05135414-4003038 | 32112 | 15.45 | 0.98 | 0.73 | 0.62 |
| RGB | 79 | 05135462-4005094 | – | 15.29 | 1.00 | 0.15 | 0.01 |
| RGB | 120 | 05135671-4001016 | – | 15.00 | 1.06 | 0.57 | 0.40 |
| RGB | 151 | 05135828-3959586 | – | 16.19 | 0.90 | 0.43 | 0.41 |
| RGB | 160 | 05135866-4000178 | – | 16.14 | 0.89 | 0.42 | 0.40 |
| RGB | 161 | 05135867-4000120 | 44803 | 14.91 | 1.07 | 0.39 | 0.20 |
| RGB | 162 | 05135862-3959242 | 46228 | 16.19 | 0.91 | 0.11 | 0.09 |
| RGB | 208 | 05135977-4001374 | – | 15.66 | 0.93 | 0.42 | 0.33 |
| RGB | 368 | 05140259-4000220 | 44414 | 15.62 | 0.95 | 0.33 | 0.24 |
| RGB | 441 | 05140365-4001596 | – | 16.18 | 0.89 | 0.28 | 0.26 |
| RGB | 1028 | 05141052-3958095 | 47385 | 15.41 | 1.00 | 0.12 | 0.00 |
| RGB | 1256 | 05141724-4002080 | 37070 | 14.38 | 1.21 | 0.34 | 0.08 |
| RGB | 1284 | 05141956-4004055 | 26801 | 14.39 | 1.18 | 0.63 | 0.37 |
| RGB | 1286 | 05141947-4000076 | 44939 | 14.95 | 1.09 | 0.24 | 0.06 |
| RGB | 1323 | 05142281-4001551 | 38215 | 16.19 | 0.89 | 0.58 | 0.56 |
| AGB | 182 | 05135918-4002496 | – | 14.93 | 0.92 | 0.35 | 0.17 |
| AGB | 222 | 05140019-4002291 | – | 14.69 | 0.98 | 0.39 | 0.17 |
| AGB | 245 | 05140068-4003239 | 30315 | 14.53 | 1.08 | 0.24 | 0.00 |
| AGB | 430 | 05140355-4002499 | – | 15.03 | 0.95 | 0.16 | -0.01 |
| AGB | 506 | 05140446-4003113 | – | 14.76 | 0.88 | 0.29 | 0.08 |
| AGB | 572 | 05140508-4002278 | – | 15.56 | 0.82 | 0.31 | 0.21 |
| AGB | 633 | 05140584-4002126 | – | 14.25 | 1.16 | 0.26 | -0.01 |
| AGB | 680 | 05140659-4002026 | – | 14.78 | 1.04 | 0.44 | 0.24 |
| AGB | 697 | 05140701-4003449 | – | 14.73 | 1.02 | 0.17 | -0.04 |
| AGB | 741 | 05140758-4003164 | – | 15.50 | 0.83 | 0.22 | 0.11 |
| AGB | 848 | 05140883-4002380 | – | 14.23 | 1.15 | 0.23 | -0.05 |
| AGB | 849 | 05140900-4004539 | – | 14.83 | 0.97 | 0.41 | 0.21 |
| AGB | 887 | 05140916-4002296 | – | 14.99 | 0.87 | 0.27 | 0.09 |
| AGB | 988 | 05141034-4004235 | – | 14.76 | 0.98 | 0.70 | 0.49 |
| AGB | 989 | 05141026-4003150 | – | 15.42 | 0.80 | 0.17 | 0.05 |
| AGB | 1004 | 05141057-4003308 | – | 14.93 | 0.94 | 0.33 | 0.15 |
| AGB | 1014 | 05141035-3958148 | – | 14.72 | 1.04 | 0.57 | 0.36 |
| AGB | 1037 | 05141084-4001475 | – | 15.19 | 0.88 | 0.52 | 0.37 |
| AGB | 1172 | 05141351-4003408 | – | 14.87 | 0.96 | 0.66 | 0.47 |
| AGB | 1214 | 05141501-4003040 | – | 14.85 | 0.97 | 0.39 | 0.20 |
| AGB | 1246 | 05141641-4002214 | – | 15.42 | 0.80 | 0.29 | 0.17 |
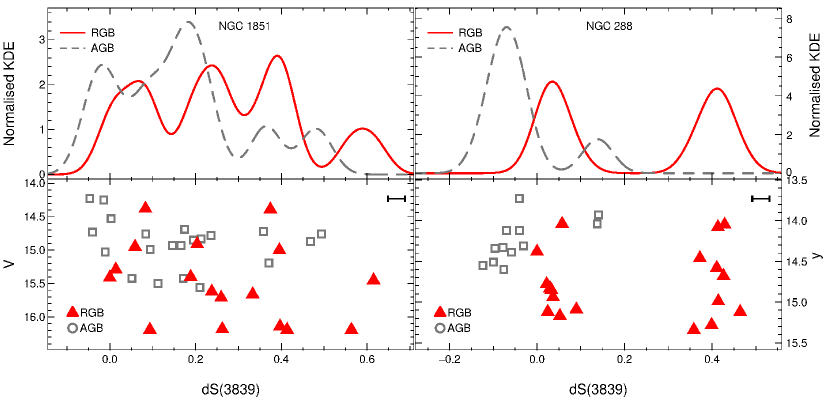
In the upper panel of Figure 3 we show a kernel density estimate (KDE) histogram of CN based on a Gaussian kernel with a bandwidth of 0.035. This bandwidth was found to be optimal taking into account the error bars and small number statistics. It was tested with many other similar datasets (Campbell et al., in prep.). It can be seen in Figure 3 that the distribution of CN in the RGB stars is quadrimodal, having four peaks. Changing the KDE bandwidth within reasonable limits () does not alter this result. This was an unexpected result because most clusters in our greater sample and in the literature show bimodal distributions. As a comparison, in the right-hand panels of Figure 3 we show the same plot but for NGC 288. The data for this cluster were taken in the same observing run and with the same instrument as our NGC 1851 data. We chose this cluster for comparison because it has a similar metallicity to NGC 1851 ([Fe/H versus , respectively) but a different horizontal branch (HB) morphology – NGC 1851 has a bimodal HB morphology while NGC 288 has a blue HB only. As can be seen in this Figure we find the standard bimodality in CN in the RGB population of NGC 288.
There is the possibility that the observed quadrimodality in our sample of NGC 1851 RGB stars is a chance occurrence due to a small sample size. A small random sample drawn from a bimodal distribution may give this result. To estimate the likelihood of this happening we conducted the following test. We established an arbitrary CN distribution consisting of two Gaussians with centres at 0.05 and 0.45 and FWHMs of 0.10. Samples of 17 stars were then randomly drawn from this distribution and the pseudo data was then smoothed with a Gaussian kernel having a bandwidth of 0.035. We repeated this 1000 times. The results from this test indicate that a small fraction () of the randomly generated samples do present quadrimodal distributions (although only 1 out of 1000 was as clearly defined as in the real data). Therefore we cannot eliminate the small probability that the observed CN distribution in the RGB population has been drawn from a bimodal population through chance. However the case for quadrimodality is strengthened by the AGB results in Figure 3 – the AGB population also appears to be quadrimodal in CN. Here the the stars are distributed differently though, with the majority of the AGB stars being in the two CN-weaker subpopulations, as is usually the case in GCs (e.g. NGC 288 in Fig. 3; Norris et al. 1981; Campbell et al. 2011). The probability for attaining a quadrimodal distribution in the RGB population and simultaneously in the AGB population by chance then becomes extremely small, since they are essentially independent populations with different internal distributions of CN.
It has been suggested that NGC 1851 may be a merger product between two GCs, initially as an explanation for producing its bimodal HB (van den Bergh, 1996; Catelan, 1997). In this scenario it would also be expected that each merging population would have two ‘normal’ subpopulations, each with its own C-N and O-Na (and possibly Mg-Al) anticorrelations, and that the superimposition of these populations would present dual anticorrelations. In the RGB study by Carretta et al. (2011) it is indeed found that NGC 1851 has two Na-O anticorrelations, one in their metal-rich population and one in their metal-poor population. This ties in well with the findings of the Gratton et al. (2012c) study where it was found that there are also two independent Na-O anticorrelations on the horizontal branch – one in the RHB population and one in the BHB population. With regards to C and N the picture is less clear. Lardo et al. (2012) studied the SGB populations and found a spread in C and N between stars. These elements were also found to be anticorrelated, however no bimodal signature was detected. The resolution of the spectra in that study was however quite low, with R . In the SGB study of Gratton et al. (2012b) it was found that the two subgiant branches have different average C abundances. Interestingly they also found that there are different proportions of C-normal and C-poor stars in each SGB, which may indicate that each SGB hosts multiple subpopulations, again suggestive of a merger scenario. In a study of the two RGB populations Villanova et al. (2010) found a spread in CNO elements but found no difference in C+N+O between the populations. Yong et al. (2009) did however find a significant variation (a factor of 4) in C+N+O in four RGB stars. Thus there is still uncertainty as to whether C+N+O is constant between populations or not. This is an important diagnostic since it is a very useful discriminant between possible polluters of the primordial material from which N-rich populations form. Cluster age determinations are also very sensitive to C+N+O (Rood & Crocker, 1985; Cassisi et al., 2008). More information/observations of CNO are needed to clarify the situation.
In the case of CN bandstrengths the merger scenario leads to a natural expectation that the two bimodal CN populations in the original clusters would also superimpose, giving a quadrimodal distribution. Thus our discovery of a quadrimodal distribution of CN band strengths in the RGB and AGB populations of NGC 1851 adds further weight to the merger formation scenario for this cluster. The CN quadrimodality also suggests that there may be four populations with different N abundances in this cluster. Although CN is generally accepted as a proxy for N we note that the band strengths may also be affected by the abundances of C and O. Thus, again, a complete set of (absolute) abundance observations including C, N, and O are needed.
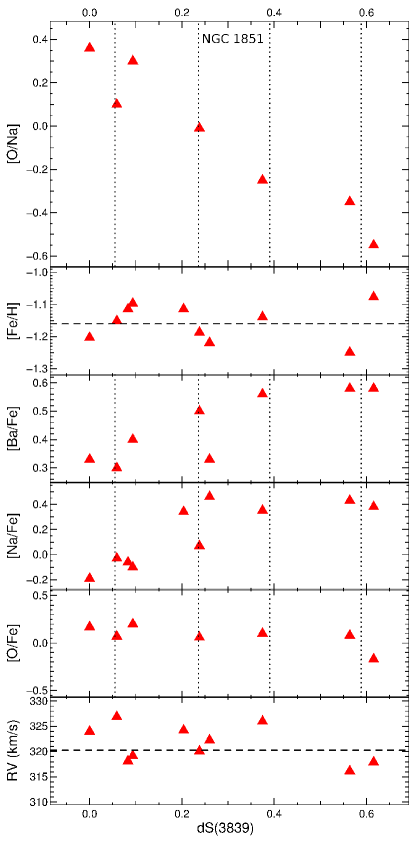
With a view to gaining more information about the four CN populations we performed a cross-match of our sample with the Carretta et al. (2011) catalogue of RGB star abundances. The catalogue contains 124 stars with a range of abundance measurements for p-capture, -capture, Fe-peak, and n-capture elements. Our cross-match found an overlap of 10 RGB stars and one AGB star (Table 1). Not all of the Carretta et al. (2011) objects have the full set of abundance results but for some abundances we have 7-10 stars to compare with. In Figure 4 we show various abundance ratios from Carretta et al. (2011) against our RGB CN values. In the second panel of Figure 4 it can be seen that there appears to be no correlation between our four CN groups and [Fe/H]. This is contrary to what we might expect from the SGB results of Gratton et al. (2012b) where it was found that the two SGB populations differ in average [Fe/H]. We note however that the cross-matched sample is very small, especially within each of the four subpopulations, which contain only 1-4 stars each. Sodium on the other hand shows a definite correlation with CN. This is typical of GC abundance anomalies, where N is higher in the stars with high Na. Barium also appears to correlate with CN. In contrast oxygen shows little variation with CN. By using the ratio [O/Na] the ‘noise’ of the Fe scatter can be removed, and the relationship between O and Na is amplified. We show [O/Na] in the top panel of Figure 4. Here there is a striking anticorrelation, such that the CN-weak populations show much higher O/Na ratios than the CN-strong populations. The lack of correlation between Fe (and Ca, Si, Ti - not shown) and the light elements + s-process elements suggests that the Fe-group (+ capture) nucleosynthetic source(s) are separate to the light element + s-process source(s). AGB stars are the most likely primordial source for the O, Na, CN and s-process enhancements. If the four populations are indeed real, then this suggests that each population was polluted by AGB star ejecta to differing degrees. We note that the star with intermediate [Ba/Fe is the only star in the sample with no K magnitude from the Carretta et al. (2011) database and thus may be an unreliable data point. If so, then Ba would present a bimodal distribution (panel 3 of Fig. 4). Importantly each mode of Ba abundance would be associated with two CN peaks: the two CN-weaker populations would be Ba-poor compared to the two CN-richer populations. This could be a useful diagnostic for disentangling the multiple populations in the merger scenario. Clear bimodalities in s-process abundances have been reported for the RGB (Yong & Grundahl 2008; Villanova et al. 2010) and the SGBs (Gratton et al. 2012b). Interestingly Carretta et al. (2011) do not report a bimodality in Ba but do show that s-process elements are (anti)correlated with p-capture elements. In the bottom panel of Figure 4 we show the radial velocities for the cross-matched sample. It can be seen that only the most extreme CN population stands out, having an average radial velocity km/s lower than the other three populations, which might suggest this group is kinematically distinct. Again we stress that this is a very small dataset so the discussion above is only speculative. We note that our group is in the process of collecting medium resolution, broad wavelength coverage spectra using 2dF/AAomega to complement the excellent Carretta et al. (2011) RGB dataset with C and N abundances. When complete the combined dataset will allow a ‘holistic’ analysis (including absolute abundances of C, N, O and therefore the sum C+N+O) of the abundance and population trends for NGC 1851 red giants.
4. Summary and Conclusions
We have recorded a homogeneous set of spectra for 17 RGB and 21 AGB stars in the globular cluster NGC 1851. We find that the CN band strengths divide into four groups in both the RGB and AGB populations. This lends support to the theory that NGC 1851 formed from a merger of two clusters since one of the expected signatures of this would be two superimposed bimodal distributions in CN.
We cross-matched our sample with that of the high resolution study of Carretta et al. (2011) and found a small number of stars in common. This gave us the opportunity to compare elements that typically (anti)correlate with N in globular clusters, such as O, Na and Ba. We found that Na did indeed correlate with CN. An anticorrelation [O/Fe] was less clear but when considering [O/Na] it was found that there was a very strong anticorrelation. A possible correlation with Ba was observed. The (anti)correlations between these elements and CN (and thus presumably N and hence C) suggest that the material from which each of the four populations formed was polluted by AGB stars. We also speculated that the Ba distribution may be bimodal, as found in previous studies. If so, then the two CN-weaker and two CN-richer populations would be paired, and this may reflect a distinction between the two GCs in the merger hypothesis. It must be noted that the comparison sample is small, so strong conclusions could not be made. Large-sample, high-resolution observations combining absolute abundances of C, N, O, Fe, neutron-capture elements and radial velocities in the giant branches of NGC 1851 are needed to check that there are indeed four chemically (or even kinematically) distinct populations and to determine which subpopulations are related to each other. Our group is in the process of collecting observational data to this end.
Finally we note that the AGB samples we presented here are the largest AGB samples in any GCs to date. Our finding that NGC 1851 and NGC 288 both have CN-weak dominated AGB populations adds to a growing picture in the literature that the AGB CN distributions in GCs are different to the RGB distributions (Campbell et al., 2010, 2011; Lai et al., 2011; Smolinski et al., 2011; Simpson et al., 2012). For brief reviews on this topic see Sneden et al. (2000) and Campbell et al. (2006). The current study forms part of a larger study with relatively large datasets of AGB stars to confirm this for a range of GCs (Campbell et al., in prep.).
References
- Bekki & Yong (2012) Bekki, K., & Yong, D. 2012, MNRAS, 419, 2063
- Campbell et al. (2006) Campbell, S. W., Lattanzio, J. C., & Elliott, L. M. 2006, Mem. Soc. Astron. Italiana, 77, 864
- Campbell et al. (2010) Campbell, S. W., Yong, D., Wylie-de Boer, E. C., Stancliffe, R. J., Lattanzio, J. C., Angelou, G. C., Grundahl, F., & Sneden, C. 2010, Mem. Soc. Astron. Italiana, 81, 1004
- Campbell et al. (2011) Campbell, S. W., Yong, D., Wylie-de Boer, E. C., Stancliffe, R. J., Lattanzio, J. C., Angelou, G. C., Grundahl, F., & Sneden, C. 2011, in Astronomical Society of the Pacific Conference Series, Vol. 445, Why Galaxies Care about AGB Stars II: Shining Examples and Common Inhabitants, ed. F. Kerschbaum, T. Lebzelter, & R. F. Wing, 63
- Carretta et al. (2011) Carretta, E., Lucatello, S., Gratton, R. G., Bragaglia, A., & D’Orazi, V. 2011, A&A, 533, A69
- Carretta et al. (2010) Carretta, E., et al. 2010, ApJ, 722, L1
- Cassisi et al. (2008) Cassisi, S., Salaris, M., Pietrinferni, A., Piotto, G., Milone, A. P., Bedin, L. R., & Anderson, J. 2008, ApJ, 672, L115
- Catelan (1997) Catelan, M. 1997, ApJ, 478, L99
- Cottrell & Da Costa (1981) Cottrell, P. L., & Da Costa, G. S. 1981, ApJ, 245, L79
- Gratton et al. (2004) Gratton, R., Sneden, C., & Carretta, E. 2004, ARA&A, 42, 385
- Gratton et al. (2012a) Gratton, R. G., Carretta, E., & Bragaglia, A. 2012a, A&A Rev., 20, 50
- Gratton et al. (2000) Gratton, R. G., Sneden, C., Carretta, E., & Bragaglia, A. 2000, A&A, 354, 169
- Gratton et al. (2012b) Gratton, R. G., Villanova, S., Lucatello, S., Sollima, A., Geisler, D., Carretta, E., Cassisi, S., & Bragaglia, A. 2012b, A&A, 544, A12
- Gratton et al. (2001) Gratton, R. G., et al. 2001, A&A, 369, 87
- Gratton et al. (2012c) —. 2012c, A&A, 539, A19
- Grundahl et al. (1999) Grundahl, F., Catelan, M., Landsman, W. B., Stetson, P. B., & Andersen, M. I. 1999, ApJ, 524, 242
- Han et al. (2009) Han, S.-I., Lee, Y.-W., Joo, S.-J., Sohn, S. T., Yoon, S.-J., Kim, H.-S., & Lee, J.-W. 2009, ApJ, 707, L190
- Hesser (1978) Hesser, J. E. 1978, ApJ, 223, L117
- Ivans et al. (1999) Ivans, I. I., Sneden, C., Kraft, R. P., Suntzeff, N. B., Smith, V. V., Langer, G. E., & Fulbright, J. P. 1999, AJ, 118, 1273
- Kraft (1994) Kraft, R. P. 1994, PASP, 106, 553
- Lai et al. (2011) Lai, D. K., Smith, G. H., Bolte, M., Johnson, J. A., Lucatello, S., Kraft, R. P., & Sneden, C. 2011, AJ, 141, 62
- Lardo et al. (2012) Lardo, C., et al. 2012, A&A, 541, A141
- Lewis et al. (2002) Lewis, I. J., et al. 2002, MNRAS, 333, 279
- Martell (2011) Martell, S. L. 2011, Astronomische Nachrichten, 332, 467
- Martell & Grebel (2010) Martell, S. L., & Grebel, E. K. 2010, A&A, 519, A14
- Martell et al. (2008) Martell, S. L., Smith, G. H., & Briley, M. M. 2008, PASP, 120, 7
- Milone et al. (2009) Milone, A. P., Stetson, P. B., Piotto, G., Bedin, L. R., Anderson, J., Cassisi, S., & Salaris, M. 2009, A&A, 503, 755
- Milone et al. (2008) Milone, A. P., et al. 2008, ApJ, 673, 241
- Norris et al. (1981) Norris, J., Cottrell, P. L., Freeman, K. C., & Da Costa, G. S. 1981, ApJ, 244, 205
- Norris & Freeman (1979) Norris, J., & Freeman, K. C. 1979, ApJ, 230, L179
- Pancino et al. (2010) Pancino, E., Rejkuba, M., Zoccali, M., & Carrera, R. 2010, A&A, 524, A44
- Piotto (2009) Piotto, G. 2009, in IAU Symposium, Vol. 258, IAU Symposium, ed. E. E. Mamajek, D. R. Soderblom, & R. F. G. Wyse, 233–244
- Rood & Crocker (1985) Rood, R. T., & Crocker, D. A. 1985, in European Southern Observatory Conference and Workshop Proceedings, Vol. 21, European Southern Observatory Conference and Workshop Proceedings, ed. I. J. Danziger, F. Matteucci, & K. Kjar, 61–69
- Saunders et al. (2004) Saunders, W., et al. 2004, 5492, 389
- Sharp et al. (2006) Sharp, R., et al. 2006, 6269
- Simpson et al. (2012) Simpson, J. D., Cottrell, P. L., & Worley, C. C. 2012, ArXiv e-prints
- Skrutskie et al. (2006) Skrutskie, M. F., et al. 2006, AJ, 131, 1163
- Smolinski et al. (2011) Smolinski, J. P., Martell, S. L., Beers, T. C., & Lee, Y. S. 2011, AJ, 142, 126
- Sneden et al. (2000) Sneden, C., Ivans, I. I., & Kraft, R. P. 2000, Mem. Soc. Astron. Italiana, 71, 657
- van den Bergh (1996) van den Bergh, S. 1996, ApJ, 471, L31
- Villanova et al. (2010) Villanova, S., Geisler, D., & Piotto, G. 2010, ApJ, 722, L18
- Walker (1992) Walker, A. R. 1992, PASP, 104, 1063
- Yong & Grundahl (2008) Yong, D., & Grundahl, F. 2008, ApJ, 672, L29
- Yong et al. (2009) Yong, D., Grundahl, F., D’Antona, F., Karakas, A. I., Lattanzio, J. C., & Norris, J. E. 2009, ApJ, 695, L62