XMM-Newton Observations of Three Interacting Luminous Infrared Galaxies
Abstract
We investigate the X-ray properties of three interacting luminous infrared galaxy systems. In one of these systems, IRAS 18329+5950, we resolve two separate sources. A second and third source, IRAS 19354+4559 and IRAS 20550+1656, have only a single X-ray source detected. We compare the observed emission to PSF profiles and determine that they are all consistent with the PSF, albeit with large uncertainties for some of our sources. We then model the spectra to determine soft (0.5–2 keV) and hard (2–10 keV) luminosities for the resolved sources, and compare these to relationships found in the literature between infrared and X-ray luminosities for starburst galaxies. We obtain luminosities (0.5–10 keV) ranging from erg/s for our systems. These X-ray luminosities are consistent with predictions for star-formation-dominated sources and thus are most likely due to starbursts, but we cannot conclusively rule out AGN.
Subject headings:
galaxies: active, galaxies: interactions, galaxies: nuclei, galaxies: starburst, X-rays, infrared radiation1. Introduction
Over the past few decades, much work has emphasized the role and importance of mergers in shaping galactic evolution (e.g., Toomre & Toomre, 1972; Ellison et al., 2011; Hopkins et al., 2006). In particular, mergers have been presented as potential drivers of starbursts and active galactic nuclei (AGN; Bauer et al., 2004; Summers et al., 2004; Bell et al., 2012; Komossa et al., 2003; Teng et al., 2009; Piconcelli et al., 2010). Broadly, hierarchical growth simulations such as those in Hopkins et al. (2006) paint a picture in which galactic mergers provide gas inflows to ignite starbursts, which are then followed by growth of the central supermassive black holes (SMBHs) of galaxies, sometimes leading to the birth of an AGN, until some feedback mechanism, whose origin and existence is contentious, possibly stops the process. The interactions of two galaxies can also cause their central SMBHs to become active simultaneously, resulting in a dual AGN (Komossa, 2006). A complication in this scenario is that some simulations suggest that most of the dual AGN activity is non-simultaneous, particularly during their highest luminosity phases when they would be easiest to detect observationally (Van Wassenhove et al., 2012). Other simulations have hinted that this merger scenario was more important in the past, when interacting systems were much more gas-rich, but that it still plays a role in the local universe for lower-luminosity AGN (Draper & Ballantyne, 2012).
Luminous infrared galaxies (LIRGs), galaxies that have infrared luminosities (for a review, see Sanders & Mirabel, 1996 and references therein), where IR ranges here span 8-1000 m, are often found to be mergers and have distinctive morphologies (Yuan et al., 2010). The emission from such systems is prominent in the infrared (IR) portion of the spectrum due to heavy dust reprocessing. The Great Observatories All-sky LIRG Survey (GOALS), which has been observing LIRGs across the electromagnetic spectrum (e.g., Armus et al., 2009 and Iwasawa et al., 2011), and other studies (e.g., Ptak et al., 2003; Braito et al., 2009; Alonso-Herrero et al., 2012; Charmandaris et al., 2010) have attempted to determine if the drivers of the high IR luminosities in these systems are central starbursts or AGN. In one such system, NGC 6240, two separate AGN were detected by Komossa et al. (2003) at a separation of about 1.4 kpc. This discovery has fueled much discussion about the nature of dual AGN, their prevalence, and lifetimes.
Several studies have investigated the connection between AGN activity and environment. When looking at quasars, Serber et al. (2006) found a local overdensity of galaxies of 3 around the brightest objects and an overdensity of 1.4 for fainter quasars compared to an average galaxy. They show that the overdensity of galaxies around quasars is the same as the overdensity around L* galaxies on scales of 1 Mpc. At smaller radial separations, however, quasars have a larger overdensity of nearby galaxies than L* galaxies do at the same separations. Ellison et al. (2011) reported a complementary result focusing on AGN; they found AGN are 2.5 times more likely to be in pairs than similar but inactive galaxies. Using Swift’s Burst Alert Telescope (BAT) AGN sample, Koss et al. (2011) also found evidence that strong AGN activity is associated with mergers and interactions. Specifically, they report that 24% of BAT AGN are undergoing a merger, whereas this number is closer to 1% for a sample of normal galaxies. Similarly, looking at a subsample from SDSS DR7, Liu et al. (2012) found that young stellar ages, star formation, and SMBH activity in a given galaxy correlate well with smaller separation from its nearby neighbors. These and other works (e.g., Ajello et al., 2012) suggest that a galaxy’s environment can play a non-negligible role in fueling AGN, whether through interactions or mergers with nearby galaxies.
Because of heavy obscuration at most wavelengths in dust-enshrouded systems, X-rays, which are less attenuated, become a useful tool to probe behind optically thick screens. From a sample of the optically luminous quasars from SDSS DR3, spanning a redshift of 1.5-4.5, the average power law index for X-ray emission was found to be (Just et al., 2007). The spread in the 2–10 keV photon index, however, is quite large, with observed systems running the range of . A proposed explanation for this spectral behavior is that an accretion disk feeding the central SMBH thermally emits in the optical and UV. These photons then inverse Compton upscatter to X-rays off of a hot plasma surrounding the disk (Shapiro et al., 1976; Sunyaev & Titarchuk, 1980; Haardt & Maraschi, 1993). The rather large spread in the value of photon index is thought to arise from the specific accretion rate of the SMBH regulating disk cooling– a high accretion rate increases the rate of disk emission, providing more soft (here, 0.5–2 keV) photons and increasing the Compton cooling of the corona. This, then, reduces the abundance of hard photons. Combined with the increase of soft photons, higher accretion rates are thus associated with a steeper index (Williams et al., 2004; Shemmer et al., 2008). Much of a galaxy’s SMBH growth is believed to occur in regions heavily obscured by dust (Hopkins et al., 2006; Fabian, 1999), so searching in X-rays is one of the few viable options for spotting this enshrouded phase, provided the column density is not overly large ().
AGN activity is not the only interesting phenomenon strongly associated with galactic interactions. Another prominent event often triggered is a marked increase in the star formation rate of one or both component galaxies, provided neither is gas poor. If this increase is large enough, the galaxy becomes a starburst. Muzzin et al. (2012) suggest that, while the gross properties of star-forming galaxies are tied to their stellar masses, their environment appears to regulate the fraction of systems that are starbursting.
Like AGN, star-forming regions also produce specific X-ray signatures (e.g., Persic & Rephaeli, 2002). The ionizing photons from supernovae and short-lived O and B stars form a thermal plasma typically with temperature between 0.1-1 keV. A secondary power law component, associated with high mass X-ray binaries (HMXBs), indicative of recent star formation (Fabbiano, 2006), is often observed in starburst systems as well. These are said to trace recent or ongoing star formation because they require an OB star around a neutron star (NS) or black hole (BH) and thus only have a lifetime of years. HMXBs have been observed with a range of photon indices, typically lying within 1-2 with the steepest being greater than 2.4 (Remillard & McClintock, 2006). Low mass X-ray binaries (LMXBs), a possible contaminant, are usually described by either a power law with index 1.6 or bremsstrahlung at 7.3 keV (Irwin et al., 2003; Fabbiano, 2006; Persic & Rephaeli, 2003). These LMXB spectral indices can run as steep as 2 in the highest luminosity cases. LMXBs do not trace recent star formation, however, since they are connected to lower mass companions around a NS or BH and thus have lifetimes that are 100–1000 times longer than their higher mass counterparts.
Kennicutt (1998) associated star forming regions with IR emission due to dust reprocessing of UV and optical emission from young stars. Several studies (e.g, Ranalli et al., 2003) have proposed X-ray/IR luminosity relationships in IR-bright galaxies, arguing that star formation is traced in the IR from reprocessing and in X-rays from HMXBs, provided there is no AGN present. The use of X-rays as a tracer of star formation also requires that LMXBs are a negligible contributor, which is generally a safe assumption for the high star formation rates encountered in starbursting systems. One can then use these relations to predict the X-ray output of a system originating from star formation alone. It should be noted, however, that the existence of either a starburst or an AGN does not discount the other (Sani et al., 2010; Santini et al., 2012). Additionally, some argue for a more complete picture taking into account escaping, non-reprocessed UV radiation when attempting to synthesize star formation data for certain luminosity regimes (e.g., Vattakunnel et al., 2012; Mineo et al., 2012).
In this paper we use the association between AGN activity, starbursts, mergers, and, by extension, large IR luminosity, to search for dual AGN. We also investigate how well our data are fit by a starbursting population alone. In §2, we describe our sample selection and discuss the systems we examined in detail. §3 presents image and spectral analysis as well as the luminosities we find. §4 compares our data to existing IR/X-ray relations and discusses our prospectives on dual AGN detection. Finally, we conclude in §5.
We adopt a cosmology of , , and and all relationships taken from the literature assume a Salpeter IMF.
2. Sample
We derived our sample from a subset of relatively local IR bright galaxies presented in Arribas et al. (2004). Our systems are nearby (redshifts of 0.03 ¡ z ¡ 0.07), to ensure a high number of photon counts, and are known to be interacting with two optical nuclear regions, though there is some uncertainty about the location of the secondary nucleus in IRAS 20550+1656. All are LIRGs, and many have roughly measured nuclear separations. We selected based on interaction class using the scheme proposed in Surace (1998) and refined in Veilleux et al. (2002), restricting our sample to class IIIa and IIIb systems with nuclear separations around 10 kpc. A class IIIa system is composed of two or more galaxies with evidence of tidal interactions (tails, bridges) and with nuclear separation of greater than 10 kpc, whereas a class IIIb system has similar tidal structures but with nuclear separation less than 10 kpc. Additionally, we required that systems have angular separations that would likely be resolvable with XMM-Newton (). After this, we selected the LIRGs with the highest IR fluxes, and, by association, likely the most X-ray counts barring the system being Compton thick. The IR luminosity for all the potential targets was calculated from the IRAS Revised Bright Galaxy Sample (hereafter RBGS; Sanders et al., 2003) using the distance and IR flux defined in the RBGS as
| (1) |
Three systems met our criteria: IRAS 18329+5950, IRAS 19354+4559, and IRAS 20550+1656. We observed these with XMM-Newton and restricted all analyses to 0.5–10 keV so as to stay in range of the detector’s optimal sensitivity. Table 1 summarizes our data, including the observation ID, exposure times, nuclear separations, and counts for each of our sources.
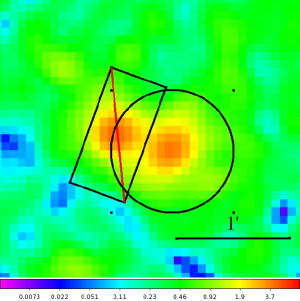
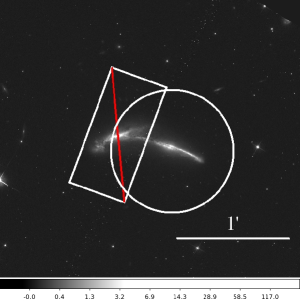
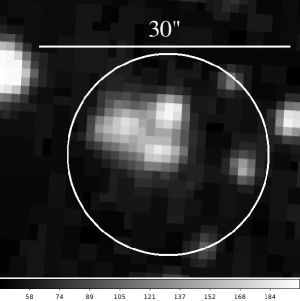
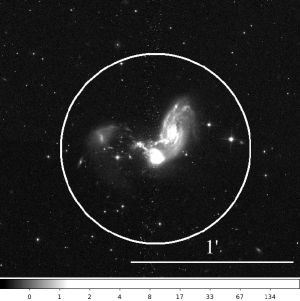
IRAS 18329+5950 is a class IIIa system composed of two merging galaxies with estimated nuclear separations of (Arribas et al., 2004). The offset in declination () of the two galaxies in this system is much smaller than the offset in right ascension (). In projection, it appears that the nucleus of the eastern component (18329E) is close to the plane of the disc of the western component (18329W), as can be seen in the bottom row of Figure 1. The system is classified as a LIRG in the RBGS. Using the RBGS fluxes, we calculate an IR luminosity of based on the redshift of z=0.029, which corresponds to a distance of 129 Mpc (Armus et al., 2009). Optical line ratios, discussed further in §4.3, suggest that this system is a starburst or starburst/AGN composite.
IRAS 19354+4559 is a class IIIb merger system with nuclear separation of approximately (Arribas et al., 2004). In this case, the offsets in right ascension and declination are comparable, being and , respectively. Both galaxies have significant tidal features in the optical, suggestive of mutual interaction. They appear as mostly edge-on disks, although the eastern component has several foreground stars contaminating the optical images, partially confusing the orientation, which can be seen in Figure 1 of Arribas et al. (2004). Using fluxes from the RBGS, we calculate an upper limit IR luminosity of based on the redshift of z=0.067, which corresponds to a distance of 289 Mpc (Lawrence et al., 1999). We did not find any IR or optical line diagnostics for this system.
Similarly, IRAS 20550+1656 is also a class IIIb merger system. The separation between the optical nuclei is uncertain, but believed to be about (Arribas et al., 2004). From the RBGS fluxes, we calculate the IR luminosity to be for a redshift of z=0.036, corresponding to a distance of 161 Mpc (Armus et al., 2009). Optical (Baan et al., 1998) and IR (Inami et al., 2010) spectroscopy and line ratio diagnostics indicate that this system is a starburst. The Spitzer data in particular (Inami et al., 2010) suggests that 80% of the IR luminosity comes from a region outside the nuclei of the two interacting galaxies in this merger.
| IRAS Name | Observation ID | Date | Exposure | Distance | Separation | Separation | Hardness Ratio | Source Counts |
|---|---|---|---|---|---|---|---|---|
| (XMM) | (ks) | (Mpc) | (kpc) | (0.5-10 keV) | ||||
| 18329+5950E | 0670140301 | 2011-05-04 | 5.3 | 129 | 17.4 | |||
| 18329+5950W | 0670140301 | 2011-05-04 | 5.3 | 129 | 17.4 | |||
| 19354+4559 | 0670140501 | 2011-05-10 | 15.2 | 289 | 11.9 | |||
| 20550+1656 | 0670140101 | 2011-10-28 | 60.5 | 161 | 9.13 |
Note. — Separation refers to the projected nuclear separation between the interacting galaxies; the first is angular separation while the second is physical separation. The hardness ratio represents the overall contribution of hard X-ray emission (2-10 keV) compared to soft (0.5-2 keV) emission. Note that exposure times are good time intervals, explained in the text, and that the source counts and hardness ratios are taken from background-subtracted data.
3. XMM-Newton Observations
3.1. Image Analysis
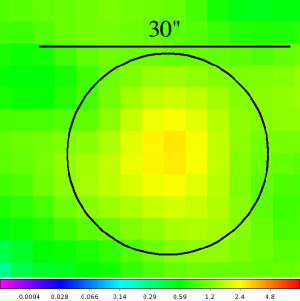
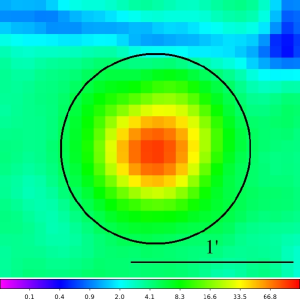
All data were taken with the EPIC instruments on board XMM-Newton and reduced using XMM SAS Version 12.0.1. As is typical in X-ray image analysis, we filtered the event files to discard any time interval with in order to minimize contamination from cosmic rays and other short, time-variant noise sources. As the EPIC MOS cameras have a smaller pixel scale than the EPIC PN by nearly a factor of four, we first tried creating images and radial profiles using EPIC MOS. Unfortunately, there were not enough counts in the MOS images to robustly determine the radial profiles, so we proceeded to use the more abundant data from the PN detector for our analysis. Processed EPIC PN images in the entire 0.5–10 keV band for the three sources in our sample are shown in Figure 1. The top-left panel of Figure 1 demonstrates that the nuclear regions of the two separate galaxies in IRAS 18329+5950 are resolved in X-rays. Additionally, the top-middle and top-right panels of Figure 1 show that for both IRAS 19354+4559 and IRAS 20550+1656, the nuclei from the individual component galaxies are not distinctly separable. Thus, only a single area could be analyzed for each of these sources.
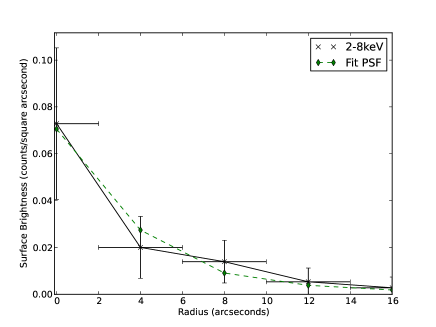
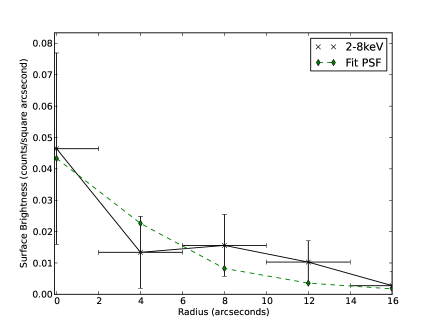
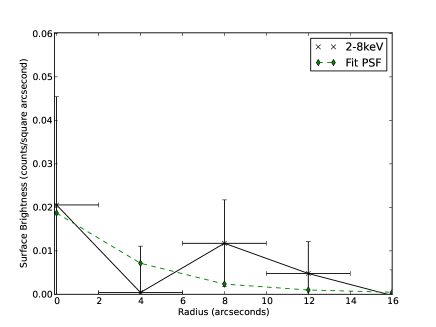
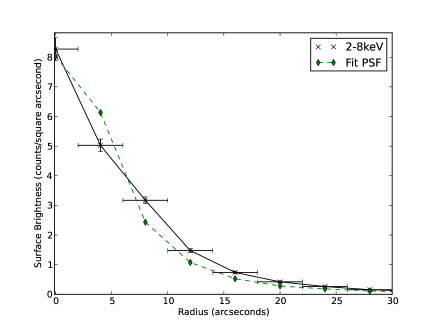
As hinted at above, one avenue for discerning the probable X-ray source type is to compare the radial profile of the observed flux to the PSF of the detector. A lone AGN, being a point-like source, would have a profile that approximately matched the PSF’s, whereas a starburst or a blend of starburst with an AGN would be more extended from diffuse emission. We used the XMMSAS task eradial to calculate the sources’ radial profile distributions at an energy of 2-8 keV. We chose this energy range because an AGN which is not heavily obscured would likely provide a greater fractional contribution to the hard band flux than the soft band as compared to a starburst region. The eradial task returned the emission profile in concentric circular radii of each source. It also created a model of the PSF, using the built-in ELLBETA model type, at that same location on the CCD chip at 5 keV, the midpoint of our hard energy range. The ELLBETA model is based around an elliptical King profile, with an added Gaussian to account for spokes. The normalization of the PSF was set by using weights inversely proportional to errors on the extracted radial profile of the data. The background was fit using a region of the same area as the extraction region on the same CCD chip in order to avoid nearby sources and avoid any inter-chip variance. Figure 2 shows the background-subtracted radial profiles. Our systems appear to be either consistent with or marginally extended with respect to the PSF over our energy range. We find the profiles of both galaxies in IRAS 18329+5950 and the single source of IRAS 20550+1656 are fully consistent with the PSF, while IRAS 19354+4559 may potentially be extended. However, it is still consistent with a point source within the errors.
3.2. Spectral Analysis
For spectral analysis, we used the entire 0.5–10 keV band. The 90% encircled energy radius of the EPIC PN PSF above 2 keV is over an arcminute, so we tried to use a spectral extraction region as large as possible. In IRAS 20550+1656, we have only one source detected and used a spectral extraction radius of , which is out to the CCD chip boundary. In IRAS 19354+4559, again we have a single source detected. We used a spectral extraction radius for this system, as there are a couple of nearby sources in this field which prevented us from using a larger region. For IRAS 18329+5950, we detected both galaxies of the system individually, which are separated by as stated in §2. For these sources, a spectral extraction region had to be defined carefully to avoid contamination between the two galaxies. As such, we used a radius circle instead, shown in Figure 1 around 18329W. From this region, we excised 18329E with a rectangular region centered at its coordinates, which is also shown in Figure 1. A similar procedure was followed to create an extraction region for 18329E that had 18329W excised. The background region was subtracted as described in §3.1. We then corrected our final luminosities based on the XMM on-axis PSF encircled energy fraction at the region size for each extracted source.
Following extraction, we performed our analysis using XSPEC v12.7.0. We modeled each system with multiple components in combination to account for AGN, possibly obscured, and starbursts in an attempt to recover the observed count and energy distributions. We were, however, limited in the complexity of our models due to low source number counts, as can be seen in Table 1. Our fewest counts came from IRAS 19354+4559 with 46. Both sources in IRAS 18329+5950 had around 100 counts, and IRAS 20550+1656 had over an order of magnitude greater at 3500.
For IRAS 18329+5950, due to the low number counts in both sources, we decided not to bin the data and used Cash statistics rather than fit based on the more commonly used reduced value (Cash, 1979). We took into account Galactic absorption using the “tbabs” model (Wilms et al., 2000). We first tried to fit the data for 18329E, shown in Figure 3, with solely an absorbed power law (C = 98.31; degrees of freedom = 113) followed by an absorbed power law and MEKAL (Mewe et al., 1985, 1986; Liedahl et al., 1995) thermal plasma component (C = 94.60; degrees of freedom = 110), with their respective fit parameters highlighted in Table 3. We adopt the latter model, which has a spectral index and temperature of keV. The component luminosities are presented in Table 2; we note that this source is dominated in the hard band by the power law component.


The system 18329W, shown in the right panel of Figure 3, was also fit by an absorbed power law (C = 98.93; degrees of freedom = 114) and then by an absorbed power law model and one with an additional MEKAL plasma (C = 95.70; degrees of freedom = 111), and once again a comparison between the two models is shown in Table 3. Here, the best fit value for the spectral index was slightly steeper and the temperature of the plasma slightly lower than 18329E, though they are consistent within their errors. Like with 18329E, Table 2 indicates that 18329W derives the vast majority of its model’s hard band luminosity from the power law and comparable amounts from both the plasma and power law in the soft band.
After correcting for the encircled energy at , both systems have a final soft band luminosity of and hard band luminosities of and for 18329W and 18329E, respectively. It should be noted that in both 18329E and 18329W the thermal plasma models were fixed at solar metallicity via the prescription in Anders & Grevesse (1989), which is adopted by default in XSPEC.
The data for IRAS 19354+4559, which can be found in Figure 4, were also fit without binning and using Cash statistics rather than . Even so, multicomponent models were not well-constrained due to the paucity of counts. As such, we tried modeling the system with a plasma, blackbody, and power law component separately, each with Galactic absorption. The best fit (; degrees of freedom = 89) is the power law with a spectral index of . After correcting for the smaller extraction region, this system is roughly in the soft band and in the hard band, as can be seen in Table 2.

For the spectrum of IRAS 20550+1656, presented in Figure 5, we were able to bin the raw spectrum such that each bin contained a minimum of 20 counts, permitting us to use reduced fitting for this system. As with all the systems, we began by fitting solely with an absorbed power law ( = 360.0; degrees of freedom = 148). Next, we tested an absorbed power law and MEKAL thermal plasma model ( = 145.3; degrees of freedom = 145). Comparing this to the original model, one can see this model is strongly favored with a reduced close to unity. We were concerned about the bump-like features around 2 and 4.5 keV (Figure 5), however, and tested to see if non-solar abundances could reproduce this data. Assessing each element individually, we found that the bump around 2 keV could be due to a super-solar silicon abundance.
To investigate whether this silicon enhancement was part of a larger alpha element enrichment, we next fit the system with a model where all of the alpha elements were tied to the silicon value ( = 132.5; degrees of freedom = 144). It should be noted that we also fit with both alpha elements independent from one another as well as all metals as free parameters. Our data are unable to provide firm constraining power in either of these instances. This fit, with the alpha elements fixed to the silicon value, has an abundance , and is compared to the single power law and power law with a solar abundance plasma in Table 3.
We are still left with the prevalent bumps between 4-5 keV, as well as smaller ones around 1 keV. Fitting the larger feature as a Gaussian emission line, the line has a central value of E = keV and line width of = keV. If this feature is an emission line from the source, it is most likely Ca XX at 3.0185A, or 4.1 keV. We found no reports of this line in emission in the literature, though it may have been seen in absorption in a few systems (Tombesi et al., 2010). However, due to the tenuous detection of this line and the marginal improvement to our fit after its addition, we report the model without this component as our best fit. The final parameters of the fit are summarized in Table 3. From Table 2, we note that this source is dominated in the hard band by the power law component, whereas the two components are comparable in the soft band. If we fix the plasma at solar metallicity, the luminosity drops by 16% and 18% in the soft and hard bands, respectively. The luminosities with and without solar metallicity are within 2 of each other.
How reasonable is it for us to find super-solar silicon? We might expect to see enhanced levels of silicon from a starbursting region. This is because starbursts are a rich environment of massive stars, which become Type II supernovae and can pollute the region with alpha elements. In a recent study, Nardini et al. (2013) found an elevated ratio for the merging galaxy NGC 6240, known to host a dual AGN. They argue that the heightened presence of alpha elements in NGC 6240 is consistent with Type II supernovae yields from Nomoto et al. (2006). In the Antennae Galaxies, another well-known merger, high spatial resolution revealed that the metallicity of the gas is quite variable, sub-solar in some regions and as high as 20-30 solar in others, also arguing in favor of supernova enrichment (Baldi et al., 2006a, b). Additionally, Araya Salvo et al. (2012) report several super-solar alpha elements in their discovery spectra for an AGN in the bulge-less galaxy NGC 4561.
IRAS 20550+1656 was also the subject of an extensive multiwavelength campaign, including an X-ray analysis with Chandra as part of the GOALS project (Inami et al., 2010), that we can compare to our data from XMM-Newton. They were able to distinguish two distinct objects in X-rays (see their Figure 5, sources labeled as “A” and “C+D”) with Chandra’s spatial resolution, whereas we see only a single source with XMM-Newton. One of their two X-ray sources was reported as extended, covering two distinct IR bright regions seen with Spitzer. Using Spitzer data on the individual sources, they concluded that source A is most likely a starburst, obeying the Ranalli et al. (2003) relations relating IR luminosity (a proxy for star formation) to X-ray luminosity (a proxy for X-ray binaries). For C+D they find that Ranalli et al. (2003) overpredicts the X-ray values for its IR luminosity, though it should be noted that these relations were calibrated for less intense star forming systems.
Looking once again to this system’s data from Inami et al. (2010), they report soft X-ray luminosities of and . Their hard X-ray (2-7keV) luminosities for the two sources were both . Over the entire range 0.5-7keV, then, these sum to about 50% the luminosity we find for our single source over the range 2-8 keV. One possible explanation for the differences in luminosity between the Chandra and XMM observations is that IRAS 20550+1656 is intrinsically variable, which could be suggestive of an AGN in either source A, source C+D, variations in the extended emission from HMXBs, or combinations thereof. Unfortunately, with the lower spatial resolution of our observation we are unable to determine which of their reported sources, if only one, is responsible for our larger X-ray luminosity.
| IRAS Name | Component | ||
|---|---|---|---|
| 18329+5950E | Full Model | ||
| Power Law | |||
| MEKAL Plasma | |||
| 18329+5950W | Full Model | ||
| Power Law | |||
| MEKAL Plasma | |||
| 19354+4559 | Power Law | ||
| 20550+1656 | Full Model | ||
| Power Law | |||
| VMEKAL Plasma |
Note. — Comparison of X-ray luminosities of model components. Luminosities are reported in . Errors are calculated from the errors on the normalizations of each model component.

| IRAS Name | Model | T (keV) | Fit Statistic | DoF | |
|---|---|---|---|---|---|
| 18329+5950 East1 | PL | 98.31 | 113 | ||
| PL + Thermal Plasma | 94.60 | 110 | |||
| 18329+5950 West1 | PL | 98.93 | 114 | ||
| PL + Thermal Plasma | 95.70 | 111 | |||
| 19354+45591 | PL | 72.05 | 89 | ||
| 20550+16562 | PL | 360.0 | 148 | ||
| PL + Thermal Plasma | 145.3 | 145 | |||
| PL + Super-solar Plasma | 132.5 | 144 |
Note. — Comparison of spectral fitting parameters for the two components of IRAS 18329+5950 and the single sources in IRAS 19354+4559 and IRAS 20550+1656. Note that “DoF” here stands for Degrees of Freedom. 1Fit statistic is the Cash statistic. 2Fit statistic is chi squared.
4. Discussion
With models in hand, we further investigate the likelihood of starburst and/or AGN nature of our sources.
4.1. Determining Star Formation Rates
With known X-ray and IR luminosities, we now discuss the star formation rates in these systems. There are many available prescriptions in the literature, and we start with the often-used Kennicutt (1998) IR starburst relation. For an IR luminosity given in erg/s,
| (2) |
From Equation 2, we find star formation rates (SFRs) in the range of 75-150 for our three systems, with IRAS 20550+1656 being the strongest. We have listed the star formation and IR luminosities for each individual system in Table 4. As is typically expected of mergers and LIRGs in general, these are relatively large SFRs, implying that at least one of the galaxies in each pair is likely in a starburst phase. The underlying assumption in this and other relations is that all of the UV emission from O and B stars, whose presence is indicative of recent star formation, is absorbed by dust surrounding the star forming region and re-radiated into the infrared. Not all of this UV radiation is absorbed, however. For example, Miralles-Caballero (2012) observed some star clusters with as much as 15% unobscured UV radiation. As such, we decided to also try a more recent SFR relationship that takes both IR and UV radiation into account (Iglesias-Páramo et al., 2004, 2006; Hirashita et al., 2003; Bell, 2003):
| (3) |
where
| (4) | |||
| (5) |
and all luminosities here are taken in erg/s.
The factor in Equation 3 is a correction factor (between zero and unity) for the fraction of IR emission that is cirrus in nature rather than directly related to recent star formation. The value of for a specific galaxy is difficult to ascertain. Bell (2003) find that for galaxies with ¿ 11, whereas galaxies below this threshold have . As all of our systems are in the former regime, we adopt a value of in all of our analyses when necessary. For the NUV luminosities, we used GALEX data presented in Howell et al. (2010) for two of our systems. The NUV term in Equation 3, however, has less than a 1% effect on the total SFR for IRAS 18329+5950 and IRAS 20550+1656, so we proceed using only the IR SFR, Equation 4 modified by , for our systems. We caution that IRAS 19354+4559 has the lowest IR luminosity, and thus may have a larger relative UV contribution than the other systems for which GALEX data was available. Overall, the SFRs obtained in this way are slightly below those from the Kennicutt (1998) formalism, ranging from 72-140 . These are also listed in Table 4 for the individual systems in our sample for comparison.
Inami et al. (2010) find a SFR of for the non-nuclear IR source (labeled “D” in their paper) in IRAS 20550+1656. Comparing to our value for the system as a whole, this would imply that most of the star formation in the system is happening in this non-nuclear region.
4.2. X-ray Origins
Our next objective was to determine the major contributor to our systems’ X-ray luminosities. Are they related to star formation, AGN activity, or both?
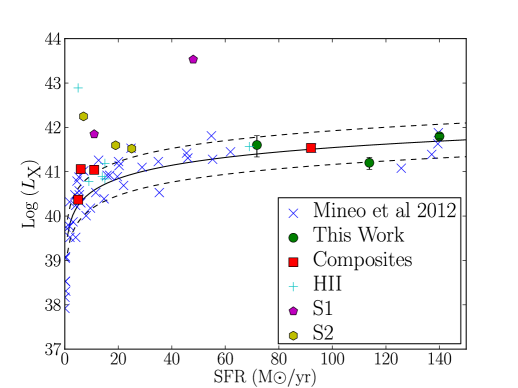
To accomplish this, we compare our luminosities to literature predictions for X-rays associated with star formation. For this task, we employ the relationship of Mineo et al. (2014):
| (6) |
For consistency, we use star formation rates from Iglesias-Páramo et al. (2006), here simplified to Equation 4 for our IR luminous systems, rather than Kennicutt (1998), as these were the rates used to calibrate Equation 6. Using the latter, however, results in a 6% increase in the predictions.
Since these relationships pertain directly to starbursts via their diffuse emission and integrated X-ray binary luminosity, if they are similar to the luminosities we find from our observations, we may infer that our systems, at least in the X-ray range, are most likely dominated by star formation rather than AGN. If a strong, unabsorbed AGN is present, however, we would expect a notable excess in X-ray luminosity compared to these predictions.
In Figure 6, we plot our derived luminosities against star formation rate and include other known AGN and AGN-starburst composite systems. From this, it is evident that the best-fit models for each of our systems described in §3.2 give 0.5-8 keV luminosities that are consistent with the expected values from their SFRs. IRAS 19354+4559 is on the lower end of this range, but we remind the reader that this particular system had the least constrained model as discussed in §3.2. The values of these luminosities, both predicted and modeled, are shown for convenience in Table 4. If we adopt our solar metallicity luminosity for IRAS 20550+1656, it is closer to the predicted value from star formation, but both are consistent. In their discussion, Mineo et al. (2014) compare the calibration of their relationship to others found in the literature. They find that there are two primary differences in how various studies have generated these associations. The first is how each work proxies the star formation rate of the galaxies studied, and the second is their adopted model for X-ray binary emission. Combined, these two issues can drop the normalization of Equation 6 by a factor of 2 or raise it by a factor of 1.5. We elect to work with Equation 6 because of the care in handling both the diffuse and source (here, X-ray binary) emission related to star forming regions.
| IRAS Name | |||||
|---|---|---|---|---|---|
| 18329+5950 | 17 | 76 | 72 | ||
| 19354+4559 | 27 | 121 | 114 | ||
| 20550+1656 | 33 | 149 | 140 |
Note. — Star formation rates, predicted luminosities, and modeled luminosities related to our systems. The IR fluxes are calculated from Equation 1 using the specific flux values presented in the RBGS (Sanders et al., 2003). The star formation rates are calculated from Kennicutt (1998) and Iglesias-Páramo et al. (2006), reproduced in-text as Equation 2 and Equation 4, respectively. The predicted X-ray luminosities from SFR alone are found using values and Equation 6, taken from Mineo et al. (2014). Our X-ray values are from our best fit spectral models described in the text.
4.3. AGN in LIRGs?
We have employed several methods to determine whether or not our sample contains AGN or dual AGN. One indicator would be X-ray point sources. From Figure 1 we see that all three systems are detected in the entire XMM energy bandpass and that IRAS 18329+5950 is composed of two distinct sources. If these X-ray sources were due solely to the presence of an AGN, one would expect that their radial profiles would be similar to the detector’s PSF. From Figure 2 we see that, for the most part, the 2-8 keV emission is consistent within errors of the modeled PSF at 5 keV. Given that the FWHM for the PN detector on XMM-Newton is about an 12., amounting to 8 kpc in the closest system (IRAS 18329+5950), it is impossible to say definitively that the X-ray source is solely from point-like emission.
The second test was to compare the spectra of each system to starburst and AGN templates. Both sources in IRAS 18329+5950 and the single source in IRAS 20550+1656 were composed of a MEKAL plasma, typically associated with ionizing photons from OB stars and their supernovae, as well as a power law which could be from either an AGN or X-ray binaries. As for their spectral indices, X-ray binaries are expected, from Persic & Rephaeli (2002), to have power law slopes of 1.2, though as stated in §1, the full range is 1-2.4, typically between 1-2. The power law components of both systems of IRAS 18329+5950 as well as IRAS 20550+1656 are within this range. IRAS 19354+4559 is steeper than the others, but all of our systems are consistent within error bars with both HMXBs and AGN spectral indices.
Lastly, we investigated how our systems’ X-ray luminosities compared to their star formation rates. All of our systems’ X-ray luminosities lie within 1 of the prediction from star formation alone. This implies that their X-ray output is in a regime where it can be attributed mostly, if not entirely, to processes tied to star formation, such as XRBs and diffuse emission.
In all of these tests, we do not find robust evidence for AGN activity in any of our sources, though we cannot definitively rule out AGN activity either.
This, then, raises the question: Why there are no dual AGN, or even single AGN, signatures in our systems? Ideally, obtaining more counts for each our systems would allow us to more conclusively state whether there are no AGNs or simply weaker ones. Additional counts would permit us to fit more complex models with higher constraining power that could better discriminate between starburst and AGN templates. This is a severe problem with IRAS 19354+4559 in particular, as we could only fit it with a single power law component which clearly has a soft excess, as shown in Figure 4. Additional spatial resolution, such as with Chandra, would be beneficial as well as it could demonstrate more clearly the extension of the X-ray emission, as in the case of IRAS 20550+1656 in Inami et al. (2010). The biggest obstacle among all our data was perhaps the loss of large portions of our exposures due to background, especially in IRAS 18329+5950 and IRAS 19354+4559.
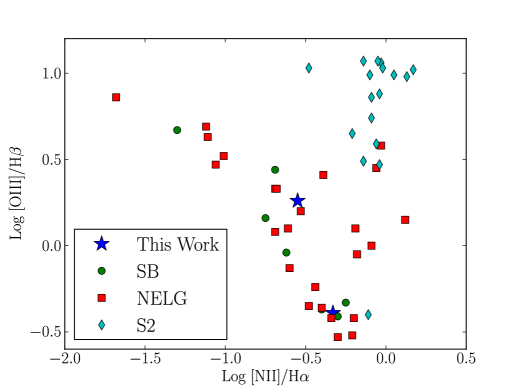
It is possible that any AGN present in our systems is Compton thick with large ( ) column densities, hiding nuclear activity. Knowing that these systems are heavily obscured in the optical, we investigated the location of our systems on a BPT diagram (Baldwin et al., 1981) of N[II]/H against O[III]/H. In Figure 7 we show IRAS 18329+5950 and IRAS 20550+1656 (H: Kennicutt et al., 2009, [NII], [OIII], and H: Moustakas & Kennicutt, 2006) alongside data and classifications taken from Veilleux & Osterbrock (1987) as reference, and see that they lie in the same region as the starbursts (SBs) and narrow emission line galaxies (NELGs, those galaxies with profiles akin to HII and LINER systems), similar to Figure 6. We also looked for mid-IR lines in the literature that would be less subject to internal extinction than the optical ones. The only such data found was for IRAS 20550+1656, where a combination of PAH, [NeII], and [NeIII] emission suggested the system was a starburst rather than an AGN (Inami et al., 2010).
Our data are consistent with there being no prominent AGN present. What does this imply? The simulations from Hopkins et al. (2006) have a large fraction of SMBH growth due to galaxy mergers and imply that the merger rate should map relatively well onto the quasar activation rate. They find that major accretion occurs even during the first passage. The peak quasar activity is associated with the final merger after dust blowout, though lower luminosity activity is predicted both before and after this phase. However, it is possible that Class III mergers may be too early in the merger process to have strong AGN activity (i.e. enough to distinctly surmount starburst emission) in the galaxies involved.
Unfortunately, it is observationally ambiguous how long any single merger has been going on, and thus merging systems without AGN provide little hint as to how far “behind schedule” they are with respect to simulations such these. This most luminous phase of the AGN is the likely culprit of the correlations presented in §1. Other studies, however, argue that fueling during mergers is not the main avenue for activating a central SMBH. Kocevski et al. (2012) find in a sample of 72 systems at larger redshifts (1.5 ¡ z ¡ 2.5) that AGNs are no more likely to possess a disturbed morphology than their control sample systems. In a more local sample (0.3 ¡ z ¡ 1) of 140 AGN with XMM-Newton data, Cisternas et al. (2011) find that 85% show no signs of recent major mergers, which is not significantly different (¡1) from this same fraction of their control sample. Grier et al. (2011), using the Spitzer Infrared Nearby Galaxies Survey, find that 60% of galaxies host AGN from X-ray data and these galaxies are not in merging systems. It is possible, however, that most of their black hole growth happened in previous major mergers. The presence of AGN in galaxies with pseudobulges (Mathur et al., 2012 and references therein) clearly points to an alternative path of black hole growth.
If the SMBHs in our systems are actually not accreting, rather than simply too weak to be discerned from star formation, then we must look at simulations with more caution. Does intense nuclear star formation or some other merger-related process prevent the ample supply of gas and dust from fueling the SMBHs at early stages? Given the small number of systems reported with dual AGN and the larger number of attempts to find them through varied methods, there could be an issue with this phase of the hierarchical growth route altogether. Some (possibly substantial) fraction of SMBHs may not accrete much material during mergers, in which case one might expect most of the AGN activity to occur during slower secular accretion processes (e.g., Mathur et al., 2012; Kocevski et al., 2012). Or, maybe the lifetime of dual AGN activity is extremely short and thus hard to observe, as some studies have suggested (Van Wassenhove et al., 2012). The star formation processes also are quite powerful in mergers, and can possibly dwarf lower luminosity AGN activity that occurs as the SMBHs begin to accrete matter, as can be seen in Figure 6. Any one of these would make finding binary AGN in mergers quite difficult. Unfortunately, our data cannot discriminate between these scenarios and we are unable to definitively state which, if any, is the true culprit at this time.
5. Conclusion
We present the results from a search for dual AGN. Based on the environment arguments presented in §1, we selected nearby LIRGs (tending to have lower than those observed at higher redshifts) with galaxy separations near the resolution limit of the XMM-Newton and with evidence of interaction. From our imaging analysis, the only system in which two distinct X-ray sources are resolved is IRAS 18329+5950. Only one of these, the eastern source in IRAS 19354+4559, is possibly inconsistent with the PSF, and the rest of our systems seem to be dominated by emission from the central few kiloparsecs.
The X-ray luminosities of IRAS 18329+5950, IRAS 19354+4559, and IRAS 20550+1656 are all within of the predicted value from the Mineo et al. (2014) relationships mapping star formation rate to X-ray luminosity. This suggests that the X-rays for these galaxies arise from star formation rather than AGN.
The data for each of our systems is not of sufficient quality to find, nor conclusively rule out, the presence of AGN. These results could be improved upon by searching for other nearby LIRG systems with resolvable nuclear regions. If such systems continue, as the three presented in this paper, to be consistent with star formation related emission alone, then we will be able to place observational constraints on the predictions from simulations presented in §1.
References
- Ajello et al. (2012) Ajello, M., Alexander, D. M., Greiner, J., Madejski, G. M., Gehrels, N., & Burlon, D. 2012, ApJ, 749, 21
- Alonso-Herrero et al. (2012) Alonso-Herrero, A., Pereira-Santaella, M., Rieke, G. H., & Rigopoulou, D. 2012, ApJ, 744, 2
- Anders & Grevesse (1989) Anders, E. & Grevesse, N. 1989, Geochim. Cosmochim. Acta, 53, 197
- Araya Salvo et al. (2012) Araya Salvo, C., Mathur, S., Ghosh, H., Fiore, F., & Ferrarese, L. 2012, ApJ, 757, 179
- Armus et al. (2009) Armus, L., Mazzarella, J. M., Evans, A. S., Surace, J. A., Sanders, D. B., Iwasawa, K., Frayer, D. T., Howell, J. H., Chan, B., Petric, A., Vavilkin, T., Kim, D. C., Haan, S., Inami, H., Murphy, E. J., Appleton, P. N., Barnes, J. E., Bothun, G., Bridge, C. R., Charmandaris, V., Jensen, J. B., Kewley, L. J., Lord, S., Madore, B. F., Marshall, J. A., Melbourne, J. E., Rich, J., Satyapal, S., Schulz, B., Spoon, H. W. W., Sturm, E., U, V., Veilleux, S., & Xu, K. 2009, PASP, 121, 559
- Arribas et al. (2004) Arribas, S., Bushouse, H., Lucas, R. A., Colina, L., & Borne, K. D. 2004, AJ, 127, 2522
- Baan et al. (1998) Baan, W. A., Salzer, J. J., & Lewinter, R. D. 1998, ApJ, 509, 633
- Baldi et al. (2006a) Baldi, A., Raymond, J. C., Fabbiano, G., Zezas, A., Rots, A. H., Schweizer, F., King, A. R., & Ponman, T. J. 2006a, ApJS, 162, 113
- Baldi et al. (2006b) —. 2006b, ApJ, 636, 158
- Baldwin et al. (1981) Baldwin, J. A., Phillips, M. M., & Terlevich, R. 1981, PASP, 93, 5
- Bauer et al. (2004) Bauer, F. E., Alexander, D. M., Brandt, W. N., Schneider, D. P., Treister, E., Hornschemeier, A. E., & Garmire, G. P. 2004, AJ, 128, 2048
- Bell (2003) Bell, E. F. 2003, ApJ, 586, 794
- Bell et al. (2012) Bell, E. F., van der Wel, A., Papovich, C., Kocevski, D., Lotz, J., McIntosh, D. H., Kartaltepe, J., Faber, S. M., Ferguson, H., Koekemoer, A., Grogin, N., Wuyts, S., Cheung, E., Conselice, C. J., Dekel, A., Dunlop, J. S., Giavalisco, M., Herrington, J., Koo, D. C., McGrath, E. J., de Mello, D., Rix, H.-W., Robaina, A. R., & Williams, C. C. 2012, ApJ, 753, 167
- Blustin et al. (2003) Blustin, A. J., Branduardi-Raymont, G., Behar, E., Kaastra, J. S., Kriss, G. A., Page, M. J., Kahn, S. M., Sako, M., & Steenbrugge, K. C. 2003, A&A, 403, 481
- Braito et al. (2009) Braito, V., Reeves, J. N., Della Ceca, R., Ptak, A., Risaliti, G., & Yaqoob, T. 2009, A&A, 504, 53
- Cash (1979) Cash, W. 1979, ApJ, 228, 939
- Charmandaris et al. (2010) Charmandaris, V., Wu, Y., Huang, J., Spinoglio, L., & Tommasin, S. 2010, in IAU Symposium, Vol. 267, IAU Symposium, ed. B. M. Peterson, R. S. Somerville, & T. Storchi-Bergmann, 254–259
- Cisternas et al. (2011) Cisternas, M., Jahnke, K., Inskip, K. J., Kartaltepe, J., Koekemoer, A. M., Lisker, T., Robaina, A. R., Scodeggio, M., Sheth, K., Trump, J. R., Andrae, R., Miyaji, T., Lusso, E., Brusa, M., Capak, P., Cappelluti, N., Civano, F., Ilbert, O., Impey, C. D., Leauthaud, A., Lilly, S. J., Salvato, M., Scoville, N. Z., & Taniguchi, Y. 2011, ApJ, 726, 57
- Dickey & Lockman (1990) Dickey, J. M. & Lockman, F. J. 1990, ARA&A, 28, 215
- Draper & Ballantyne (2012) Draper, A. R. & Ballantyne, D. R. 2012, ApJ, 751, 72
- Ellison et al. (2011) Ellison, S. L., Patton, D. R., Mendel, J. T., & Scudder, J. M. 2011, MNRAS, 418, 2043
- Fabbiano (2006) Fabbiano, G. 2006, ARA&A, 44, 323
- Fabian (1999) Fabian, A. C. 1999, MNRAS, 308, L39
- Grier et al. (2011) Grier, C. J., Mathur, S., Ghosh, H., & Ferrarese, L. 2011, ApJ, 731, 60
- Haardt & Maraschi (1993) Haardt, F. & Maraschi, L. 1993, ApJ, 413, 507
- Hirashita et al. (2003) Hirashita, H., Buat, V., & Inoue, A. K. 2003, A&A, 410, 83
- Hopkins et al. (2006) Hopkins, P. F., Hernquist, L., Cox, T. J., Di Matteo, T., Robertson, B., & Springel, V. 2006, ApJS, 163, 1
- Howell et al. (2010) Howell, J. H., Armus, L., Mazzarella, J. M., Evans, A. S., Surace, J. A., Sanders, D. B., Petric, A., Appleton, P., Bothun, G., Bridge, C., Chan, B. H. P., Charmandaris, V., Frayer, D. T., Haan, S., Inami, H., Kim, D.-C., Lord, S., Madore, B. F., Melbourne, J., Schulz, B., U, V., Vavilkin, T., Veilleux, S., & Xu, K. 2010, ApJ, 715, 572
- Iglesias-Páramo et al. (2004) Iglesias-Páramo, J., Buat, V., Donas, J., Boselli, A., & Milliard, B. 2004, A&A, 419, 109
- Iglesias-Páramo et al. (2006) Iglesias-Páramo, J., Buat, V., Takeuchi, T. T., Xu, K., Boissier, S., Boselli, A., Burgarella, D., Madore, B. F., Gil de Paz, A., Bianchi, L., Barlow, T. A., Byun, Y.-I., Donas, J., Forster, K., Friedman, P. G., Heckman, T. M., Jelinski, P. N., Lee, Y.-W., Malina, R. F., Martin, D. C., Milliard, B., Morrissey, P. F., Neff, S. G., Rich, R. M., Schiminovich, D., Seibert, M., Siegmund, O. H. W., Small, T., Szalay, A. S., Welsh, B. Y., & Wyder, T. K. 2006, ApJS, 164, 38
- Inami et al. (2010) Inami, H., Armus, L., Surace, J. A., Mazzarella, J. M., Evans, A. S., Sanders, D. B., Howell, J. H., Petric, A., Vavilkin, T., Iwasawa, K., Haan, S., Murphy, E. J., Stierwalt, S., Appleton, P. N., Barnes, J. E., Bothun, G., Bridge, C. R., Chan, B., Charmandaris, V., Frayer, D. T., Kewley, L. J., Kim, D. C., Lord, S., Madore, B. F., Marshall, J. A., Matsuhara, H., Melbourne, J. E., Rich, J., Schulz, B., Spoon, H. W. W., Sturm, E., U, V., Veilleux, S., & Xu, K. 2010, AJ, 140, 63
- Irwin et al. (2003) Irwin, J. A., Athey, A. E., & Bregman, J. N. 2003, ApJ, 587, 356
- Iwasawa et al. (2011) Iwasawa, K., Sanders, D. B., Teng, S. H., U, V., Armus, L., Evans, A. S., Howell, J. H., Komossa, S., Mazzarella, J. M., Petric, A. O., Surace, J. A., Vavilkin, T., Veilleux, S., & Trentham, N. 2011, A&A, 529, A106
- Just et al. (2007) Just, D. W., Brandt, W. N., Shemmer, O., Steffen, A. T., Schneider, D. P., Chartas, G., & Garmire, G. P. 2007, ApJ, 665, 1004
- Kennicutt (1998) Kennicutt, Jr., R. C. 1998, ApJ, 498, 541
- Kennicutt et al. (2009) Kennicutt, Jr., R. C., Hao, C.-N., Calzetti, D., Moustakas, J., Dale, D. A., Bendo, G., Engelbracht, C. W., Johnson, B. D., & Lee, J. C. 2009, ApJ, 703, 1672
- Kocevski et al. (2012) Kocevski, D. D., Faber, S. M., Mozena, M., Koekemoer, A. M., Nandra, K., Rangel, C., Laird, E. S., Brusa, M., Wuyts, S., Trump, J. R., Koo, D. C., Somerville, R. S., Bell, E. F., Lotz, J. M., Alexander, D. M., Bournaud, F., Conselice, C. J., Dahlen, T., Dekel, A., Donley, J. L., Dunlop, J. S., Finoguenov, A., Georgakakis, A., Giavalisco, M., Guo, Y., Grogin, N. A., Hathi, N. P., Juneau, S., Kartaltepe, J. S., Lucas, R. A., McGrath, E. J., McIntosh, D. H., Mobasher, B., Robaina, A. R., Rosario, D., Straughn, A. N., van der Wel, A., & Villforth, C. 2012, ApJ, 744, 148
- Komossa (2006) Komossa, S. 2006, Mem. Soc. Astron. Italiana, 77, 733
- Komossa et al. (2003) Komossa, S., Burwitz, V., Hasinger, G., Predehl, P., Kaastra, J. S., & Ikebe, Y. 2003, ApJ, 582, L15
- Koss et al. (2011) Koss, M., Mushotzky, R., Veilleux, S., Winter, L. M., Baumgartner, W., Tueller, J., Gehrels, N., & Valencic, L. 2011, ApJ, 739, 57
- Lawrence et al. (1999) Lawrence, A., Rowan-Robinson, M., Ellis, R. S., Frenk, C. S., Efstathiou, G., Kaiser, N., Saunders, W., Parry, I. R., Xiaoyang, X., & Crawford, J. 1999, MNRAS, 308, 897
- Lehmer et al. (2010) Lehmer, B. D., Alexander, D. M., Bauer, F. E., Brandt, W. N., Goulding, A. D., Jenkins, L. P., Ptak, A., & Roberts, T. P. 2010, ApJ, 724, 559
- Levenson et al. (2005) Levenson, N. A., Weaver, K. A., Heckman, T. M., Awaki, H., & Terashima, Y. 2005, ApJ, 618, 167
- Liedahl et al. (1995) Liedahl, D. A., Osterheld, A. L., & Goldstein, W. H. 1995, ApJ, 438, L115
- Liu et al. (2012) Liu, X., Shen, Y., & Strauss, M. A. 2012, ApJ, 745, 94
- Mathur et al. (2012) Mathur, S., Fields, D., Peterson, B. M., & Grupe, D. 2012, ApJ, 754, 146
- Mewe et al. (1985) Mewe, R., Gronenschild, E. H. B. M., & van den Oord, G. H. J. 1985, A&AS, 62, 197
- Mewe et al. (1986) Mewe, R., Lemen, J. R., & van den Oord, G. H. J. 1986, A&AS, 65, 511
- Mineo et al. (2014) Mineo, S., Gilfanov, M., Lehmer, B. D., Morrison, G. E., & Sunyaev, R. 2014, MNRAS, 437, 1698
- Mineo et al. (2012) Mineo, S., Gilfanov, M., & Sunyaev, R. 2012, MNRAS, 419, 2095
- Miniutti et al. (2007) Miniutti, G., Ponti, G., Dadina, M., Cappi, M., & Malaguti, G. 2007, MNRAS, 375, 227
- Miralles-Caballero (2012) Miralles-Caballero, D. 2012, PhD thesis, PhD Thesis, 2012
- Moustakas & Kennicutt (2006) Moustakas, J. & Kennicutt, Jr., R. C. 2006, ApJS, 164, 81
- Muzzin et al. (2012) Muzzin, A., Wilson, G., Yee, H. K. C., Gilbank, D., Hoekstra, H., Demarco, R., Balogh, M., van Dokkum, P., Franx, M., Ellingson, E., Hicks, A., Nantais, J., Noble, A., Lacy, M., Lidman, C., Rettura, A., Surace, J., & Webb, T. 2012, ApJ, 746, 188
- Nardini et al. (2013) Nardini, E., Wang, J., Fabbiano, G., Elvis, M., Pellegrini, S., Risaliti, G., Karovska, M., & Zezas, A. 2013, ApJ, 765, 141
- Nomoto et al. (2006) Nomoto, K., Tominaga, N., Umeda, H., Kobayashi, C., & Maeda, K. 2006, Nuclear Physics A, 777, 424
- Pereira-Santaella et al. (2011) Pereira-Santaella, M., Alonso-Herrero, A., Santos-Lleo, M., Colina, L., Jiménez-Bailón, E., Longinotti, A. L., Rieke, G. H., Ward, M., & Esquej, P. 2011, A&A, 535, A93
- Persic & Rephaeli (2002) Persic, M. & Rephaeli, Y. 2002, A&A, 382, 843
- Persic & Rephaeli (2003) —. 2003, A&A, 399, 9
- Piconcelli et al. (2010) Piconcelli, E., Vignali, C., Bianchi, S., Mathur, S., Fiore, F., Guainazzi, M., Lanzuisi, G., Maiolino, R., & Nicastro, F. 2010, ApJ, 722, L147
- Ptak et al. (2003) Ptak, A., Heckman, T., Levenson, N. A., Weaver, K., & Strickland, D. 2003, ApJ, 592, 782
- Ranalli et al. (2003) Ranalli, P., Comastri, A., & Setti, G. 2003, A&A, 399, 39
- Remillard & McClintock (2006) Remillard, R. A. & McClintock, J. E. 2006, ARA&A, 44, 49
- Sanders et al. (2003) Sanders, D. B., Mazzarella, J. M., Kim, D.-C., Surace, J. A., & Soifer, B. T. 2003, AJ, 126, 1607
- Sanders & Mirabel (1996) Sanders, D. B. & Mirabel, I. F. 1996, ARA&A, 34, 749
- Sani et al. (2010) Sani, E., Lutz, D., Risaliti, G., Netzer, H., Gallo, L. C., Trakhtenbrot, B., Sturm, E., & Boller, T. 2010, MNRAS, 403, 1246
- Santini et al. (2012) Santini, P., Rosario, D. J., Shao, L., Lutz, D., Maiolino, R., Alexander, D. M., Altieri, B., Andreani, P., Aussel, H., Bauer, F. E., Berta, S., Bongiovanni, A., Brandt, W. N., Brusa, M., Cepa, J., Cimatti, A., Daddi, E., Elbaz, D., Fontana, A., Förster Schreiber, N. M., Genzel, R., Grazian, A., Le Floc’h, E., Magnelli, B., Mainieri, V., Nordon, R., Pérez Garcia, A. M., Poglitsch, A., Popesso, P., Pozzi, F., Riguccini, L., Rodighiero, G., Salvato, M., Sanchez-Portal, M., Sturm, E., Tacconi, L. J., Valtchanov, I., & Wuyts, S. 2012, A&A, 540, A109
- Serber et al. (2006) Serber, W., Bahcall, N., Ménard, B., & Richards, G. 2006, ApJ, 643, 68
- Shapiro et al. (1976) Shapiro, S. L., Lightman, A. P., & Eardley, D. M. 1976, ApJ, 204, 187
- Shemmer et al. (2008) Shemmer, O., Brandt, W. N., Netzer, H., Maiolino, R., & Kaspi, S. 2008, ApJ, 682, 81
- Summers et al. (2004) Summers, L. K., Stevens, I. R., Strickland, D. K., & Heckman, T. M. 2004, MNRAS, 351, 1
- Sunyaev & Titarchuk (1980) Sunyaev, R. A. & Titarchuk, L. G. 1980, A&A, 86, 121
- Surace (1998) Surace, J. A. 1998, PhD thesis, Institute for Astronomy University of Hawaii 2680 Woodlawn Dr. Honolulu, HI 96822
- Teng et al. (2009) Teng, S. H., Veilleux, S., Anabuki, N., Dermer, C. D., Gallo, L. C., Nakagawa, T., Reynolds, C. S., Sanders, D. B., Terashima, Y., & Wilson, A. S. 2009, ApJ, 691, 261
- Tombesi et al. (2010) Tombesi, F., Cappi, M., Reeves, J. N., Palumbo, G. G. C., Yaqoob, T., Braito, V., & Dadina, M. 2010, A&A, 521, A57
- Toomre & Toomre (1972) Toomre, A. & Toomre, J. 1972, ApJ, 178, 623
- Van Wassenhove et al. (2012) Van Wassenhove, S., Volonteri, M., Mayer, L., Dotti, M., Bellovary, J., & Callegari, S. 2012, ApJ, 748, L7
- Vattakunnel et al. (2012) Vattakunnel, S., Tozzi, P., Matteucci, F., Padovani, P., Miller, N., Bonzini, M., Mainieri, V., Paolillo, M., Vincoletto, L., Brandt, W. N., Luo, B., Kellermann, K. I., & Xue, Y. Q. 2012, MNRAS, 420, 2190
- Veilleux et al. (2002) Veilleux, S., Kim, D.-C., & Sanders, D. B. 2002, ApJS, 143, 315
- Veilleux & Osterbrock (1987) Veilleux, S. & Osterbrock, D. E. 1987, ApJS, 63, 295
- Williams et al. (2004) Williams, R. J., Mathur, S., & Pogge, R. W. 2004, ApJ, 610, 737
- Wilms et al. (2000) Wilms, J., Allen, A., & McCray, R. 2000, ApJ, 542, 914
- Yuan et al. (2010) Yuan, T.-T., Kewley, L. J., & Sanders, D. B. 2010, ApJ, 709, 884