A Deep X-ray View of the Hot Halo in the Edge-on Spiral Galaxy NGC 891
Abstract
NGC 891 is a nearby edge-on galaxy that is similar to the Milky Way and has a hot X-ray emitting halo that could arise from accretion, a galactic fountain, or a combination of the two. The metallicity of the gas can help distinguish between these models, and here we report on results that use 138 ks of archival Chandra data and 92 ks of new XMM-Newton data to measure the temperature and metallicity of the hot halo of the galaxy. We find good fits for a thermal model with keV and , and rule out solar metallicity to more than 99% confidence. This result suggests accretion from the intergalactic medium as the origin for the hot halo. However, it is also possible to fit a two-temperature thermal model with solar metallicity where keV and keV. A consideration of the cooling rate and scale height prefers the single-temperature model. We also find that the cooling rate in the hot gas cannot explain the massive H I halo in the steady state. In addition, a galactic fountain model cannot eject enough mass to account for the H I halo, and we speculate that the neutral halo may be gas from a prior outflow that has since cooled.
Subject headings:
galaxies: individual (NGC 891) – galaxies: abundances – galaxies: halos – X-rays: galaxies1. Introduction
The hot halos of spiral galaxies like our own are reservoirs of K gas whose origin is unclear. These halos are potentially important to galaxy formation theories because some closed-box models of Galactic chemical evolution predict a larger number of metal-poor stars in the solar neighborhood than we observe (the G-dwarf or M-dwarf problem, see van den Bergh, 1962; Woolf & West, 2012), and this issue is not isolated to the Milky Way (e.g. Worthey et al., 1996). This problem can be solved by the accretion of low-metallicity gas onto the disk from the halo. In addition, Sancisi et al. (2008) argue that about yr-1 of accretion onto the disk is required to sustain the star formation rate (SFR) of typical spirals; Binney et al. (2000) find that the SFR in the solar neighborhood has been nearly constant for the past 11 Gyr for a Salpeter initial mass function, so star formation may indeed be sustained for long times. It is not yet clear whether the required accretion occurs primarily via condensation of a radiatively cooling hot halo or cold flows and minor mergers (for a review of cold accretion, see Sancisi et al., 2008).
It is also unclear whether the hot halo is gas accreted from the local intergalactic medium (IGM) as suggested by Cox & Smith (1976). Instead, they may be gas expelled from the disk by supernovae (SNe) in a “galactic fountain” (Shapiro & Field, 1976; Bregman, 1980). Both can explain the observed hot halos: in the case of accretion, infalling gas from the IGM shocks and is heated to the dynamical temperature, whereas a galactic fountain forms the hot halo as superbubbles powered by hundreds of SNe break out of the galactic disk and vent their contents to the halo.
Since both the galactic fountain and accretion from the IGM are expected to occur, it is not clear which contributes most to the hot halo. For example, if the supernova rate is too low, the bubbles may never break out or only contribute to a halo with a small scale height. As both mechanisms can produce a halo with a similar temperature and disk condensation rate, the simplest way to distinguish them is the metallicity of the hot gas, which should be close to the IGM value in the accretion scenario ( in a spiral-rich cluster such as HCG 16; Belsole et al., 2003), and solar or super-solar in the fountain scenario.
The hot halos are visible in the soft X-rays where the metallicity can be measured directly. Since edge-on spirals allow for clean separation of the disk and halo emission while amplifying the surface brightness of the halo, they are the ideal candidates for this measurement.
In this paper, we present an X-ray study of the hot halo of NGC 891 using Chandra and XMM-Newton data to measure the halo metallicity. NGC 891 is a nearby ( Mpc; Temple et al., 2005) edge-on spiral thought to be a close Milky Way analog in luminosity and spectral type (e.g. van der Kruit & Searle, 1981), and, as in our Galaxy, there is dynamical evidence for a bar (Garcia-Burillo & Guelin, 1995). NGC 891 is not interacting with other galaxies, is almost perfectly edge-on, and has no optical or H I warp (Rupen, 1991; Swaters et al., 1997), allowing an unambiguous distinction between halo and disk emission. However, it is known to be slightly lopsided (Sancisi & Allen, 1979). The primary aim of our study is to measure the metallicity of the hot halo directly from the X-ray data. A summary of basic parameters for NGC 891 is given in Table 2.
NGC 891 is of particular interest because it is the X-ray brightest of normal edge-on galaxies (Bregman & Houck, 1997) and has been held up as a prime example of a galactic fountain in action. The evidence in favor of such a fountain is quite strong, enabling us to determine whether the X-ray emitting gas is an important participant in the fountain or largely decoupled accreted material that slowly settles onto the disk. We review the evidence presently.
First, the disk appears to be dynamically connected to the halo. The cold H I halo rotates differentially, with rotation velocity decreasing with distance from the disk (Oosterloo et al., 2007), and the spatial structure of the radio emission correlates with that of the H halo (Dettmar, 1990) and the X-rays (Bregman & Pildis, 1994; Strickland et al., 2004), being concentrated in the north and near the disk. The SFR is also highest here, which Tüllmann et al. (2006) argue leads naturally to the observed distribution since the amount of hot gas is proportional to the energy injected by supernovae. This is consistent with the dust halo (Howk & Savage, 1997, 2000), which shows more pronounced filaments on the northern side (although perhaps just as many on the southern side), but we note that Garcia-Burillo et al. (1992) find that the extended molecular halo is consistent with being symmetric about the rotation axis.
Second, there is strong evidence for magnetic fields lacing the halo that are naturally explained by a galactic fountain. There is radio synchrotron emission cospatial with the H I halo out to 10 kpc away from the disk (Oosterloo et al., 2007), and there are collimated H filaments that extend a few kpc above the disk (Rossa et al., 2004). This suggests that the magnetic field originates in the disk (Dahlem et al., 1994).
Finally, clear evidence of supernova activity is visible in the disk. Rossa et al. (2004) find superbubbles and shells near the midplane, as well as filamentary structures that appear to be connected to the disk superbubbles. These may signify breakouts from the disk where the hot medium can rise into the halo.
The rest of this paper is organized as follows. In Section 2, we describe the X-ray observations of NGC 891 and how we processed the resultant data. Section 3 contains the temperatures and metallicities we derive from fits to the spectra, as well as estimates of the uncertainties in these parameters from various systematic effects. We present two competing models that cannot be spectroscopically distinguished with the present data, so in the first part of Section 4 we appeal to the expected cooling rate and morphology of the hot halo in each model. Afterward, we consider more generally whether the hot gas is coupled to the neutral halo and whether the system is in a steady state. We conclude by summarizing our results and arguments.
2. X-ray Observations & Processing
We processed new and archival X-ray data from the Chandra X-ray Observatory and XMM-Newton (Table 2). Our primary goal was to measure the metallicity of the hot halo, which is visible in the soft X-rays. To do so, we extract spectra from regions on the detectors corresponding to the halo and fit them with a thermal plasma model, assuming collisional ionization equilibrium. In the remainder of this section, we describe the observations and processing, surface brightness maps, and our spectral fitting method.
| Parameter | Units | Value |
|---|---|---|
| (J2000)aafootnotemark: | 02h22m33.4s | |
| (J2000)aafootnotemark: | +42d20m57s | |
| bbfootnotemark: | (Mpc) | 9.8 |
| ccfootnotemark: | 0.00176 | |
| ddfootnotemark: | (deg) | 89 |
| Scaleaafootnotemark: | (kpc arcmin-1) | 2.2 |
| Morphologyeefootnotemark: | SBb | |
| ddfootnotemark: | () | |
| ddfootnotemark: | () | |
| fffootnotemark: | (erg s-1) | |
| aafootnotemark: | (mag) | 10.81 |
| SFRggfootnotemark: | ( yr-1) | 3.8 |
2.1. Chandra Reduction
We used two archival Chandra observations from 2000-11-01 (obsID 794) and 2003-12-10 (obsID 4613) with a combined exposure time of 170 ks. These data have previously been published by Strickland et al. (2004) and Temple et al. (2005). The data were reprocessed using standard Chandra Interactive Analysis of Observations (CIAO v4.4) software recipes to create level=2 files. We extracted light curves from background regions in the keV range to look for flaring exceeding 3 from the mean count rate. A large flare affected the last 23 ks of obsID 794, and intermittent short flares affect about 5 ks of obsID 4613, leaving 138 ks of good time. Our analysis is confined to the exposure-corrected ACIS-S3 chip except where otherwise mentioned. We then used the wavdetect algorithm implemented in CIAO to create point source masks in the keV bandpass, with manual filtering for anomalous regions near the chip edges. In practice, this eliminates point sources down to a flux of erg s-1 cm-2 in the keV band near the center of the merged exposure (where the PSF is small) based on the faintest sources detected there. The 5 point source sensitivity in the keV band for the merged exposures is about erg s cm-2.
| Date | Observatory | Detectors | Exp. Time | Sum GTIs | Obs. ID |
|---|---|---|---|---|---|
| (ks) | (ks) | ||||
| 1993-08-27 | ROSAT | PSPC | 31 | 31 | RP500266N00 |
| 2000-11-01 | Chandra | ACIS-S | 51 | 30 | 794 |
| 2003-12-10 | Chandra | ACIS-S | 121 | 108 | 4613 |
| 2011-08-25 | XMM-Newton | EPIC MOS/pn | 133 | 92 | 0670950101 |
2.2. XMM-Newton Reduction
We obtained a 133 ks XMM-Newton observation of NGC 891 on 2011-08-25 (obsID 0670950101). An archival shorter exposure has been published by Temple et al. (2005), but it is severely affected by flaring and shows diffuse emission only near the bulge, so we omit it from this study. The data were obtained using the “medium” filter, meaning at 1 keV the total EPIC effective area is about 1200 cm-2 (cf. 555 cm-2 for Chandra). The data were processed using the standard reduction tasks for the EPIC cameras in the Scientific Analysis System software (SAS v11.0) and screened for proton flaring, after which 92 ks of good time remains. Unlike the Chandra images, this exposure is severely contaminated by the presence of a bright new source with an absorbed keV flux of erg s-1 near the disk of the galaxy. This source, which we argue is an ultraluminous X-ray source (ULX) in NGC 891 (Hodges-Kluck et al., 2012), was not present in the Chandra observations nor any archival X-ray observation publicly available.
After standard processing, including exposure correction, we created Swiss-cheese point-source masks using the cheese and cheese-bands scripts in the XMM-Newton Extended Source Analysis Software111see http://heasarc.gsfc.nasa.gov/docs/xmm/xmmhp_xmmesas.html (XMM-ESAS), which are included in SAS (Snowden et al., 2004). We used a cutoff flux of erg s-1 cm-2 in the keV bandpass. The XMM-Newton point source sensitivity for this exposure is about erg s-1 cm-2 in the pn and slightly worse in the MOS detectors222for nominal values, see http://xmm.esa.int/external/xmm_user_support/documentation/uhb_2.5/node38.html.
When compared to the masks produced for the Chandra data, we find good agreement near the central region except for the ULX, which we excise to the 90% encircled energy radius (1 arcmin). We also note that chip 5 on the MOS 1 detector has anomalously high background and is removed from analysis; however, no significant source emission falls on this chip.
2.3. X-ray Images & Scale Height
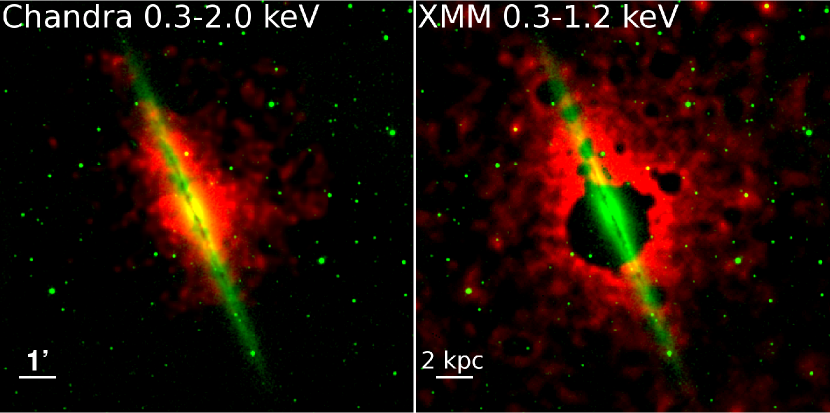
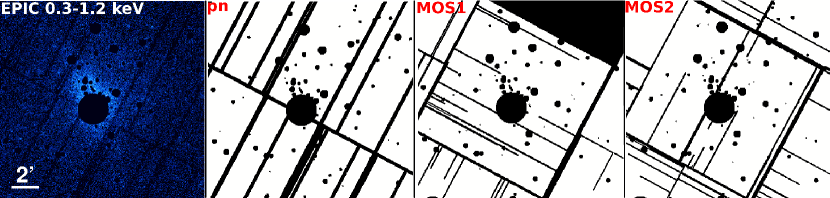
The diffuse emission associated with the hot halo can be seen in adaptively smoothed maps of the soft emission with point sources removed (Figure 1; the large cavity on the right is the ULX mask, and the point source masks for each EPIC camera are shown in Figure 2). The left panel shows the bright emission close to the disk seen by Chandra. Little emission comes from the disk itself (where the soft X-rays from the ISM are absorbed by the high column), and the emission immediately outside is dominated by the bulge near the galactic center. The non-bulge emission is primarily seen to the north of the galactic center and is concentrated within about 1.5 kpc of the disk. This is the halo emission most obvious at lower sensitivities (Bregman & Pildis, 1994), and it correlates with the diffuse ionized (H) halo (Dettmar, 1990) and higher SFR on the northern side. In the deeper XMM-Newton image to the right, it is evident that the diffuse X-ray emission extends much farther from the bulge (also described in the ROSAT observation in Bregman & Pildis, 1994) and is more symmetric on larger scales. The diffuse emission is much more evident in the XMM-Newton image in Figure 1 due to the higher effective area of the telescope and the moderate angular resolution (6 arcsec) compared to Chandra (0.5 arcsec).
The difference between the emission on large and small scales means that it is possible that the physical properties of the emitting gas are also different. For fitting purposes it is also convenient to extract spectra from regions near the disk (where the H I absorption is strong and variable, see Figure 3) and regions where the dominant column is the Galactic one. Since is somewhat degenerate with and at CCD spectral resolution, the cleanest measurement of can be made in the latter case. We therefore divide the X-ray emission into two regions: the “inner halo” (where absorption must be modeled explicitly) and the “outer halo” (where we use the Galactic column only). The inner halo is defined as the region more than two optical scale heights above the disk midplane ( pc in Xilouris et al., 1998, and we adopt 300 pc) but below where the H I absorbing column falls to half the Galactic value of cm-2 (Kalberla et al., 2005), which is between 1.5–3 kpc depending on position along the disk (Figure 3). The inner boundary is chosen to exclude X-ray binary emission, as ISM disk emission is negligible. The outer halo is simply the region above this (where the Galactic column dominates absorption) out to where the source emission falls below the background.
In practice, defining the rotation axis of the galaxy as and the projected midplane axis as , the inner halo has boundaries (0.6 kpc2.8 kpc) and the outer halo ( kpc). For extraction purposes, we make boxes whose length in is the projected disk length (7 arcmin or 15 kpc).
Filamentary structure and signs of outflows are common in X-ray images of edge-on (mostly starburst) galaxies (e.g. Strickland et al., 2004). We searched for structure by making unsharp masks of the Chandra and XMM-Newton data and looking for overlap. Although apparent filaments are visible in each dataset, there is little agreement between images. On closer inspection, the putative filaments often include emission near point source masks. Because the PSF wings produce enhanced surface brightness over the background while the mask itself is a decrement, filamentary structure can be mimicked when a subtracted source is near two (intrinsically uncorrelated) regions with higher surface brightness. We also find that several of the structures in the XMM-Newton map include point sources that were too faint or distorted to be identified by the cheese algorithm but are obvious in the Chandra data. We find no evidence for outflow-like or filamentary structures in the data, but as the emission is integrated through the halo we cannot rule it out.
The outer halo is approximately symmetric about and and is best seen in the XMM-Newton image (Figure 1), as the outer halo is about as wide as the Chandra ACIS-S3 chip. To estimate the scale height, we use the exposure-corrected, point-source subtracted data in the keV bandpass for Chandra and keV for XMM-Newton.
If circular annuli are used, a blind radial profile including the bulge emission in the Chandra image yields a surface brightness scale height of 2 arcmin (4 kpc). The bulge and halo are separate components, with the bulge having a smaller scale height and larger surface brightness. This suggests a larger scale height for the halo.
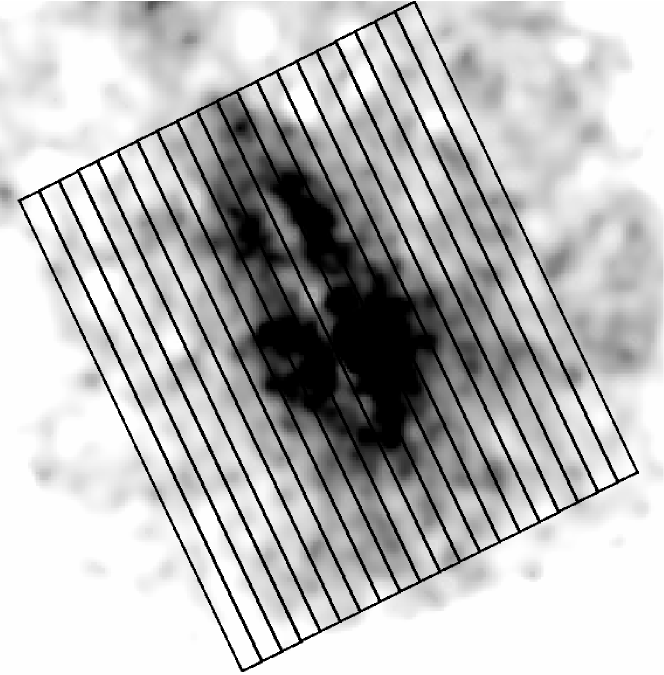
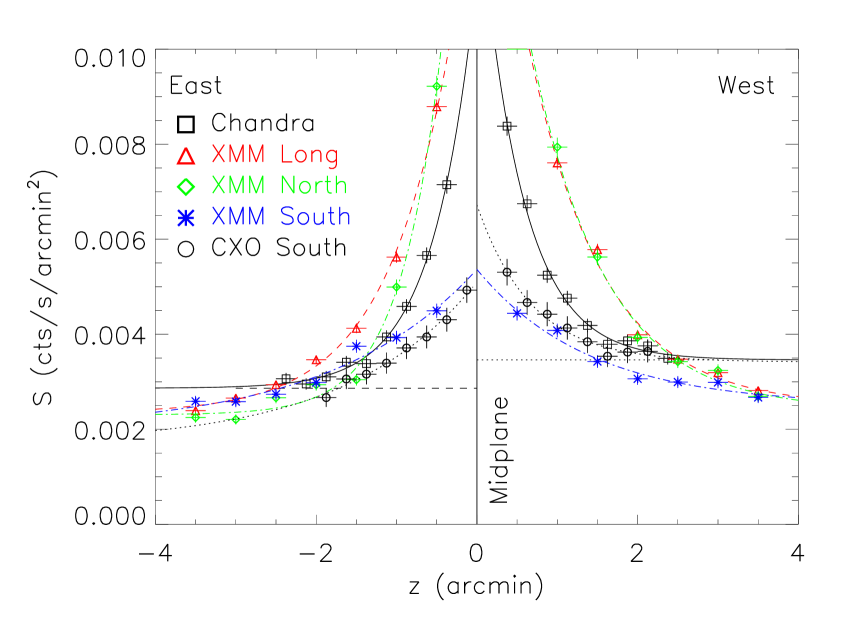
As the halo may not be spherically symmetric, we can measure the profile in using regions parallel to the midplane of the galaxy (similar to the approach used for the NGC 891 Chandra data in Strickland et al., 2004). This profile is shown in Figure 4. The image on top is the adaptively smoothed Chandra image, with the 6 arcmin by 0.25 arcmin boxes we used overlaid on the image. The mean surface brightness in each region is shown in the bottom panel, and is blindly corrected for the point source masks and other unexposed areas by scaling to the nominal area in each box.
The Chandra data are shown as the black boxes in the bottom panel of Figure 4, and includes the bulge emission. To derive the scale height, we fit an exponential profile (), finding arcmin (1.3 kpc) for the Chandra data. This is similar to that in Strickland et al. (2004) based on their encircled light values, and somewhat smaller than the ROSAT value reported by Bregman & Pildis (1994). The XMM-Newton values are shown as red triangles in Figure 4 and result in a slightly larger arcmin (2 kpc). As these values are extracted in wider boxes (6 arcmin by 0.5 arcmin) because of the large point source masks, we expect a bias towards higher . On the other hand, the XMM-Newton images mask most of the bulge emission (under the ULX point source mask) that is included in the Chandra fit. Since the spectrum of the bulge emission shows that it is clearly a different physical component (which we expect to have a smaller scale height), the Chandra value quoted above is probably too small. Since the bulge emission is not entirely masked in the XMM-Newton image, we can improve this value by ignoring a region within about an arcminute of the galactic center. We do this by extracting profiles in 3 arcmin by 0.5 arcmin north and south of the bulge in the XMM-Newton data, seen as green diamonds and blue stars in Figure 4 respectively.
The similarity between the values for the long boxes and the northern shorter boxes in Figure 4 shows that the correction is small, with the dominant component being the bright emission near the disk on the north side. The halo emission itself is asymmetric both north-to-south and east-to-west. The north–south asymmetry is well known and can be easily seen in Figure 4 where the boxes are centered on the galactic center. The east–west asymmetry can be seen in the horizontal dashed and dotted lines in Figure 4, which represent a constant “background” in the fit to the Chandra data. Despite nearly identical scale heights on either side of the galaxy, the west side is decidedly brighter out to the extent of the S3 chip. Emission in the wings of the PSF of bright subtracted point sources can account for less than 20% of the discrepancy. A cluster of faint point sources cannot be ruled out.
On the north side of the bulge, we find arcmin (2 kpc) east of the galaxy and arcmin (1.3 kpc) on the west side. In contrast,Z the surface brightnesses obtained on the south side of the bulge indicate scale heights of arcmin (3.2 kpc) east of the disk and arcmin (3.9 kpc) to the west. The difference in these values suggests that the inner halo may be a separate physical component.
However, the scale height is very sensitive to the innermost surface brightness values. These values are the most affected by the point source masks (which are more concentrated near the disk), the bulge, and the residual 10% of the ULX emission. The change in surface brightness across each extraction zone is also highest near the disk, so our blind correction to the nominal area increases the uncertainty in these bins far beyond the errors plotted in Figure 4.
Still, it is likely that the true scale height, at least in the outer halo, is even larger than the arcmin found in the southern boxes in the XMM-Newton data. When we correct for the bulge and ULX by subtracting model profiles (assuming a circular PSF for the ULX and a circular model fit to the bulge in the Chandra data), increases to near 1.0 arcmin in the northern boxes (where the inner halo is bright) and 2.5 arcmin in the southern boxes. This is because is highly sensitive to the mean surface brightness in the innermost bins, which is overestimated according to these corrections. Overall, a scale height of arcmin ( kpc) is likely in the outer halo. The density scale height is twice this value, or kpc, which is consistent with Bregman & Pildis (1994) considering they included all diffuse emission. In any case, a scale height below 1 arcmin is strongly disfavored.
Finally, we note that there is a patch of diffuse emission to the northwest of the galaxy with approximately a 12 arcmin separation. This is visible in both the Chandra and XMM-Newton data and the emission is centered near 02h21m32.2s, 42d25m12s. The emission is roughly circular with a radius of about 2 arcmin, but it has some substructure with a brighter “bar” running roughly parallel to NGC 891. The emission is near the Chandra point source CXOSEXSI J022142.6+422654 (which may also be 1AXG J022139+4226, a source identified as 0.5 arcmin away but in an error circle of 1.1 arcmin). We have not found any records in the literature of this source despite its appearance in the ACIS-I chips of the archival Chandra data, and unfortunately the optical and IR data at this position is limited. In 2MASS and Palomar/DSS images, we see no obvious signs of clustering. An Xspec apec fit with only Galactic absorption finds a good fit for keV, so we speculate that this is a galaxy cluster at unknown redshift. The keV flux is erg s cm-2.
2.4. Source Spectra
We extracted inner and outer halo spectra from the regions described above in point-source subtracted, exposure-corrected data. The Chandra spectra were separately extracted from obsIDs 794 and 4613 and combined, with corresponding response files generated. We likewise extracted background spectra from regions near the edge of the ACIS-S3 chip. The XMM-Newton spectra were extracted from analogous regions, and we generated their response files using the XMM-ESAS scripts mos-spectra, pn-spectra, mos_back, and pn_back. All of the spectra were binned to 25 counts per bin for fitting. We restrict the fitting bandpass in the Chandra data from keV. Above 2.0 keV, there is little source flux and the data do not constrain any fit. Likewise, the XMM-Newton data are fitted between keV in the MOS and keV in the pn. The lower bounds are determined by the rise of the low-energy particle background in each detector.
We use Xspec v12.7.1 for spectral fitting (Arnaud, 1996). We use as the goodness-of-fit parameter, and define an acceptable model as one that is not ruled out at 95% confidence based on the value. Errors on the model parameters are determined using the Xspec steppar task, and model fluxes are quoted for a keV bandpass.
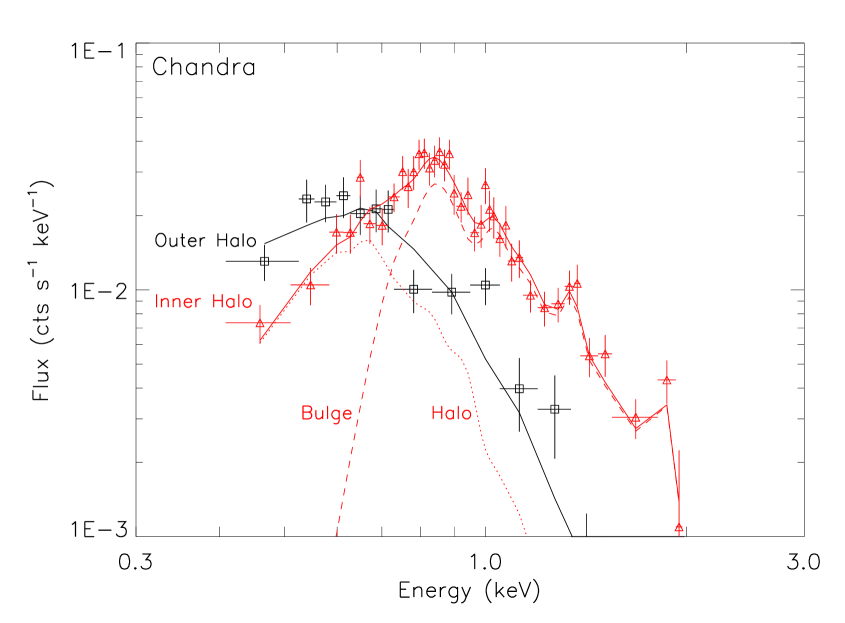
The diffuse source emission is made up of two or more components: the bulge and (inner/outer) halo. We begin with the simplest case of a homogenous halo, but the inner and outer halo may be produced by a galactic fountain and IGM accretion respectively, and so may have different properties. The halo has an X-ray spectrum that peaks near 0.6 keV, whereas the hotter bulge has a spectrum peaking near 0.9 keV (Figure 5). The bulge emission is unimportant in the outer halo, but contributes near the disk. As we expect these to be thermal plasmas in collisional ionization equilibrium, our default model is apec/vapec (Smith et al., 2001). Since photoelectric absorption is important, as an absorption model we adopt TBabs with the abundances of Wilms et al. (2000). All fits incorporate the Galactic absorption column of cm-2 (Kalberla et al., 2005) in addition to variable absorption near the disk. The influence of these choices (by comparison with alternatives) is described in Section 3.
The ULX in the XMM-Newton data contributes approximately 55,000 counts in the pn and 17,000 in each MOS camera in the keV bandpass, peaking near 1 keV. Although we mask the ULX to the 90% encircled energy radius, even outside this it contributes thousands of counts. We adopt as a ULX model the best fitting simple model from Hodges-Kluck et al. (2012): absorbed emission from a hot accretion disk. This model, TBabs*diskpbb, is an excellent fit to the ULX spectrum (/1170 d.o.f. for the combined MOS and pn spectra). We freeze the model parameters to their best-fit values: cm-2, keV, and ( is a free parameter and ; Mineshige et al., 1994). This model is included in all our XMM-Newton fits with the normalization allowed to vary, but we find that it reproduces the expected contribution of the ULX flux very well in annuli around the ULX. The ULX spectrum does vary slightly with radius because the PSF is energy dependent. However, for the relevant energies, the expected difference is approximately 1%, which is smaller than the Poisson uncertainty in the ULX flux in the source extraction regions.
2.5. X-ray Background
The X-ray background includes instrumental noise, particle backgrounds, the cosmic X-ray background, the contribution from the Local Bubble, and the hot Galactic halo. The latter two are particularly important for our purposes because the Galactic halo has a similar temperature ( keV) to that of NGC 891, and the Local Bubble contributes to the emission lines by which we determine the temperature of the source plasma. Such emission is typically subtracted by using a scaled spectrum extracted from nearby source-free regions. However, the emission from NGC 891’s halo covers most of the ACIS-S3 chip and the central chips of the MOS detectors, and the true scale height of the halo is unknown. The XMM-Newton particle background also induces strong fluorescent lines (the Al and Si K lines at 1.49 keV and 1.75 keV are the important lines in our fitting bandpass) that are highly variable with position such that scaled background subtraction leaves large P Cygni type profiles in the keV range. Thus, the background regions for the Chandra data contain an unknown amount of source flux, while those for the MOS detectors (placed farther out) do not directly subtract the instrumental background for the chip of interest. Our analysis fits use the background-subtracted spectra, but we perform parallel fits using background subtracted spectra and raw spectra where most of the background is fit explicitly (with the unexposed chip backgrounds subtracted, following for the Chandra and XMM-Newton data respectively Markevitch et al., 2003; Snowden et al., 2004).
| Spectrum | |||||||
|---|---|---|---|---|---|---|---|
| ( cm-2) | (keV) | () | ( cm-2) | (keV) | () | ||
| Outer Halo ( kpc) | |||||||
| Chandra | 6.5(f) | - | - | - | 102.6 (105) | ||
| MOS 12 | 6.5(f) | - | - | - | 164.5 (180) | ||
| pn | 6.5(f) | - | - | - | 166.1 (175) | ||
| Joint | 6.5(f) | - | - | - | 426.2 (460) | ||
| Inner Halo ( kpc) | |||||||
| Chandra | 1.0(f) | 74.0 (79) | |||||
| MOS 12 | 77(f) | 0.58 (f) | 1.0(f) | 155.5 (152) | |||
| pn | 77(f) | 0.58 (f) | 1.0(f) | 117.2 (97) | |||
| Joint | 1.0(f) | 342.15 (328) | |||||
Note. — The MOS and pn fits include a TBabs*diskpbb component with all parameters except flux frozen as described in the text. The fits corresponding to these models are shown in Figure 6. Errors are quoted at the 90% confidence interval based on the Xspec task steppar, and (f) designates a frozen parameter.
In these fits, we explicitly model the astrophysical backgrounds following the XMM-ESAS recipes. We use the HEASARC X-ray Background Tool333http://heasarc.gsfc.nasa.gov/docs/heasarc/xrayback.html to estimate the background surface brightness from the ROSAT All-Sky Survey (RASS) data. This tool also provides a spectrum and response file, which we use to obtain the flux in each component of the background.
With this tool, one usually defines a large region around the object of interest, assuming that the background is approximately correct for the line of sight. However, there are a few bright diffuse sources within 30 arcmin of NGC 891 (most notably the galaxy cluster containing 3C 66B to the north). Thus, we measure the background in a circle with radius 30 arcmin from an off-position to the southwest. We use the flux in the R45 and R67 bands ( keV). We convert the surface brightness to energy units via the HEASARC WebPIMMS tool444http://heasarc.gsfc.nasa.gov/TOols/w3pimms_pro.html with a keV apec model for the Local Bubble, a keV absorbed apec model for the hot Galactic halo, and an absorbed power law () for the cosmic X-ray background. This yields, in the keV bandpass, a surface brightness of erg s-1 cm-2 arcmin-2. As a consistency check, we measured the surface brightness of the background in a targeted 31.5 ks ROSAT PSPC observation of NGC 891 published by Bregman & Pildis (1994). We measured the keV count rate in a total of arcmin-2 in the exposure-corrected field, avoiding point sources and bright emission to the north and west. This yields a surface brightness erg s-1 cm-2 arcmin-2 in the keV band, which is in agreement with the RASS value.
With the normalization in hand, we fitted the RASS spectrum with three components: the Local Bubble (a thermal component with keV), the Galactic halo (an absorbed apec component with keV), and the cosmic X-ray background (an absorbed power law with ). Although these values may not be exactly correct, there are only a few spectral bins, so we freeze them at the values quoted in the XMM-ESAS manual. We use the Galactic absorbing column of cm-2 for the Galactic halo component. In the keV bandpass, the fit finds that the Local Bubble contributes 6% of the flux, the (absorbed) Galactic halo 34%, and the cosmic X-ray background 56%, which we use to determine the normalizations of the model components in the source regions.
To verify that the Chandra and XMM-Newton background spectra do not have unknown components, we fitted the same model (adding Gaussian components for Al and Si K) but allowed the parameters to float. We find generally good agreement, but the fractional contribution of the Local Bubble is poorly constrained because the spectrum of the keV plasma drops rapidly above 0.3 keV. However, the keV surface brightnesses are in agreement with the ROSAT values: erg s-1 cm-2 arcmin-2 in the MOS, erg s-1 cm-2 arcmin-2 in the pn, and erg s-1 cm-2 arcmin-2 in Chandra, where these model fluxes are quoted for keV but fitted in the bandpasses noted above. These results suggest that the NGC 891 halo surface brightness does indeed drop below the background on the scale of the ACIS-S3 chip and that the regions used for background subtraction are appropriate. Any overestimate of the background flux must be slight, and there do not appear to be large discrepancies between the detectors.
Since the RASS background surface brightness and spectrum appear consistent with the other data, for our explicit background fits we fix the total flux, scaled to the source region, in the X-ray background. In Section 3, we show that fits with background subtraction and fits explicitly fitting the background are in good agreement.
3. Spectral Fits & Halo Metallicity
In this section we present our model fits. Unless stated otherwise, we refer to the background-subtracted spectra. First, we describe single-temperature (1-T) fits to the outer and inner halo, followed by a more complex two-temperature (2-T) model. We then compare the results of our 1-T fits to the fits obtained by fitting the background explicitly. Finally, we discuss several potential sources of systematic error and the effect on our results.
3.1. Models
The models we use for the different spectral components are described in the previous section and summarized here.
The outer halo is represented by an absorbed thermal (TBabs*apec) model, with fixed at the Galactic value. This model represents emission from a hot plasma in collisional ionization equilibrium modified by photoelectric absorption by an intervening column of atomic gas. The inner halo is the same, but with variable. The bulge uses the same model, but with . For the ULX, we use an absorbed accretion disk model (TBabs*diskpbb) as in Hodges-Kluck et al. (2012) and described above. Following Snowden et al. (2004), we model the Local Bubble with an apec model of keV. The Galactic halo and cosmic X-ray background are modeled as TBabs(apec+pow), where is set to the Galactic value, keV, and . The total flux is scaled to the RASS value, and the power in each component is constrained by simulaneously fitting the RASS spectrum. The Al and Si K lines are fit by gauss components, with fixed energy and (instrumental linewidth).
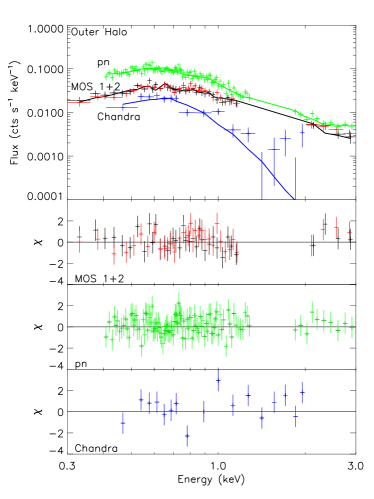
Thus, the 1-T model to the Chandra outer halo is just TBabs*apec, whereas in XMM-Newton data it is TBabs*apec+TBabs*diskpbb. In the inner halo, we add the bulge component. In the fits where the X-ray background is explicitly fitted, we add apec+TBabs(apec+pow) components and Gaussians in the XMM-Newton data. The best fit values for the background-subtracted fits are tabulated in Table 3.
3.2. Outer Halo
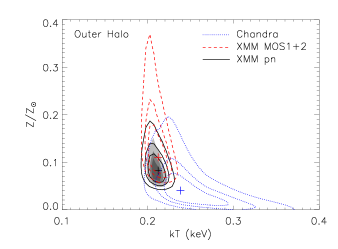
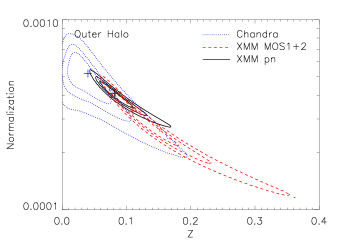
The Chandra spectrum (Figure 6) is fit well by a thermal model with keV and . The MOS and pn spectra prefer a slightly cooler ( keV; Table 3) plasma with a metallicity , but the results agree within their 90% error bars (for a single parameter of interest). This is cooler than the 0.3 keV found in the ROSAT data by Bregman & Pildis (1994), although most of the light in their spectrum comes from the inner halo region. Likewise, it is slightly cooler than the 0.26 keV XMM-Newton value reported by Temple et al. (2005) using a much shorter exposure, but again their spectrum is dominated by the inner halo. All of the fits are excellent (Figure 6) and the temperatures are constrained to 15%.
| Spectrum | Absorbed keV | Norm. Ratio | |||
|---|---|---|---|---|---|
| (keV) | (keV) | EM2/EM1 | |||
| Outer Halo ( kpc) | |||||
| Chandra | 109.4 (105) | ||||
| MOS 12 | 173.2 (180) | ||||
| pn | 169.1 (175) | ||||
| Joint | - | - | 436.5 (460) | ||
| Inner Halo ( kpc) | |||||
| Chandra | 72.2 (79) | ||||
| MOS 12 | 152.3 (152) | ||||
| pn | 111.9 (97) | ||||
| Joint | - | - | 346.4 (328) | ||
Note. — The fits include components as in Table 3, including the ULX in the XMM-Newton data and a thermal bulge component in the inner halo. Errors are quoted at the 90% confidence interval for one parameter of interest based on the Xspec task steppar, and for each value the other is frozen during the error search to prevent reversals. Column 4 is the keV absorbed flux ratio between the two thermal components, and column 5 is the ratio between their model normalizations.
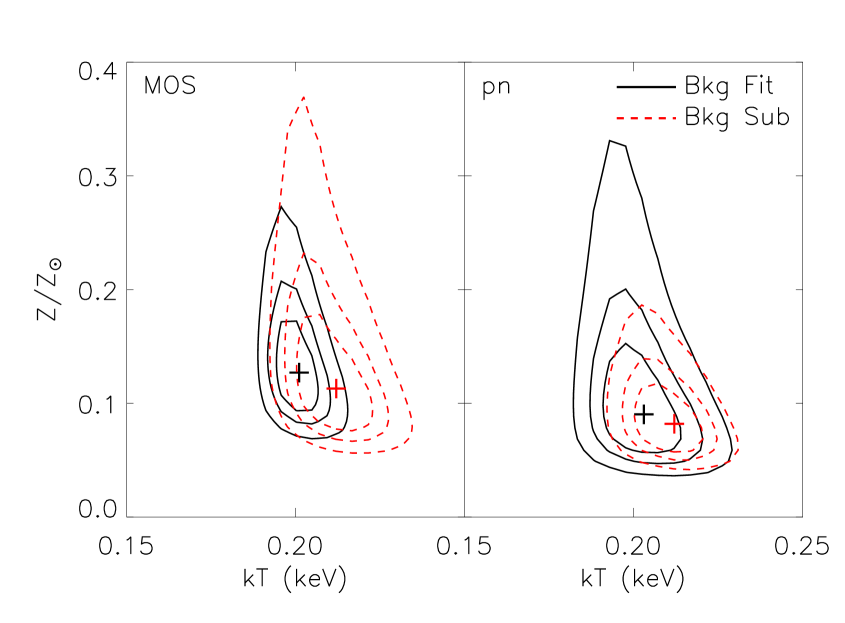
The higher signal and higher spectral resolution of the XMM-Newton data also mitigates the degeneracy between and in the Chandra data, as seen in a 2-parameter contour plot (Figure 7). It is evident from this plot that solar metallicity is ruled out at more than 3 confidence in each detector. There is an important degeneracy between the flux and metallicity (the normalization values have been scaled to the Chandra value due to different extraction areas, and the absolute values are unimportant), but subsolar metallicity is preferred as strongly as in the plot, where the degeneracy between the parameters (which manifests as non-zero slope) is much smaller. Since the results from each detector are largely in agreement (Table 3), we can jointly fit all four spectra with a 1-T model. With a total of 24602 source counts in the fitting bandpass (of which we estimate fewer than 6000 are ULX photons), we find 5 limits of keV and for a single parameter of interest.
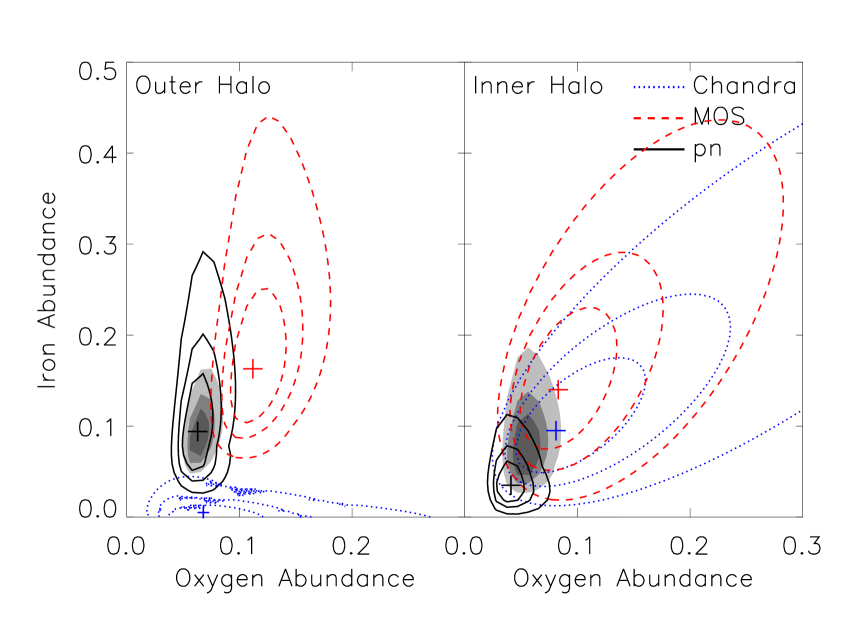
We measure the relative abundances of O and Fe by using a thermal model where the abundances of each metal are variable (vapec). Since all of the elements contribute to the continuum while only some have strong lines in the soft X-ray bandpass, we allow only O and Fe to vary, tying the abundances of like elements to their values and setting the rest to the best-fit value in Table 3 for each spectrum. We note that if the other elemental abundances are tied together but allowed to vary, the best-fit O/Fe value is very similar to that obtained when these abundances are frozen.
The MOS and pn spectra indicate O/Fe0.7, whereas the Chandra spectrum is consistent with , so O/Fe is greater than unity but poorly constrained. The fit contours are shown in Figure 8. As in the apec fits (Figure 7), the MOS has a higher overall metallicity than the pn, but the ratio of O/Fe is similar between the two ( in the MOS and in the pn, well within the statistical error). The Chandra spectrum prefers a lower Fe abundance because of the rather low flux between keV (Figure 6), but the value is poorly constrained, so the joint fit settles on a value near O/Fe0.7 (Figure 8). However, O/Fe is quite sensitive to temperature (higher temperatures tend to depress and increase ). The error bars should therefore be considered to be somewhat larger than the contours in Figure 8.
3.3. Inner Halo
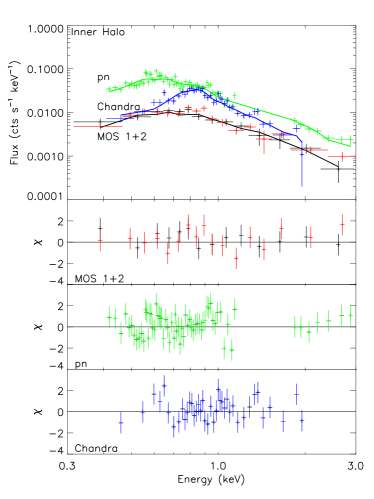
Despite its higher surface brightness, the inner halo contributes far fewer source counts due to the smaller regions we have demarcated. The XMM-Newton spectrum is also more contaminated by the ULX and both the Chandra and XMM-Newton spectra include contamination from the bulge emission (seen especially in the Chandra spectrum in Figure 5). Contamination from the disk is minimal because of our extraction region boundaries (outside two disk scale heights) and the very high absorption towards the disk ( cm-2 in Oosterloo et al., 2007). Finally, varies across the region, so it must remain a free parameter in spectral fits.
We adopt a model analogous to the outer halo where we include a bulge component and allow the column to vary above the Galactic value. As the bulge is nearly cospatial with the ULX in the XMM-Newton data, most of its emission is masked along with the ULX. The remaining bulge contribution is dominated by the Fe L-shell lines between keV, which can be fit by a range of models with high absorption and moderate temperature. We therefore constrain the bulge temperature using the Chandra data. A 1-T model is a poor fit to the Chandra data, so we use a 2-T fit with the bulge metallicity frozen at solar (the metallicity is poorly constrained, but consistent with solar and well above the outer halo value). This yields keV (Table 3). For the bulge contribution in the MOS and pn, we use a thermal component with the absorption and temperature frozen at the Chandra values and the flux free to vary. However, fits with unrealistic bulge fluxes (i.e., comparable to or more than the total Chandra bulge flux) are rejected.
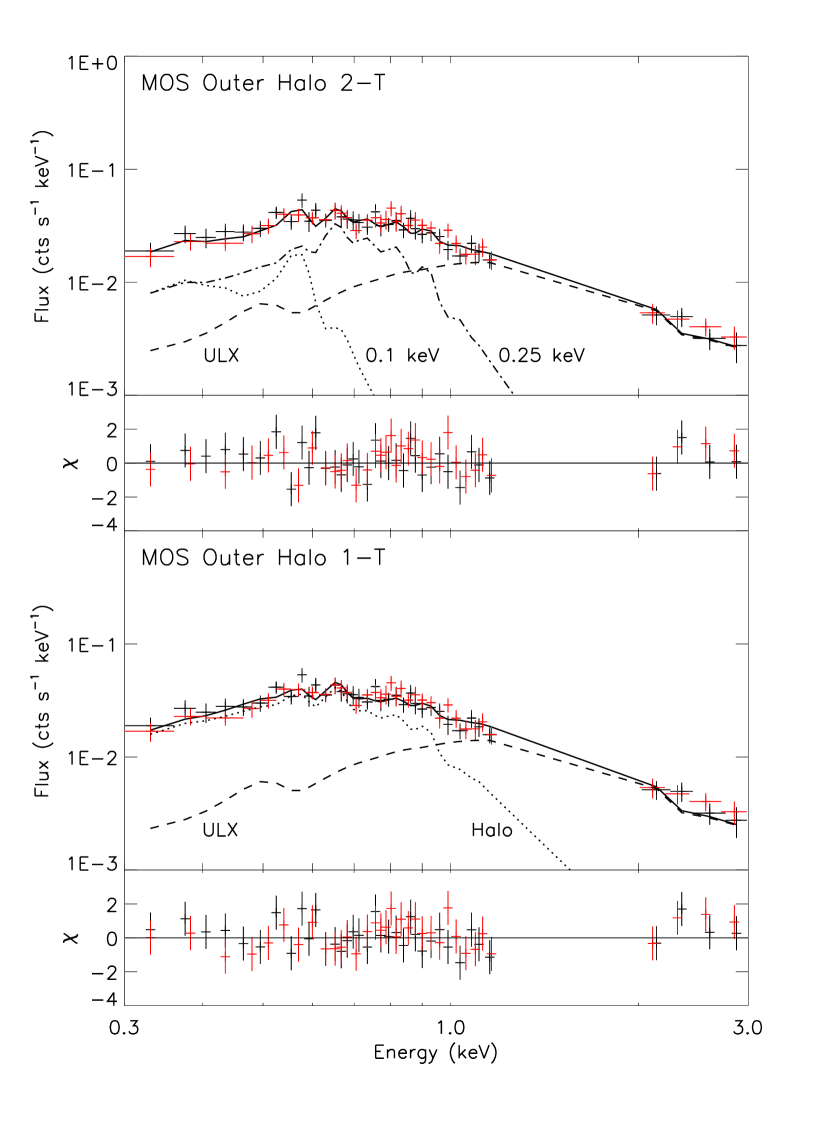
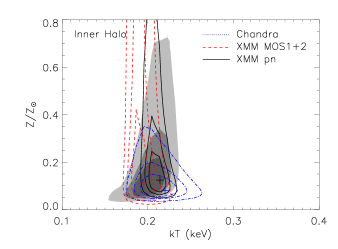
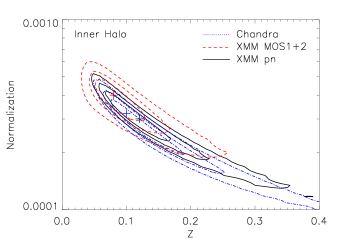
Using this model, we find good fits for thermal models in the EPIC spectra that are consistent with the Chandra data (Table 3). These fits and their residuals are shown in Figure 6. The best-fit temperatures are keV, while the metallicity is near in each spectrum. Because of the lower signal, the confidence intervals for these parameters are substantially wider than in the outer halo (Figure 7). We note that it is possible to find good fits with different combinations of , , and with only small differences in , so while the 2-parameter contours are accurate for the best fit, the 3-parameter region of parameter space with good fits is substantially wider. As might be expected, the temperature is known much better than the metallicity. Still, it is noteworthy that the best-fit parameters in each detector agree not only with each other (within the 90% error bars) but also with the outer halo values (Table 3).
As in the outer halo, we can improve the signal by jointly fitting the four spectra. This yields 3 limits of keV and . The absorbing column is poorly constrained even in the joint fit, with a 3 limit of cm-2 on top of the Galactic value. Based on the H I data (cf. Figure 3), we expect a value above cm-2 but below cm-2, although generally we expect more emission to come from less absorbed regions, biasing the fitted value toward lower values. Thus, we cannot rule out a higher metallicity for the inner halo than the outer halo, but both are likely to be subsolar.
The signal is not sufficient to reliably measure the relative abundances if the bulge component is also allowed to vary. By freezing the bulge component at the best-fit apec values, we can obtain O/Fe values, but these should be interpreted with caution. We proceed as with the outer halo, and Figure 8 shows the resultant contours. Like in the outer halo, the best fits tend to have O/Fe, although the pn now finds a value of O/Fe slightly smaller than 1.0. The Chandra spectrum indicates a higher Fe abundance than in the outer halo, in agreement with the apec fit (Table 3). However, the uncertainty is large and the bulge emission is quite important to this spectrum. If we fit the total Chandra spectrum extracted from both the inner and outer halo, the best-fit value is then O/Fe. The 1 contour for the joint fit is in agreement with the joint fit for the outer halo, but the best fit finds a slightly higher O/Fe. The picture is confused by the bulge emission, but at face value the O/Fe value is slightly higher in the inner halo than the outer halo.
The best-fit values suggest that the inner and outer halo are composed of the same plasma despite the apparent connection between the inner halo morphology and the activity in the disk. “Deprojecting” the Chandra spectrum by using a scaled outer halo spectrum as the background confirms that the inner halo temperature we derive is not merely due to outer halo material in the line of sight. Thus, the hot halo of NGC 891 is consistent with being an isothermal, K plasma. The agreement with the outer halo indicates that the temperatures reported by Bregman & Pildis (1994) and Temple et al. (2005) of 0.3 keV and 0.26 keV respectively may be boosted by contamination from the bulge. However, they are consistent with the limits obtained by fitting the spectra individually, and there is some degeneracy between , , and .
3.4. A 2-T Model
It is also possible to obtain a good fit with a 2-T model where the metallicity of both components is fixed at solar (the bulge emission is treated as above). This fit is motivated by the galactic fountain scenario as well as the many 2-T fits in the literature to the halos (Strickland et al., 2004) and disks (e.g. Tyler et al., 2004) of massive late-type galaxies. The fit requires the first component to have keV and the second to have keV (parameters given in Table 4). The ratio of the emission measure is weighted towards the cooler component.
As in the 1-T model, the inner and outer halo spectra have parameters consistent with each other. The fits in Table 4 are carried out in the same way as in the 1-T model except that we add a second apec component and fix the ULX flux in the XMM-Newton spectra to the best-fit value in the 1-T model. The error on each temperature is computed while freezing the other because they are separated by only keV and can exchange places in the parameter space search.
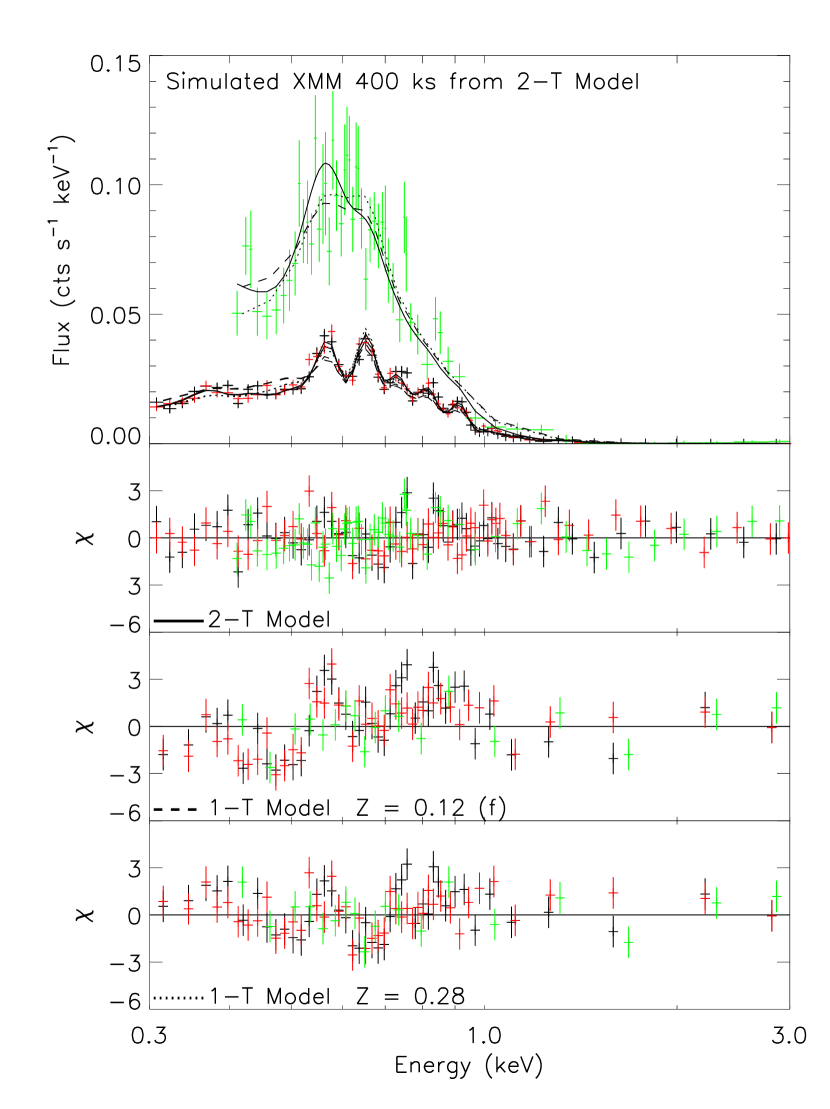
As the 1-T and 2-T models both have well constrained parameters and produce good fits, it is worth asking how much complexity the spectrum can distinguish and how much signal is required to rule out one of these spectroscopically. To examine this question, we used the Xspec tool fakeit to simulate spectra based on the best-fit 2-T model in the outer halo using the pn response, increasing the signal by increasing the exposure time. In these simulations, we did not include the ULX. We created 10 such spectra for each exposure time, then fit them using the 1-T model.
We find that twice the (400 ks) is enough to distinguish between the 1-T and 2-T models to high confidence. The difference between the models can be seen in the residuals (Figure 10), where the 1-T model underpredicts the O VII flux and overpredicts the O VIII flux. Above 1.0 keV, the models have similar residuals, and if the ULX were included it would dominate the spectrum here. Even at lower signal, it may be possible to rule in favor of one model based on external criteria or observable predictions of each model. We examine a few of these in Section 4. We also note, as in Strickland & Stevens (2000), that the halo spectrum may not be simple and could be undermodeled in either case.
The existing data are good enough to rule out non-thermal models (i.e., those that do not produce emission lines). The structure in the spectrum below 1.0 keV cannot be reproduced by realistic absorption of a smooth continuum such as a power law. Continuum models produce poor fits with residuals similar to, but worse than, those seen in Figure 10.
3.5. Background Fits, X-ray Binaries, and Possible O VII Excess
For the fits described above, we have used the background-subtracted spectra. To verify these fits, we also fitted the raw spectra (with model quiescent particle backgrounds subtracted) while explicitly fitting the X-ray background, following the XMM-ESAS guide (and Markevitch et al., 2003, for the Chandra data) and using the RASS data. We also check the background fit to the source regions against background spectra extracted for each detector.
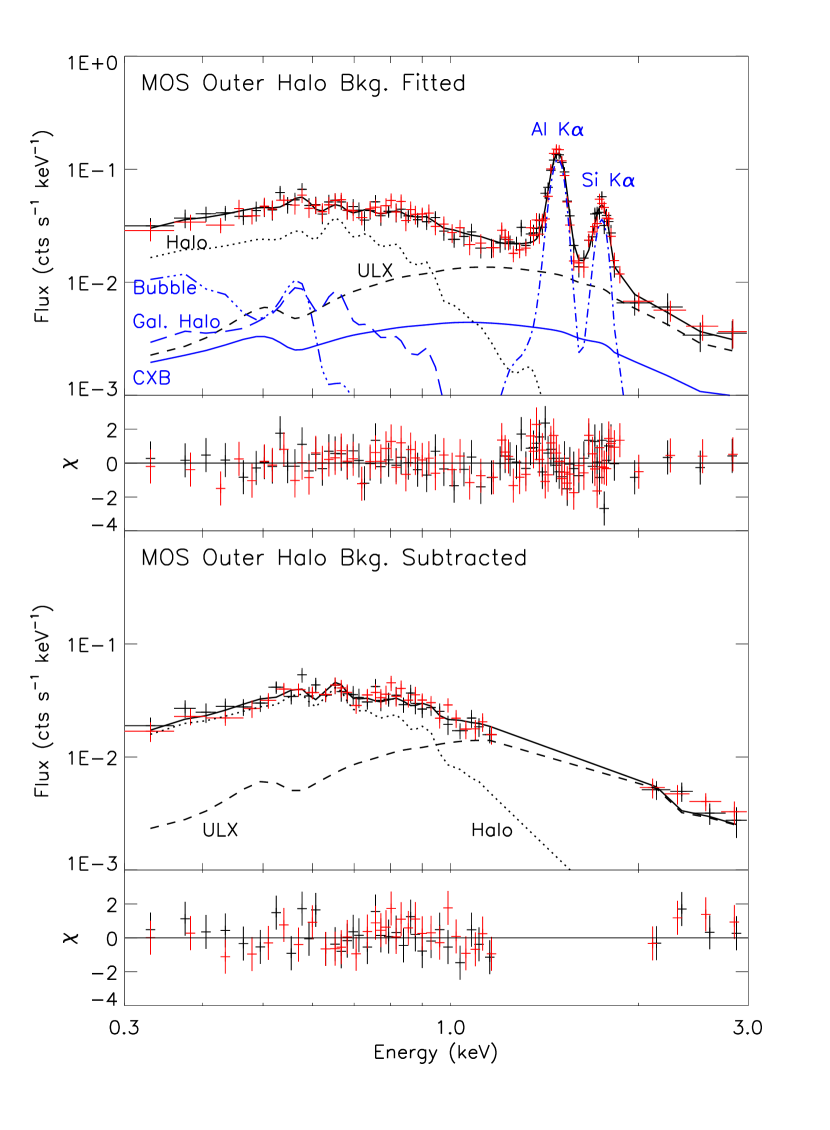
The results in the outer halo for the MOS are shown in Figure 11. In the top panel, the background components (folded through the MOS response) are overplotted in blue while the source components are shown in black. The spectrum is fitted simultaneously with the RASS spectrum with the non-flux parameters tied together to constrain the power in each component. The overall flux in the background is computed from the surface brightness measurements in the RASS and MOS background, so if the RASS model (Local Bubble, Galactic halo, and cosmic X-ray background) is a good description of the background, the source fits should be identical to the background-subtracted case. Figure 11 demonstrates that both cases give excellent fits, and Figure 12 shows that both cases essentially give the same values for and . This is further verified by fitting the MOS and pn background spectra, which are fit well by the RASS model.
The effect of the Local Bubble or Galactic halo on the measured temperatures and metallicities must therefore be small, as must be the contribution of the halo of NGC 891 beyond the ACIS-S3 chip or central MOS chips. This is particularly important considering that the Galactic halo has a temperature ( keV) similar to NGC 891’s halo.
We have thus far not considered the flux contributed by X-ray binaries (XRBs). This flux may be from undetected sources or from the wings of the PSF of detected ones. Ignoring the XRB contribution can artificially reduce the metallicity by forcing the thermal model to boost continuum flux (for a discussion, see Kim & Fabbiano, 2003). The tell-tale sign of a missing XRB component in a thermal spectrum is positive residuals at high energies. The residuals to our background-subtracted halo fits (Figure 6) do not indicate that an additional component is required, except perhaps in the inner halo spectrum of the pn. The MOS and pn outer halo spectra show a similar structure in the residuals above 2 keV, but this appears to be a consequence of the background subtraction (Figure 11). As the XMM-Newton spectra contain a ULX contribution, the Chandra data are a better indication of the influence of XRBs. Here, too, there is no obvious need for a harder component. This is essentially what we would expect in the halo, since the XRB population should predominantly occupy the disk.
From a model perspective, no additional component is required (as with the 2-T spectrum). However, to see if an XRB component materially improved the fit, we extracted an aggregate spectrum from the brightest non-ULX disk sources and fit it with an absorbed power-law model. This yields a photon index of , similar to a power-law fit to the ULX. We then fitted the background-subtracted halo spectra with a thermal model and a power-law component with a common absorbing column and . In the XMM-Newton spectra, the component is degenerate with the ULX, and in the Chandra spectrum the improvement to the fit is small and the change to is within the 90% error bars reported in Table 3). Thus, in contrast to Kim & Fabbiano (2003), our finding of low metallicity in the halo is not likely influenced by the XRB population. Fits with (similar to the CXB) demonstrate that the AGN contribution is also small.
As mentioned above, the residuals in the pn and MOS fits (Figure 6) suggest that the O VII flux near 0.58 keV is underpredicted while the O VIII flux is overpredicted. Indeed, adding a Gaussian component of zero (instrumental) width to the XMM-Newton spectral fits does improve the fit (e.g. in the pn by when removing a single degree of freedom for the flux of the line). As discussed in Protassov et al. (2002), the -test is inappropriate for determining the presence of a line, but when the parameters are well constrained (as they are in our model), the -test can be “calibrated” using simulated spectra. Using the fakeit tool in Xspec, we simulate 100 spectra based on the best-fit (null) model and pn response and exposure time to determine the fraction of data sets in which the O VII line improves the fit by a similar amount. There are several cases in which this occurs, but none have a larger than 8. Finally, the O VII complex is detected in the RGS data.
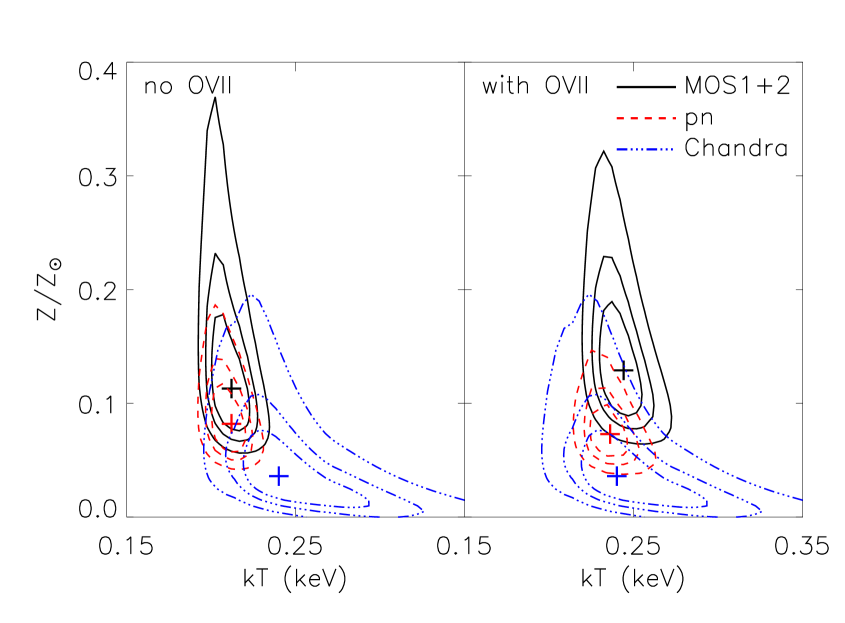
The presence of the “line” is unsurprising if the spectrum does indeed require a 2-T fit. However, it is unclear that the emission is attributable to NGC 891. This is because it does not appear to be necessary in the Chandra spectra (although these have worse spectral resolution) and adding the line as a Gaussian component brings the XMM-Newton 1-T model parameters into better agreement with the Chandra values (Figure 13). In the right-hand plot, the line has been added and the temperatures agree.
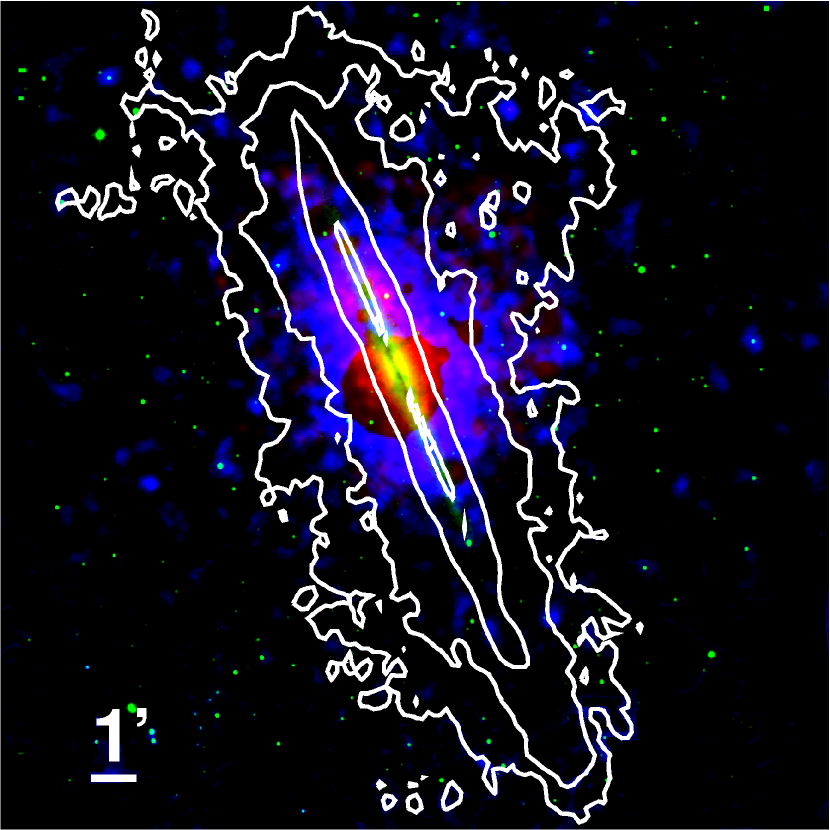
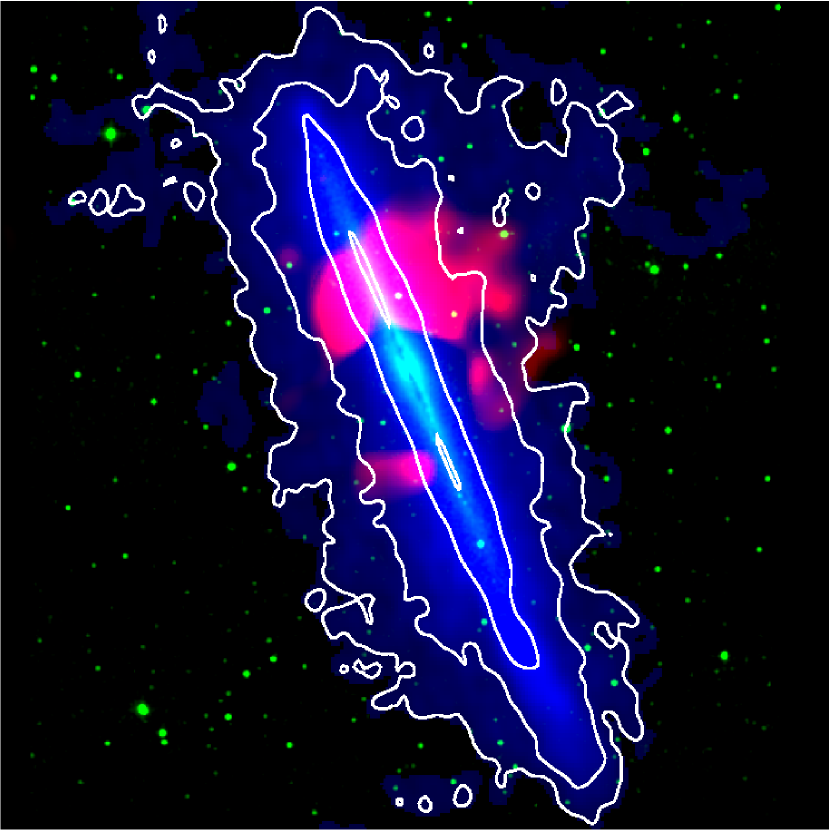
On the other hand, from a XMM-Newton combined image made in the keV band (Figure 14), there is some weak but suggestive evidence that the strong O VII emission is related to the galaxy. The emission basically tracks the inner halo (as one expects, considering the halo continuum is bright in this band), but there is a small extension to the northeast following the outermost H I contour. The hole in the middle is the ULX mask. Although the image shown is adaptively smoothed, this statement is based on adaptive binning. The Chandra data do not show many point sources missed by the XMM-Newton mask in this region, so the excess is likely diffuse or made up of faint point sources.
If the emission is not connected to NGC 891, it is also not likely from the Local Bubble or Galactic halo. Although the Local Bubble should radiate strongly in O VII, to explain the excess it would need a flux similar to that in the 2-T model, or times that predicted by the RASS data. Since the Galactic halo has a temperature similar to the 1-T fit temperature ( keV), it likewise cannot produce a strong O VII line without also producing a strong O VIII line, which is the same reason the 1-T model leaves this excess (Figure 10).
It is probably not produced by solar wind charge exchange because, while we would expect charge exchange to produce a simple line, we expect charge exchange to produce other strong lines (e.g. O VIII), and Carter & Sembay (2008) find that XMM-Newton observations affected by charge exchange have line light curves that are uncorrelated with continuum curves. We find nearly perfect correlation between the O VII line and nearby continuum (a Pearson coefficient of ). There is also no record of instrumental O VII lines in the XMM-ESAS manual or calibration reports.
Overall, it is unclear whether the O VII flux supports or enables the 2-T model because it seems to be peculiar to the XMM-Newton data and brings the 1-T temperatures into agreement with the Chandra data.
3.6. Systematic Error in and
As the metallicity is the crucial discriminant between the accretion and galactic fountain scenarios, it is worth discussing the best fit in a phenomenological sense to gauge the uncertainty in .
In principle, the temperature and metallicity can be uniquely determined from the spectrum of a plasma in collisional ionization equilibrium based on the lines present and continuum flux. Once the temperature has been established from the relative strength of identifying lines, the metallicity can be determined by scaling to the correct flux. At the low spectral resolution of the CCDs, the temperature is determined (below a few keV) by the peak wavelength of the spectrum, since the lines produced at different temperatures are well separated in wavelength. The metallicity is determined in the same way as before, but at low resolution, there are fewer patches of (effectively) pure continuum.
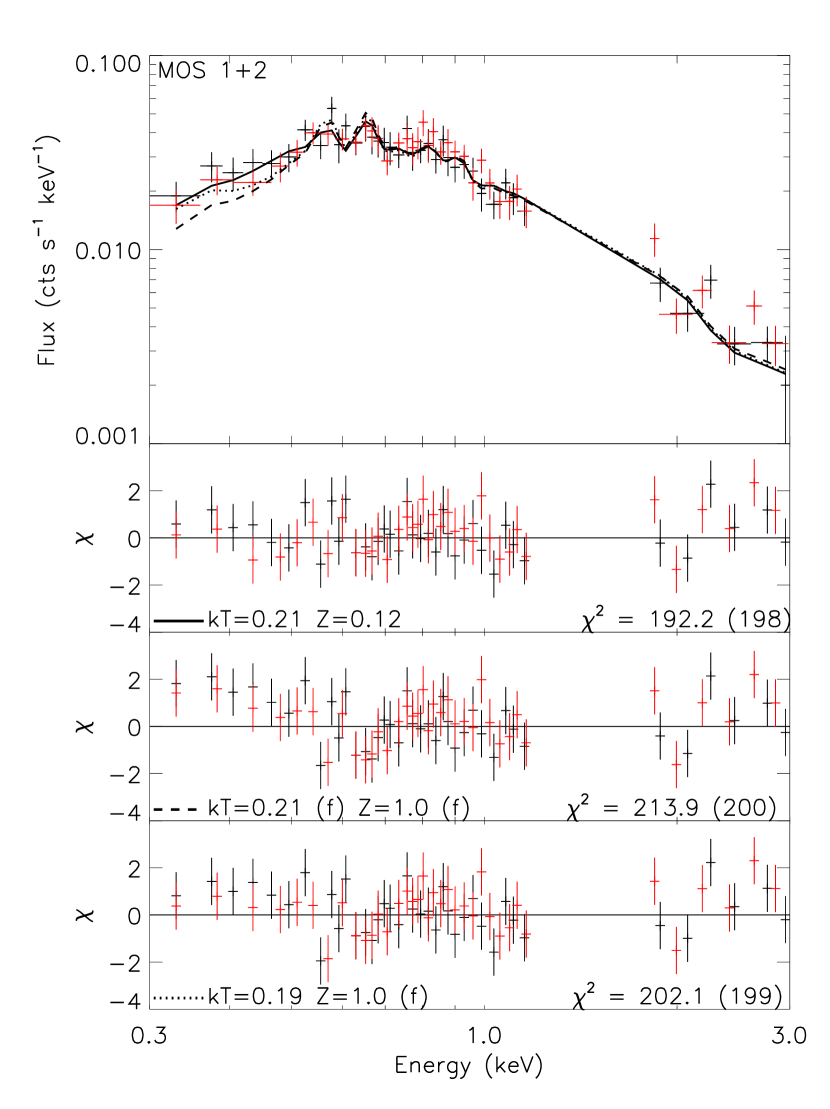
The spectrum of the hot halo of NGC 891 peaks at approximately 0.6 keV (Figure 5). The location of this peak tightly constrains the temperature, with uncertainties in the best-fit values of around 15%. The low metallicity results from the substantial flux and shallow slope below 0.5 keV where there are few strong lines and the flux must be provided by the continuum. Above 0.5 keV there are few regions of pure continuum, so it is primarily this region that drives the fit. Figure 15 demonstrates this in the MOS 1 and 2 spectra. In this plot the solid line is the best fit as reported in Table 3. The dashed line is the best fit obtained when the temperature is frozen at the value in Table 3 and the metallicity is frozen at solar. The primary effect of raising the metallicity is seen in the residuals below 0.5 keV, where the model is a poor fit. If the temperature is allowed to vary while the metallicity remains fixed at solar, we can see from the dotted line in Figure 15 that the fit is improved but still poor below 0.5 keV. This effect would be even stronger without the ULX contribution. Thus, our results depend critically on the flux in this region.
There are several sources of potential bias, which can be divided into problems with the data and problems with the modeling. There are some apparent differences between the XMM-Newton and Chandra spectra (Figure 7), but the differences are small in absolute terms and fall within the 3 statistical error contours. Since the metallicities in all three are small, if the calibration below 0.5 keV is wrong, it is wrong in a similar way for all three spectra. The ULX is unlikely to be a source of bias given the tight constraints on its model parameters and small contribution below 0.5 keV (Figure 11). The agreement in astrophysical background surface brightness and spectra between the RASS and three instruments we use indicates that the soft shoulder is not likely to be due to inappropriate background subtraction, for example a higher-than-expected Local Bubble contribution. While fits to the instrumental backgrounds without constraints from RASS do not constrain the Local Bubble emission well (it drops sharply above 0.3 keV), in a phenomenological sense it does not matter how we fit the background as long as it is appropriately “subtracted” in the explicit fits, and the agreement between the parameters (Figure 12) indicates that it is.
On the modeling side, one might worry about our treatment of the photoelectric absorption, the relative abundance tables we use, the thermal model we use, and the (non-)modeling of the possible O VII excess.
Photoelectric absorption predominantly affects the softer X-rays, thus potentially biasing and . In our fits to the outer halo, we fix at the Galactic value of cm-2. The error in this value is small compared to the effect of ignoring the column in the outer halo of NGC 891, which we do. Fortunately, the magnitude of the shifts, seen best in the Chandra data, is small: about 0.01 keV and 0.01 dex in and respectively for the 1 errors on . There appears to be no bias towards one direction.
The wilm abundance table is an updated version of the Anders & Grevesse (1989) table (see their paper for details). The difference between the tables amounts to (using the Wilms et al., 2000, as a default) a decrease in of less than keV but a decrease in of dex in the MOS spectra. Using the Grevesse & Sauval (1998) table causes a relative increase of keV to while decreasing by dex. There is almost no difference between the Wilms et al. (2000) table and the Lodders (2003) table, which was based on updates to solar photospheric abundances. The primary effect of choosing a different table is to decrease the metallicity.
We use the apec and vapec thermal models with the ATOMDB v.1.3 transition database. Although there are differences between the apec and mekal codes111see http://www.atomdb.org/Issues/mekalspex.php, the effect on the and parameters in our spectra is quite small, less than keV and dex respectively. We note that since the models share some calculations, this cross check does not account for errors in some of the underlying formulas or values. If there is bias here, its direction is unknown.
Finally, the possible O VII excess, modeled as a line, does change the temperature (Figure 13), since it is an important diagnostic line. However, if the excess is real it may indicate an additional thermal component rather than a single line, so this change in temperature should be treated with caution. Nonetheless, the line does not appear to change the overall metallicity much, as its presence or absence does not change the need to model the flux below 0.5 keV. Adding a line component does change the O/Fe value, counterintuitively increasing the value because the temperature of the 1-T model is forced higher, increasing the emission in the Fe L-shell lines. In the fit as reported in Table 3, the low temperature requires a relatively higher Fe abundance to produce these lines.
Overall, the additional uncertainty incurred by our choice of instruments, model, abundance table, and column do not cast doubt on the low metallicity in the 1-T fits to the halo. The dominant source of uncertainty in and appears to be the degeneracy between the two, which is exacerbated by the low spectral resolution of the CCDs.
| Model | keV | ||||
|---|---|---|---|---|---|
| (keV) | ( yr-1) | (erg s-1) | (kpc) | () | |
| 1-T | 0.2 | 0.4 | |||
| 2-T | 0.1 | 3 | |||
| 2-T | 0.25 |
Note. — Derived quantities discussed in Section 4.1.
4. Discussion
4.1. Spectral Models
In the prior section we found that both the inner and outer halo are well characterized by a 1-T thermal model with keV and . Solar metallicity is strongly disfavored, as are absorbed continuum models that do not produce emission lines. However, the spectra also admit a physically motivated 2-T model with solar metallicity where a cool keV component is dominant but a keV component is required. The metallicity of the 0.1 keV component must be close to solar (or the fit reverts to the 1-T model), but the metallicity of the 0.25 keV component is poorly constrained. In our fits in Table 4, we froze it at solar.
We now ask whether the data distinguish between these models based on the cooling rate, scale height, and total mass involved in each model. For the purposes of this discussion, we consider the 0.25 keV component in the 2-T model to be an accreted corona (possibly with subsolar metallicity).
It is worth noting that neither model may be appropriate if the X-ray emission is more complex. If, for example, the X-rays originate in cold material that is shocked by a much hotter medium (as in galactic winds; Strickland & Stevens, 2000), the 1-T and 2-T models are insufficient to describe the true spectrum. From a historical standpoint, there is some reason to believe this might be true: early, low-resolution and low-signal X-ray spectra from galactic halos were fit by single-temperature models with low metallicity, but later fits incorporating foreground and background components relaxed the metallicity constraints and found a 1-T vs. 2-T ambiguity as we find in NGC 891. Strickland et al. (2004) found that the X-ray spectra extracted from a sample of nearby, edge-on, star-forming galaxies could all be fit with the same 2-T model (with different normalizations).
However, the simplest versions of the galactic fountain and IGM accretion scenarios both predict a simple halo. This warrants examining the viability of these simple models in view of quantities derived from the data.
4.1.1 Cooling Rate
Without heating terms, a simple estimate of is the luminosity divided by the specific energy, , where (Nulsen et al., 1984) and the mean particle mass for a primordial composition. When cooling is dominated by line emission, as is the case for keV, the cooling rate does not depend strongly on density (Sutherland & Dopita, 1993). As both the 1-T and 2-T models radiate substantial energy below the 0.3 keV cutoff the Chandra and XMM-Newton CCDs, we use unabsorbed model luminosities between keV, summing values from the inner and outer halo. This is erg s-1 in the 1-T model and erg s-1 in the 0.1 keV component of the 2-T model. For reference, the keV model luminosity of the halo is erg s-1, which is in agreement with Strickland et al. (2004), and the keV luminosity erg s-1 in the 1-T model is in agreement with the ROSAT data reported in Bregman & Pildis (1994).
The keV luminosities yield cooling rates of yr-1 in the 1-T model and yr-1 in the 0.1 keV component of the 2-T model. The 0.25 keV component of the 2-T model contributes yr-1. We have corroborated these values by measuring the density in the inner halo derived from spectra extracted near the disk in thin strips. We obtain the density by fitting the spectrum to yield the model emission measure, which we use to derive the density by assuming a volume. The volume we use is a rectangular prism with two axes given by the extraction box on the sky while the third axis is estimated by assuming that the extent of the halo emission along the line of sight is the same as the extent of the galactic disk, which we compute as a chord across the circle at the mean galactocentric radius of the extraction box. Since the emission measure is proportional to , the error along the third axis enters as the square root of the chord length. In practice, the sky axes we use are 5 kpc by 2 kpc, whereas we derived densities at several radii (with imputed box depths between kpc) and found consistency within the statistical errors. With the density and cooling function (we use the function in Mathews & Bregman, 1978), we can compute and the total mass, thereby producing an average cooling rate. The values are consistent with the luminosity-based cooling rate, with in the 1-T model and in the 0.1 keV component of the 2-T model (the density tends to be overestimated based on uncertainty in the metallicity and , but we fix for the 2-T model).
These values are upper bounds if there are heating terms, in which case becomes . The most plausible source is hot, rising fountain material. Melioli et al. (2009) find that such heating suppresses cooling in the accreted corona entirely. However, the 0.1 keV fountain material is cooler than the 0.25 keV accreted component, besides which it is injected trans- or subsonically (Houck & Bregman, 1990), so we expect it to cool too quickly to heat the wider corona. In the accretion scenario, the gas is heated to the virial temperature at the accretion shock, but in the steady state this cannot, by definition, prevent cooling. Thus, we consider the heating to be a small effect.
Coronal gas will cool through lines such as O VI 1032,1038Å, and the 0.1 keV component of the 2-T model is expected to produce an O VI 1032Å luminosity of about erg s-1. The cooling rate seen in these lines may therefore favor one model.
Unfortunately, there are no O VI detections in NGC 891, but Otte et al. (2003) report an upper limit of erg s-1 assuming that the O VI halo is coextensive with the X-ray halo. Since they account only for foreground extinction, we compute more accurate limits by using the average H I column densities at the positions of their spectra. Assuming the typical Galactic value for reddening, , holds in NGC 891, the maximum total neutral column seen within the Otte et al. (2003) positions is very near the disk and less than farther out. Most of the flux in their positions comes from regions with between cm-2 of intrinsic absorption. We extrapolate the reddening values to the UV using the curves of Cardelli et al. (1989). Using the average intensities and a column averaged over this region, we find a limit on the unabsorbed 1032Å luminosity of erg s-1 if the O VI halo is coextensive with the X-ray halo. Edgar & Chevalier (1986) computed O VI luminosities for gas cooling from above K (0.1 keV) as a function of for isobaric and isochoric cases. The O VI limit then corresponds to a cooling rate of yr-1.
While this is substantially higher than the rate expected in the 1-T model ( yr-1), it is close to that expected in the 2-T model ( yr-1). If the true value is near the upper bound, then the fountain model is implicated, but a more sensitive observation could rule it out. It is also worth pointing out that the 2-T model leaves little room for a separate warm-hot halo component.
4.1.2 Scale Height and Masses
The coronal scale height may also distinguish between the 1-T and 2-T models. Specifically, we can measure the scale height in each component of the models assuming hydrostatic equilibrium (the “observed” scale height) and ask whether the value is consistent with our expectations based on the cooling and equilibrating times. If the observed scale height is inconsistent with these times, the model may be unphysical.
In hydrostatic equilibrium, , where is the scale height. Since is a function of temperature, we expect different scale heights for the 1-T and 2-T cases. If we assume the underlying gravitational potential is the same in both models, then we expect the 0.2 keV 1-T model to have a scale height twice as large as the 0.1 keV component of the 2-T model. However, the 0.25 keV component of the 2-T model is responsible for most of the observed emission in the Chandra and XMM-Newton bandpass and would have a similar scale height to the 0.2 keV 1-T model. The surface brightness profile is not known to sufficient accuracy to distinguish between the models by itself.
In the 1-T interpretation, the density scale height is twice the measured X-ray surface brightness scale height (from this work or Bregman & Pildis, 1994), or kpc. For the same potential, and ignoring potential complicating factors such as magnetic fields and cosmic rays (Kalberla & Kerp, 1998), the 0.1 keV component of the 2-T model would be expected to have kpc while the 0.25 keV component would have kpc. Spectra extracted along and above the disk at various positions indicate that the 1-T model atmosphere is isothermal, so these values should be approximately accurate. However, to verify these values we have measured the emission-weighted density as a function of in a set of five strips (each 0.5 arcmin high) above and below the disk. We then obtain from an exponential fit to .
To maximize the signal, we fit spectra extracted from both sides of the disk and both sides of the bulge simultaneously. As noted above, the surface brightness profile (Figure 4) indicates a different north and south of the bulge, but as the surface brightness is proportional to , small differences in are exaggerated in . We fit the combined spectrum from each with the 1-T and 2-T models to obtain the emission measure in each case, freezing the metallicity in the 1-T model to its overall best-fit value and in the 2-T model to solar. We also freeze the absorbing column density at values estimated from the H I maps in the inner halo and at the Galactic value cm-2 above 1 kpc. For the projected depth of the extraction boxes we adopt 6 kpc (the error incurred here goes as the square root of the depth, and our adopted value is based on the scale length of X-ray emission along assuming azimuthal symmetry).
For the 1-T model, we find kpc, which is consistent with the 7 kpc of Bregman & Pildis (1994) as well as the 4 kpc coronal scale height of the Milky Way (Kalberla & Kerp, 1998). In the 2-T model we derive kpc in the 0.25 keV component and kpc in the 0.1 keV component. The uncertainties are 1 errors based on fitting the emission-weighted densities, but do not include the systematic error from degeneracy in model parameters in the spectral fitting (which is more important for the 2-T model). For reference, we find cm-3 in the 1-T model, cm-3 in the 0.1 keV component of the 2-T model, and cm-3 in the 0.25 keV component. The scale heights correspond to X-ray masses (assuming the halo is cylindrical with a radius the size of the projected optical disk radius kpc) of in the 1-T model (cf. in Bregman & Pildis, 1994) and in the 0.1 keV component of the 2-T model. The 0.25 keV component also has .
The agreement between these values and those derived from assuming an isothermal atmosphere with the same underlying above is encouraging, but we have neglected the cooling and equilibrating times. We now ask whether the “observed” scale heights in each model are consistent with these times.
Hot plasma rising from the disk will reach equilibrium in about a dynamical time. The density and the temperature of the 0.1 keV component place it in the subsonic or transonic regime (Houck & Bregman, 1990), so the the sound-crossing time is a reasonable proxy for the dynamical time (the free-fall time and the halo-filling time are similar). For keV, kpc Myr-1, and for keV, kpc Myr-1.
0.1 keV plasma injected at the sound speed takes about 38 Myr to rise 3 kpc, during which it will cool. The characteristic cooling time of a plasma with a density of the value near the disk is Myr. We can also estimate from the mass of the 0.1 keV component () and a cooling rate of yr-1 from above to find 33 Myr. In either case, this is less than the crossing time. The clouds that form continue to rise to near the expected scale height before falling back. Houck & Bregman (1990) show that under these circumstances a dense layer builds up. It is possible that the surface brightness enhancement around the disk to the north (between kpc off the disk) is this dense layer, but no corresponding layer is visible in the H I maps where the column density falls off monotonically. Also, the north side of the bulge only has about 30% more mass than the south in this region. This corresponds to less than 1% of the total coronal mass.
The measured scale height in the 0.1 keV component of the 2-T model appears to be inconsistent with what we would expect from gas actually rising at this temperature. A substantial amount of 0.1 kev gas is also required above 3 kpc in the 2-T fit, but even if we put the fountain model aside it is unlikely that this gas could have cooled from the hotter medium. This is because the 0.1 keV material will cool below X-ray visibility long before the 0.25 keV gas cools to 0.1 keV. We might also expect to see filamentary structures in the X-ray maps if this were the case (e.g. McCourt et al., 2011), but we do not see any (Section 2).
In contrast, the 0.2 keV plasma of the 1-T corona moves faster and cools more slowly and will equilibrate long before it cools. The 1-T model is also in better agreement with recent galactic fountain models such as Fraternali & Binney (2008) and Marasco et al. (2012) that find an accreted corona is required to dissipate the angular momentum of material ejected from the disk. In these models, 10–20% of the total extraplanar gas mass must be accreted from the IGM. The mass of the H I halo is (Oosterloo et al., 2007), so the X-ray mass in the 1-T model is 15–20% of the total (depending on the scale height and assumed geometry), whereas the 0.25 keV component of the 2-T model comprises 4–8% of the total. The masses are unlikely to be much higher, so the 1-T model is apparently better able to provide an angular momentum sink. We note that the masses of other known components of the extraplanar gas are smaller than the H I halo, with a combined total in the cold molecular, warm neutral, and warm ionized phases of a few (Garcia-Burillo et al., 1992; Howk & Savage, 2000).
| Component | Mass | Depletion Rate | Ref. |
|---|---|---|---|
| () | ( yr-1) | ||
| H2 | few | 1,2 | |
| H I | 3 | ||
| H II | few | 2 | |
| Warm-hot | 4, this work | ||
| Hot | 5, this work |
References. — (1) Garcia-Burillo et al. (1992), (2) Howk & Savage (2000), (3) Oosterloo et al. (2007), (4) Otte et al. (2003), (5) Bregman & Pildis (1994)
Note. — Estimated masses in halo components discussed in Section 4.2. The depletion rate in the cooler components is assumed to be the total mass divided by the free-fall timescale (based on the scale height) and in the hotter components it is the cooling rate. There is no positive evidence for a separate warm-hot component, but we cannot rule it out.
4.1.3 Concluding Remarks
If the hot halo can be described by a simple thermal model with a filling factor of unity, the cooling rates are on the cusp of ruling out the 2-T model, while the measured scale height of each model is more consistent with the 1-T model. These arguments depend primarily on temperature and are less sensitive to the details of the physical model. For example, 0.2 keV plasma in a 1-T fountain model would still equilibrate before cooling. Thus, we conclude that the 1-T low metallicity model is better at explaining the existing data than the 2-T solar metallicity model, but these considerations do not prove an origin. The low metallicity in the 1-T model does not appear to be due to incorrect subtraction of the X-ray background or other systematic effects, but it is possible that the spectrum is undermodeled (cf. Strickland et al., 2000). The 400 ks simulated XMM-Newton spectrum in Figure 10 would rule out a 1-T model based on Fe-L lines. If the 2-T model were still disfavored, such results would point toward a more complex hot halo. It is also possible that the 2-T model represents a fountainaccretion scenario in which the hotter component (whose metallicity is poorly constrained, but somewhat above the 0.1 of the 1-T model) represents accreted gas that has equilibrated at a different scale height than the cooler fountain gas. The simulated XMM-Newton spectrum in Figure 10 would strongly constrain the metallicity in the 2-T model if the 1-T model has already been ruled out. In this case, the accretion component would dominate farther from the galaxy.
4.2. Origin of the Extraplanar Gas
We now turn to the origin of the halo gas. In the classic galactic fountain scenario, superbubbles break out of the disk, venting hot gas to the halo which cools and falls back as H I clouds. In this section, we will first demonstrate that this model cannot explain the extraplanar gas in NGC 891 if it is in the steady state. We will then consider alternatives, including cold accretion and prior outflows, before placing NGC 891 in the context of other massive late-type galaxies. We conclude by offering a speculative picture that NGC 891 and several other galaxies represent a period of enhanced star formation in the disk following a nuclear starburst that has since wound down.
4.2.1 Galactic Fountains and the Steady State
Considering the relevant timescales and disparate masses in the components of the extraplanar gas (Table 4.1.2), it is evident that the atomic component could not have cooled from the hot corona in the steady state. This is because the cold ( K) gas free falls back onto the disk (in Myr) at a rate of yr-1, whereas the total cooling rate from the X-ray and UV emitting gas is yr-1. This rate could be as low as yr-1 in the 1-T accretion model if the only source of O VI luminosity is cooling coronal gas. In this case, the instantaneous gas consumption rate by star formation (Popescu et al., 2004) is more than 4 times higher than the accretion rate.
The halo components could exist in a steady state if the H I is not supplied by the hot gas, but rather rises into the halo via a (primarily cold) galactic fountain (e.g. Fraternali & Binney, 2006, and variants). The viability of a cold fountain depends on its ability to expel enough gas and to keep it cold. In our view, if the fountain is powered by superbubble breakouts (the most natural way to launch material more than 1 kpc above the disk), it fails to meet both criteria as we argue below. This rules out a halo formed by the steady-state action of a galactic fountain, hot or cold.
First, it is worth laying out our superbubble breakout paradigm. Superbubbles form around OB associations as stellar winds and SNe evacuate a region in the surrounding ISM. Once a bubble has formed, its structure is thought to be similar to the picture given in Weaver et al. (1977), Smith & Cox (2001), and Mac Low & McCray (1988). Near the core, the hypersonic wind or supernova blast wave freely expands. Farther out, the flow encounters a stagnation shock and heats to X-ray emitting temperatures ( K). This hot medium fills most of the bubble. SNe that explode after the bubble has formed do not form remnants like isolated SNe, but instead convert their kinetic energy into thermal energy by heating the already hot interior via weak shocks. Radiative losses from the very hot material are small. The bubble is bounded by a shell of swept-up mass, which is thin early on but thickens in developed bubbles. The hot gas within evaporates mass from the inner layer of this shell via thermal conduction, and in a developed bubble the hot mass is dominated by evaporated gas. The shell itself is not significantly depleted by this process.
Once a bubble’s diameter exceeds about three times the scale height of the disk (Mac Low et al., 1989), it will break out into the halo. The breakout is characterized by accelerated upward shell expansion, which leads to Rayleigh-Taylor instabilities that disrupt the shell and allow the hot gas to vent. However, less than 10% of the shell mass erupts into the halo (Mac Low et al., 1989), and this rises into the halo as fragmented clouds. The hot gas evacuates as a pressure-driven outflow. This scenario finds some support in NGC 891: in a study of the emission from dust and diffuse H above the disk, Rossa et al. (2004) do not find large, organized “chimneys”. Rather, the evidence indicates that the bubbles vent through a disorganized medium.
To determine whether the outflow is predominantly hot or cold requires estimating the masses and energies involved. We do not have direct observations in NGC 891 (although dust filaments indicating bubbles and a somewhat porous disk are present), but we can estimate the cold mass from the Boomsma et al. (2008) study of H I holes in NGC 6946, a nearby face-on spiral with a similar mass and SFR as NGC 891. We also consult values derived from other face-on spirals that are not as apparently analogous to NGC 891. The hot mass is uncertain, but we can constrain it by considerations from nearby superbubbles that have been studied in the X-rays. The fiducial values we derive are given in Table 7.
We assume that the cold mass ejected into the halo is 10% of the mass of the swept-up shell at the time of breakout (Mac Low et al., 1989), although it may be less. As will be clear later, it is difficult from an energetics perspective to expect much more. The breakout size of the hole depends on the scale height of the disk, which in NGC 891 is about 200–400 pc (Xilouris et al., 1998). We adopt 300 pc as a fiducial value, meaning a bubble at breakout has a radius of about 450 pc, but we note that the scale height varies with distance from the galactic center. Boomsma et al. (2008) estimated shell masses in deep observations of H I holes in NGC 6946 by measuring the ambient column density around each hole and the area of the hole. Because they measured in regions including the swept-up shell itself, the resulting mass is an upper bound. They find an exponential distribution of hole size with radius and an average missing mass per hole of . This is consistent with the swept-up shell mass in the Mac Low et al. (1989) simulations of at breakout, and the Boomsma et al. (2008) value is biased towards higher mass by the regions used to measure , the angular resolution (their synthesized beamsize is 390 pc, which is close to the breakout size), and hole identification algorithms (since , larger holes have much more mass). For example, Boomsma et al. (2008) identify 121 holes in NGC 6946 while Bagetakos et al. (2011) find 56 in the same galaxy.
We can also compare these results to the face-on galaxies M101 (Kamphuis, 1993), M31 (Brinks & Bajaja, 1986), and NGC 2403 (Thilker et al., 1998) where similar measurements have been made at high resolution and sensitivity. M101 has a similar mass and SFR to NGC 891 ( yr-1 in Kuntz & Snowden, 2010), whereas M31 has a similar mass but much lower SFR, and NGC 2403 is about ten times less massive but has a relatively high SFR for its mass ( yr-1 in Heald et al., 2011, see erratum) and a lagging H I halo, suggesting it is a lower mass analog to NGC 891. The results suggest that the amount of mass swept up for a shell of a given size and age is roughly the same across the galaxies. Kamphuis (1993) find relatively large holes in M101 comparable to or larger than the supershells seen in NGC 6946, with similar masses and dynamical ages. On the other hand, Brinks & Bajaja (1986) generally find smaller, younger holes in M31 than NGC 6946, with a typical missing mass of only per hole for holes with radii of about 100 pc and kinematic ages of 2–30 Myr. In NGC 2403, Thilker et al. (1998) identify both kinematically young (expanding) shells and older stalled shells with a missing mass range of per hole and ages between 1–200 Myr. The range of bubble sizes, ages, and masses generally supports the Mac Low et al. (1989) picture and indicates that bubbles large enough to break out of the disk in NGC 891 would have masses between . Based on the distribution of the hole sizes and masses in the four face-on galaxies we consider, we adopt a fiducial missing mass of a pc hole in NGC 891 to be . The cold mass expelled upwards at breakout would then be per hole (Mac Low et al., 1989). Mac Low et al. (1989) find that the ejected shell material has upward velocities between 50–100 km s-1, so the kinetic energy required is erg erg. This is comparable to the total kinetic energy in the rest of the shell, but small compared to the thermal energy stored in the hot gas that drives the outflow (see below).
The hot mass in bubbles is quite uncertain, but we estimate the mass by assuming a spherical bubble just prior to breakout whose size is 3 times the scale height of the disk in NGC 891. A bubble filled with hot gas has a mass , where is the filling factor. Although we expect the bubble to be filled with hot material (the sound speed of the hot gas is much faster than the bubble expansion rate), much of the (soft) X-ray emission comes from the inner edge of the shell where supernova blast waves impact it (Chu et al., 1995; Jaskot et al., 2011). The rest of the bubble is presumably filled with even hotter, more tenuous gas. Thus, the emission measure of the hot component that dominates the mass is . Electron densities measured in X-ray observations of nearby superbubbles range from cm-3 for bubbles between pc across (e.g. Cash et al., 1980; Points et al., 2000; Dunne et al., 2001; Smith & Wang, 2004). For the breakout bubble radius of 450 pc, the mass is , where is the disk scale height in kpc and is in units of cm-3. For fiducial values of kpc and cm-3, we find .
| Quantity | Value |
|---|---|
| SNe before breakout | 100 |
| Energy budget | erg |
| Shell mass | |
| Disk scale height | 300 pc |
| Radius at breakout | 450 pc |
| Breakout cold mass | |
| Breakout hot mass | |
| 0.01 cm-3 | |
| K |
Note. — Fiducial values used in Section 4.2. We consider these reasonable estimates of the true values, which are hard to determine. See text for details.
There is considerable uncertainty regarding the filling factor of the X-ray emitting material in nearby superbubbles, and we do not have direct information from NGC 891. However, we suggest that a reasonable lower bound for the mass of hot material in a bubble at breakout is , which we justify presently. Over 100 SNe are thought to be required for a bubble to break out of the disk of a galaxy like the Milky Way (e.g. Mac Low et al., 1989; Melioli et al., 2008), and by extension NGC 891. This will release about erg (stellar winds will also contribute to the kinetic luminosity). Of this, a few erg is contained in the average shell described in Boomsma et al. (2008). The majority of the energy is either radiated or goes into heating gas evaporated from the inner wall of the shell to X-ray emitting temperatures (Weaver et al., 1977). Nearby superbubbles have interior temperatures ranging from K (e.g. Cash et al., 1980; Dunne et al., 2001; Smith & Wang, 2004), so as a fiducial temperature we take K. The specific energy of material at this temperature is erg g-1, or erg . If about 30% of the superbubble energy budget goes into heating evaporated gas, about of gas could be heated to the fiducial temperature. The actual value may be higher depending on radiative losses.
Extrapolations from observed superbubbles also support of hot gas as a lower limit in large bubbles. If the hot masses inferred in smaller bubbles (e.g. Dunne et al., 2001) are scaled up to bubbles of pc, the masses are , and Yukita et al. (2010) find in spectral fits to H II regions in NGC 2403 that the ratio of hot gas to swept-up mass is 6–10% (for our fiducial shell mass of , this is of hot material, assuming this ratio holds throughout the lifetime of a massive bubble).
These considerations suggest a hot mass somewhere between , so for the sake of argument we take as a fiducial value the hot mass in a pc bubble to be . This would give a filling factor in the bubble described above, but we emphasize that the hot mass and filling factor of the soft X-ray emission is poorly known in many bubbles.
Thus, at breakout our fiducial bubble (Table 7) launches of cold shell material towards the halo and contains of hot ( K) material whose thermal energy ( erg) is similar to or greater than the kinetic energy in the entire shell. The erupting shell material is therefore driven rapidly upwards even though it dominates the mass. Since the hot gas flows faster than the ejected shell fragments, it can evaporate the neutral material just as in the confined bubble. At our fiducial temperature of K, the sound speed is km s-1, whereas the shell ejecta travel at km s-1 in the simulations of Mac Low et al. (1989). Thus, the cool parcels can be considered as islands in a stream. The thermal energy of the hot gas is sufficient to raise about of cold material to K, so it is energetically feasible for the hot gas to become the dominant component (there is more than enough energy to merely evaporate the cold material by heating it to, say, K).
Whether the hot component becomes dominant is unclear, since evaporation occurs via thermal conduction in a boundary layer around the fragments and most of the hot material would not participate. On the other hand, the fragments are rising into the hot bath of the extant halo. A significant unknown is the effect of magnetic fields, which could suppress conduction relative to the Spitzer (1962) value if the fragments are wrapped in field lines, which are seen to be expelled along with the gas (Heald, 2012) in at least one superbubble in NGC 6946. However, turbulence could mitigate this effect (cf. galaxy clusters in Narayan & Medvedev, 2001). In the bubble described by Heald (2012), both the large-scale fields around the bubble and turbulent fields entrained in the hot plasma are uplifted. The speed of the hot gas flow is also important, since gas that is too fast shocks the cooler entrained gas instead of evaporating it (Strickland et al., 2000). Pure hydrodynamic models suggest that virtually all of the gas rises hot (Melioli et al., 2008), but the detection of polycyclic aromatic hydrocarbons (PAHs) to a scale height of 500 pc in NGC 891 (Rand et al., 2011) may indicate that a substantial amount of material rises cold. The difference between PAH features in the disk and halo suggests that the cool fountain gas does experience shocks as it rises, but that these do not heat the gas to X-ray emitting temperatures (it is also possible the grain destruction time exceeds the flow time).
The proportion of cold fragments to hot gas will decline with distance above the disk since some of the cold material that is not evaporated will fall back below 1 kpc (above which it would unambiguously be considered halo material). Mac Low et al. (1989) find that the fragments have upward velocities between km s-1, and on the lower end these fragments will reach an apex below 1 kpc.
Considering these factors, we suppose that less than half of the fountain material that makes it into the halo is cold. This amounts to a few of cold material injected into the halo per hole and a comparable mass of hot gas. Thus, a galactic fountain powered by supernova feedback seems unlikely to be truly “cold”.
More importantly, it is evident from these values that the proportion of cold and hot material in the fountain is a moot point in NGC 891 because the fountain envisioned above does not expel enough mass to sustain the halo regardless of the temperature. This can also be seen in NGC 6946, whose H I holes we used to derive our values. For our fiducial values, the total amount of gas that rises into the halo in NGC 6946 is no more than 15% of the total extraplanar H I (Boomsma et al., 2008) and coronal gas (Schlegel et al., 2003). Even with optimistic assumptions about the true hole size and amount of kinetic energy involved, it is difficult to envision increasing the outflow mass by an order of magnitude without ejecting the entire swept-up shell mass of each contributing hole, which is impossible for isolated holes. The situation is even worse in NGC 891, which has a similar SFR to NGC 6946 (and therefore presumably about the same number of holes) but four times more extraplanar H I.
This problem is circumvented if the extraplanar gas spends more time in the halo than the lifetime of the progenitor bubble. The lifetime of the H I holes is limited by the slowing expansion velocity (once it drops below the characteristic velocity in the surrounding gas, the bubble breaks up) and interactions with neighboring bubbles (converging flows from two expanding shells can promote star formation which will disrupt that part of the shell), and is perhaps 80 Myr (Boomsma et al., 2008). Hot gas may reside in the halo longer than this, but we have already established that the H I halo cannot have cooled from the X-ray emitting gas if it is in the steady state. The time spent in the halo by the cold gas is about twice the free-fall time, or Myr for the ejection speeds in Mac Low et al. (1989). Since the expulsion of cold mass from the bubble is a one-time event occurring at breakout, we expect the cold material launched into the halo to return to the disk within a bubble lifetime (although it will not refill the hole since the galaxy rotates and the fountain material has angular momentum; Melioli et al., 2008). Additional hot material may leak out of the hole following the breakout, but for an isolated hole this will be subsequent stellar wind and SNe material. The masses of these components is quite small; even if we assume that the hot gas does not escape the blown-out bubble before evaporating additional material from the shell, the evaporated component described above was a small fraction of the total swept-up shell mass.
Thus, neither a classic nor a cold fountain seem capable of producing the extraplanar H I in NGC 891 in the steady state at the current SFR. Although our argument for NGC 891 is largely circumstantial, we note that NGC 6946 has a similar mass, SFR, and is disk-dominated like NGC 891 with a comparable disk scale height. Since stellar feedback must be tied closely to the SFR, there is no reason to expect a much higher hole rate in NGC 891.
It is not clear if this imbalance occurs more generally. There are not many non-starburst galaxies with the X-ray, UV, H, H I, and radio continuum data required to establish an H I mass and cooling rate (starbursts are not expected to be in equilibrium). This is largely due to the paucity of X-ray and O VI measurements around non-starburst massive spirals (see Tyler et al., 2004). However, among galaxies with relatively complete coverage, there are others that appear to fall into this category. As we have established, the H I halo of NGC 6946 cannot have been ejected by the observed holes unless the expelled mass rate is an order of magnitude larger, but it also cannot have cooled from the hot corona (which has a bolometric erg s-1; Schlegel et al., 2003). M101 likewise has a similar mass and SFR with a bolometric halo X-ray luminosity of erg s-1 (Kuntz & Snowden, 2010) with H I holes detected throughout the disk (Kamphuis, 1993). The halo X-ray cooling rates implied are yr-1. NGC 2403 has the same issue: the X-ray emitting mass conceivably in the halo is only 10% of the extraplanar H I (Yukita et al., 2010).
Unfortunately, the picture is not clear in normal edge-on spirals. NGC 891 has the highest X-ray surface brightness of a non-starburst edge-on galaxy (Bregman & Houck, 1997), so much of the X-ray work on edge-on spirals has focused on starbursts. A few exceptions include NGC 4631 (Wang et al., 1995; Strickland et al., 2004) and NGC 4565 (Vogler et al., 1995), but both are interacting with companions, and Strickland et al. (2004) argue that NGC 4631 is experiencing a weak starburst. NGC 4565 has a similar mass to NGC 891, but a much smaller SFR ( yr-1 in Heald et al., 2011, see erratum) and evidence only for a weak H I halo (Zschaechner et al., 2011). NGC 4631 has a large halo, but Rand (1994) argue based on kinematics that most of the H I far from the disk is due in part to the not perfectly edge-on inclination (85∘), tidal interaction, and a large scale height in the outer part of the galaxy. Strickland et al. (2004) included two non-starburst edge-on galaxies in their Chandra sample aside from NGC 891 (NGC 6503 and NGC 4244), but both are substantially less massive than NGC 891 and significant X-ray emission was detected in neither. Finally, Li et al. (2007) detected diffuse X-ray emission in M104 with a bolometric X-ray luminosity of a few erg s-1, but M104 is also at least several times more massive than NGC 891 and Li et al. (2007) argue that the halo is X-ray under-luminous while Bajaja et al. (1984) find a relatively small amount of H I in the galaxy.
If the halo is not in the steady state, there are two basic possibilities for the origin of the extraplanar gas: cold accretion and prior outflows.
4.2.2 Cold Accretion
Cold accretion (including the recycling of gas ripped out of a disk by galactic interaction) can occur via the infall of intergalactic H I clouds or through tidal stripping and cannibalization of small satellite galaxies. The former is disfavored by the paucity of intergalactic H I (see discussion in Sancisi et al., 2008) and the small amount of counter-rotating extraplanar H I in NGC 891 (Oosterloo et al., 2007). Recent simulations also indicate that accretion of fresh material primarily occurs in the hot phase (Oppenheimer et al., 2010; Joung et al., 2012). While it is possible that a large reservoir of photoionized hydrogen resides outside the visible H I halo, this would require an extremely extended halo. The Oosterloo et al. (2007) contour map extends down to cm-2 and monotonically declines from the center. The scale height suggests that the column drops below cm-2 within several kpc of the last contour. At this point, we would expect the H I to be photoionized. Although the column density likely continues to drop beyond this, if we assume that the space around NGC 891 is filled with a uniform column of cm-2 ( kpc-2), it would take about kpc2 to make up of ionized hydrogen. If we further assume that the photoionized halo is circular in projection and centered on NGC 891, the radius required is about 200 kpc. Replenishing the visible H I halo from such a reservoir cannot explain the observed mass, and it is not clear that such a halo would rotate with the galaxy to such distances.
A more plausible scenario is that the halo is made up of tidally stripped gas from a satellite galaxy and gas ripped out of the disk of NGC 891 by the same interaction. However, there is no direct evidence of an interaction such as tidal streams, stellar shells, or a warped disk that would be particularly visible in an edge-on galaxy. The absence of these features and the kinematics of the extraplanar H I indicate that the time elapsed since the posited interaction is a few times the galactic rotation timescale of a few yr. In this case, however, we would expect gas within a few tens of kpc to have fallen back onto the disk. There are a few candidates for recent interactions. First, the companion galaxy UGC 1807 is a small but gas-rich galaxy with about 10% of the mass of NGC 891 and is sufficiently far away to account for the lack of tidal features (Oosterloo et al., 2007). However, Oosterloo et al. (2007) find that the amount of accretion that can be explained by this interaction is only yr-1.
Two other signatures of recent or ongoing accretion are described in Mouhcine et al. (2010), namely an extended (10 kpc above the disk), flat (disk-like) envelope of halo stars and a giant rosette pattern of tidal streams extending out to 30 kpc from NGC 891. We do not believe the former can account for much recent cold accretion because such extended “disks” form on long timescales of a few Gyr or more when dwarf galaxies are cannibalized (Peñarrubia et al., 2006). Moreover, Mouhcine et al. (2010) also find a similar extended halo around NGC 2683, a highly inclined () galaxy with a similar total mass to NGC 891 but no substantial H I halo (Kennedy, 2009). Such envelopes may be common, but evidently need not correlate with recent cold accretion. Regarding the rosette tails, Mouhcine et al. (2010) argue that they likely originate from a single accretion event based on the similar morphology to disrupted dwarf galaxies in -body simulations. If the galaxy were gas-rich, it could provide a substantial cold accretion rate over a relatively long period of time, but Mouhcine et al. (2010) argue based on stellar ages (no stars younger than a few Gyr were seen in the streams) that the companion had little H I compared to UGC 1807. Although the instantaneous cold accretion rate could be quite high upon absorption of a particular stream, we would expect an average accretion rate from a gas-poor dwarf with a pre-merger gas mass to be no more than yr-1, considering that the lifetime of the stellar streams is between Gyr (e.g. Binney & Tremaine, 2008). This is similar to the imputed contribution from UGC 1807 of yr-1 (Oosterloo et al., 2007).
4.2.3 Prior Outflow
The remaining possibility we consider is a prior hot outflow that cooled to form the H I halo. There are two basic models, including a vigorous fountain (powered by higher star formation distributed throughout the disk) or a nuclear wind. Plausible cooling mechanisms that would produce the observed halo can be found for either case, but as winds are ubiquitous in starburst galaxies (Veilleux et al., 2005), it may be that a powerful fountain is always accompanied by a nuclear wind.
Typical outflow rates in winds appear to be times the instantaneous SFR (e.g. Bouché et al., 2012), although it is unclear how much mass they carry because the mass carried in each component is hard to measure (see Strickland & Heckman, 2009). If material flowed out of the disk at yr-1, this would imply a SFR of yr-1 during the active phase, which is plausible for massive starbursts.
As the putative outflow must have occurred long enough ago for the H I to have cooled from the hot phase, a variety of parameters are possible. The minimum age of the outflow can be constrained by the cooling time of the gas and (in the case of the wind) the fallback time from large distances. In either case, ages of 50 Myr or more are expected. The absence of wind signatures (cf. edge-on starburst galaxies in Strickland et al., 2004) and the duration of starburst episodes place lower limits consistent with this value. Thus, it is neither possible to rule this out nor to make verifiable predictions, so what follows is speculation.
NGC 891 belongs to a class of massive, disk-dominated, late-type galaxies with relatively high disk-distributed SFR that are not classified as starbursts. Nearby examples include NGC 6946, NGC 2403, M101, NGC 4631 (although it is classified as a starburst by Strickland et al., 2004), and NGC 5775 (classified as a starburst in Li et al., 2008). Of these, NGC 4631 and NGC 5775 show some evidence for a wind-like nuclear outflow in the X-rays, with the case being stronger in NGC 4631. As one might expect, such galaxies tend to have more prominent halos than other massive spirals with lower SFR (e.g. Rand, 1996; Dahlem, 1997), with an active fountain implicated as a result. The existence of H I halos that appear too massive to have cooled in the steady state in NGC 891, NGC 6946, M101, and NGC 2403 (more precisely, the X-ray cooling rate and expected cold outflow appears unable to replace gas lost via free-fall) suggests that NGC 891 may simply be an extreme case of a more frequent phenomenon, and that prior outflows may also be necessary in these galaxies. The case of NGC 2403 is especially interesting in this vein because a Chandra observation shows X-ray emission that is more centrally concentrated than the star-forming regions (Yukita et al., 2010). Since NGC 2403 has a relatively high SFR ( yr-1) for its mass () and the X-ray emission (if produced by star formation) represents a significant amount of mass, NGC 2403 may have had a nuclear starburst that has propagated outwards or shut off while the disk star formation continued (Yukita et al., 2010). Another hint of a prior outflow is found in M104, which has a curiously low SFR for its mass, where Li et al. (2007) argue that a nuclear wind (in their model powered by Type 1a SNe) has removed much of the material in the inner region of the galaxy, an argument supported by the absence of H I in the same region (Bajaja et al., 1984).
We therefore speculate that the high SFR is the remainder of a starburst phase that ejected a substantial amount of material or else fresh star formation fueled by the return of this material to the disk. This scenario is attractive because it explains the evidence that points towards a vigorous ongoing disk–halo interaction (summarized in Section 1 for NGC 891), the apparent disconnect between the H I and X-ray halos (and perhaps the low metallicity of the latter, if it is accreted), and why starbursts generally do not have extended hydrostatic X-ray halos or prominent extraplanar H I (although the latter may be due to photoionization of extant hydrogen). This appears to be true in NGC 253, NGC 3628, NGC 3079, and the less massive NGC 4945, NGC 1482, and M82, where outflow morphology is seen in the X-rays (Strickland et al., 2004) and other bands, but only modest signs of extraplanar H I (Dahlem, 1997). The outflow rates required to explain the H I halos are easily met in starbursts. On the other hand, if the H I halos develop as hot gas cools, we would expect to see X-ray luminous post-starburst galaxies. This seems likely even if much of the H I halo is formed by recombination of extant photoionized gas in the wake of the starburst (cf. the starburst galaxy NGC 253 where the H I disk is smaller than the optical disk; Boomsma et al., 2005). Although the sample of nearby massive spirals with X-ray observations is small, NGC 891 is the most X-ray luminous of the nearby non-starburst spiral galaxies.
In principle, this picture is consistent with either the 1-T or 2-T coronal models depending on the type of outflow. It is possible that the observed corona is dominated by accreted material that has fallen in during and since the formation of the H I halo. Such a situation could arise in an outflow scenario if a distributed starburst (i.e., non-nuclear) “fountain” expelled a large amount of material () in a relatively short period of time (a few tens of Myr). If the material was expelled via superbubble breakouts at a constant rate and entered the halo at several million degrees, the initial material would equilibrate before the end of the starburst and begin to cool. Although its cooling time would be quite high at first, the scale height of the corona would be determined by the temperature, so additional fountain action would increase the coronal density (and luminosity), thereby decreasing the cooling time. As more material accumulated in the halo, the cooling time would eventually shrink until the cooling rate was comparable to the fallback time of cold material, and the coronal gas would rapidly cool to form a large H I halo. If there were steady accretion from the IGM throughout this period, the hotter material further out would survive the rapid cooling phase, leaving the halo possibly dominated by accreted gas. Whether this would actually happen depends on the fountain ejection rate, the temperature, and the details of the cooling. For example, H I clouds may primarily form via the thermal instability, and the putative “cooling flow” would form the most cold gas nearest the disk, so the H I halo might not extend more than a few kpc from the disk. More importantly, it is not clear that such powerful distributed “starbursts” occur. On the other hand, it is easier to explain such an outflow in the 2-T model of the halo (if the 0.25 keV component has near solar metallicity and the 0.1 keV component represents the present-day fountain).
Overall, the hypothesis of a previous outflow is severely hampered by the dearth of meaningful constraints, but the present-day fountain and cold accretion do not seem sufficient to explain the massive H I halo in a steady state.
4.2.4 Concluding Remarks
We have argued that the massive H I halo in NGC 891 (and, we speculate, in a handful of other nearby galaxies with sufficient data) cannot be supported by the instantaneous SFR or cooling from the X-ray halo. However, a rigorous examination of the fountain models and halo masses must be made in order to confirm this picture. For example, it is possible that the interaction between multiple breakouts within a small patch of the disk (Melioli et al., 2009) might conspire to eject much more mass, or that new bubbles forming below the falling back fragments of old ones can lift much more cold material than the breakout of a bubble from a pristine disk. Our arguments are based on the latter scenario as it appears in maps of H I holes that the overlap fraction is small, but this may be a bias of the hole detection algorithm. An additional and important unknown is the amount of warm-hot material in the halos of various galaxies, although we would expect a separate warm-hot component to equilibrate with a small scale height. In NGC 891, at least, such a component could not explain the substantial extraplanar H I a few kpc away from the disk. Finally, we emphasize that any galaxy with a low luminosity ( erg s-1) X-ray halo (including many nearby massive spirals) must have a low cooling rate of yr-1, with yr-1 for a temperature like that of the Galactic halo.
Even if the fountain model can be reconciled with NGC 6946 (Boomsma et al., 2008), NGC 891 has a H I halo four times more massive with a similar instantaneous SFR. The mass loading would then need to be a factor of in order to balance the fallback rate of the extraplanar H I. If the H I within 1 kpc of the disk (but outside a few scale heights) is also participating in the fountain, the mass loading factor must exceed about 10 (this may be material that was not ejected with sufficient velocity to exceed 1 kpc). It is difficult to envision any fountain scenario in which this could be the case.
Since cold accretion does not appear to be a viable source of H I, we speculate that a prior outflow is the best explanation. Unfortunately, there are few constraints on the characteristics of such an outflow, so it is an unsatisfactory, if plausible, explanation at present. However, if the present activity in the disk is insufficient to produce the neutral halo, it is the best candidate. Finally, if it is conclusively demonstrated that the X-ray emitting gas is indeed low metallicity, a prior outflow scheme would decouple it from the observed H I halo (that presumably has the same metallicity of the disk).
5. Summary & Conclusions
We have used deep X-ray exposures of the nearby, edge-on spiral galaxy NGC 891 to determine the properties of its hot halo. Our main findings are summarized here:
-
•
The hot halo is fit well by a thermal model with subsolar metallicity () to high confidence. Fits to the halo emission near the disk and farther out find nearly identical parameters, indicating a homogenous halo.
-
•
The simplest explanation for a low-metallicity X-ray halo is hot accretion from the IGM.
-
•
The best-fit values agree between the MOS, pn, and Chandra ACIS-S detectors. An examination of the X-ray background in the region indicates that it is properly subtracted from the spectra, and known systematic effects from model choices and fitting method do not substantially change our results.
-
•
A 2-T model with solar metallicity is also a good fit to the halo spectrum when the emission measure is dominated by an absorbed, cool, keV component. Most of the emission, however, comes from a weaker keV component. The metallicity in this model supports a disk origin for the coronal material.
-
•
When considering the X-ray cooling rate and O VI limits on the cooling mass as well as the density scale heights in the 1-T and 2-T models, the 1-T model is favored.
-
•
The aforementioned cooling rates are not high enough to offset the losses of the massive H I halo due to fallback of cold material onto the disk. This suggests that the extraplanar gas cannot be in equilibrium.
-
•
An examination of single superbubble breakouts indicates that a galactic fountain cannot lift enough material into the halo to account for the massive H I halo. This corroborates the cooling rate problem.
-
•
There is no plausible cold accretion mechanism to supply so much gas so rapidly to NGC 891, so we speculate that a prior outflow has taken place. There is circumstantial evidence for some kind of past nuclear starburst in a few other massive, late-type galaxies with high star formation spread throughout the disk. However, the parameters of such an outflow cannot be constrained from the present data.
1-T and 2-T models of hot halos have been criticized as undermodeling the true spectrum, which may be considerably more complex (Strickland & Stevens, 2000). However, there is reason to believe (at least in non-starburst galaxies) that the halo really is simple. Although we have presented arguments in favor of the reality of the low in the 1-T model and that the 1-T model better explains the coronal morphology, a definitive test could be made with a deep (400 ks total) exposure that would allow line ratios to be measured even at the low spectral resolution of the EPIC CCDs. We believe that we have demonstrated that the background is well enough understood and the temperature well enough established to make this test feasible.
In addition, such an exposure would allow a definitive study of the smoothness of the halo. Coronal material is frequently described as “filamentary” in the literature, but in many cases the appearance of filaments may be biased by adaptive smoothing or related to PSF wings. In our XMM-Newton images of NGC 891, some apparent filamentary structure is revealed to be slightly brighter regions of the halo connected by dim point sources (seen in the Chandra data) or arcs that clearly trace the edge of a subtracted point source mask. Since the presence of this filamentary structure is an important test of state-of-the-art cooling models for accreted or hydrostatic halos (e.g. McCourt et al., 2011; Hobbs et al., 2012), a deep search for filaments that are not obviously related to outbursts (as in starburst galaxies) would be a welcome contribution.
Progress on the steady-state front requires a more sophisticated treatment of the galactic fountain mechanism, allowing for the action of interacting superbubble breakouts and superbubbles that form beneath debris falling back from prior breakouts. If it still appears that the instantaneous SFR in NGC 891 and its high SFR counterparts cannot explain the amount of extraplanar gas, a serious search for a sequence of post-starburst galaxies with luminous X-ray halos is warranted. Improved H I imaging from the HALOGAS project (Heald et al., 2011) will refine the estimates of H I residing above 1 kpc in nearby galaxies, but unfortunately X-ray imaging remains sparse. Still, the work by Tyler et al. (2004) and Kuntz & Snowden (2010) indicates that most galaxies will not have X-ray halos nearly as luminous as NGC 891. This in turn places cooling rate limits of about yr-1 on the halos of these galaxies, assuming a single-temperature plasma in hydrostatic equilibrium.
References
- Anders & Grevesse (1989) Anders, E., & Grevesse, N. 1989, Geochim. Cosmochim. Acta, 53, 197
- Arnaud (1996) Arnaud, K. A. 1996, in Astronomical Society of the Pacific Conference Series, Vol. 101, Astronomical Data Analysis Software and Systems V, ed. G. H. Jacoby & J. Barnes, 17
- Bagetakos et al. (2011) Bagetakos, I., Brinks, E., Walter, F., et al. 2011, AJ, 141, 23
- Bajaja et al. (1984) Bajaja, E., van der Burg, G., Faber, S. M., et al. 1984, A&A, 141, 309
- Belsole et al. (2003) Belsole, E., Sauvageot, J.-L., Ponman, T. J., & Bourdin, H. 2003, A&A, 398, 1
- Binney et al. (2000) Binney, J., Dehnen, W., & Bertelli, G. 2000, MNRAS, 318, 658
- Binney & Tremaine (2008) Binney, J., & Tremaine, S. 2008, Galactic Dynamics: Second Edition (Princeton University Press)
- Boomsma et al. (2005) Boomsma, R., Oosterloo, T. A., Fraternali, F., van der Hulst, J. M., & Sancisi, R. 2005, A&A, 431, 65
- Boomsma et al. (2008) —. 2008, A&A, 490, 555
- Bouché et al. (2012) Bouché, N., Hohensee, W., Vargas, R., et al. 2012, MNRAS, 3207
- Bregman (1980) Bregman, J. N. 1980, ApJ, 236, 577
- Bregman & Houck (1997) Bregman, J. N., & Houck, J. C. 1997, ApJ, 485, 159
- Bregman & Pildis (1994) Bregman, J. N., & Pildis, R. A. 1994, ApJ, 420, 570
- Brinks & Bajaja (1986) Brinks, E., & Bajaja, E. 1986, A&A, 169, 14
- Cardelli et al. (1989) Cardelli, J. A., Clayton, G. C., & Mathis, J. S. 1989, ApJ, 345, 245
- Carter & Sembay (2008) Carter, J. A., & Sembay, S. 2008, A&A, 489, 837
- Cash et al. (1980) Cash, W., Charles, P., Bowyer, S., et al. 1980, ApJ, 238, L71
- Chu et al. (1995) Chu, Y.-H., Chang, H.-W., Su, Y.-L., & Mac Low, M.-M. 1995, ApJ, 450, 157
- Cox & Smith (1976) Cox, D. P., & Smith, B. W. 1976, ApJ, 203, 361
- Dahlem (1997) Dahlem, M. 1997, PASP, 109, 1298
- Dahlem et al. (1994) Dahlem, M., Dettmar, R.-J., & Hummel, E. 1994, A&A, 290, 384
- de Vaucouleurs et al. (1991) de Vaucouleurs, G., de Vaucouleurs, A., Corwin, Jr., H. G., et al. 1991, Third Reference Catalogue of Bright Galaxies, ed. Roman, N. G., de Vaucouleurs, G., de Vaucouleurs, A., Corwin, H. G., Jr., Buta, R. J., Paturel, G., & Fouqué, P.
- Dettmar (1990) Dettmar, R.-J. 1990, A&A, 232, L15
- Dunne et al. (2001) Dunne, B. C., Points, S. D., & Chu, Y.-H. 2001, ApJS, 136, 119
- Edgar & Chevalier (1986) Edgar, R. J., & Chevalier, R. A. 1986, ApJ, 310, L27
- Fraternali & Binney (2006) Fraternali, F., & Binney, J. J. 2006, MNRAS, 366, 449
- Fraternali & Binney (2008) —. 2008, MNRAS, 386, 935
- Garcia-Burillo & Guelin (1995) Garcia-Burillo, S., & Guelin, M. 1995, A&A, 299, 657
- Garcia-Burillo et al. (1992) Garcia-Burillo, S., Guelin, M., Cernicharo, J., & Dahlem, M. 1992, A&A, 266, 21
- Grevesse & Sauval (1998) Grevesse, N., & Sauval, A. J. 1998, Space Sci. Rev., 85, 161
- Heald et al. (2011) Heald, G., et al. 2011, A&A, 526, A118
- Heald (2012) Heald, G. H. 2012, ApJ, 754, L35
- Hobbs et al. (2012) Hobbs, A., Read, J., Power, C., & Cole, D. 2012, ArXiv e-prints 1207.3814
- Hodges-Kluck et al. (2012) Hodges-Kluck, E. J., Bregman, J. N., Miller, J. M., & Pellegrini, E. 2012, ApJ, 747, L39
- Houck & Bregman (1990) Houck, J. C., & Bregman, J. N. 1990, ApJ, 352, 506
- Howk & Savage (1997) Howk, J. C., & Savage, B. D. 1997, AJ, 114, 2463
- Howk & Savage (2000) —. 2000, AJ, 119, 644
- Jaskot et al. (2011) Jaskot, A. E., Strickland, D. K., Oey, M. S., Chu, Y.-H., & García-Segura, G. 2011, ApJ, 729, 28
- Joung et al. (2012) Joung, M. R., Putman, M. E., Bryan, G. L., Fernandez, X., & Peek, J. E. G. 2012, ApJ, 759, 137
- Kalberla et al. (2005) Kalberla, P. M. W., Burton, W. B., Hartmann, D., et al. 2005, A&A, 440, 775
- Kalberla & Kerp (1998) Kalberla, P. M. W., & Kerp, J. 1998, A&A, 339, 745
- Kamphuis (1993) Kamphuis, J. J. 1993, PhD thesis, PhD Thesis, University of Groningen, (1993)
- Kennedy (2009) Kennedy, H. J. 2009, PhD thesis, Queen’s University (Canada
- Kim & Fabbiano (2003) Kim, D.-W., & Fabbiano, G. 2003, ApJ, 586, 826
- Kuntz & Snowden (2010) Kuntz, K. D., & Snowden, S. L. 2010, ApJS, 188, 46
- Li et al. (2008) Li, J.-T., Li, Z., Wang, Q. D., Irwin, J. A., & Rossa, J. 2008, MNRAS, 390, 59
- Li et al. (2007) Li, Z., Wang, Q. D., & Hameed, S. 2007, MNRAS, 376, 960
- Lodders (2003) Lodders, K. 2003, ApJ, 591, 1220
- Mac Low & McCray (1988) Mac Low, M.-M., & McCray, R. 1988, ApJ, 324, 776
- Mac Low et al. (1989) Mac Low, M.-M., McCray, R., & Norman, M. L. 1989, ApJ, 337, 141
- Marasco et al. (2012) Marasco, A., Fraternali, F., & Binney, J. J. 2012, MNRAS, 419, 1107
- Markevitch et al. (2003) Markevitch, M., et al. 2003, ApJ, 583, 70
- Mathews & Bregman (1978) Mathews, W. G., & Bregman, J. N. 1978, ApJ, 224, 308
- McCourt et al. (2011) McCourt, M., Parrish, I. J., Sharma, P., & Quataert, E. 2011, MNRAS, 413, 1295
- Melioli et al. (2008) Melioli, C., Brighenti, F., D’Ercole, A., & de Gouveia Dal Pino, E. M. 2008, MNRAS, 388, 573
- Melioli et al. (2009) —. 2009, MNRAS, 399, 1089
- Mineshige et al. (1994) Mineshige, S., Hirano, A., Kitamoto, S., Yamada, T. T., & Fukue, J. 1994, ApJ, 426, 308
- Mouhcine et al. (2010) Mouhcine, M., Ibata, R., & Rejkuba, M. 2010, ApJ, 714, L12
- Narayan & Medvedev (2001) Narayan, R., & Medvedev, M. V. 2001, ApJ, 562, L129
- Nulsen et al. (1984) Nulsen, P. E. J., Stewart, G. C., & Fabian, A. C. 1984, MNRAS, 208, 185
- Oosterloo et al. (2007) Oosterloo, T., Fraternali, F., & Sancisi, R. 2007, AJ, 134, 1019
- Oppenheimer et al. (2010) Oppenheimer, B. D., Davé, R., Kereš, et al. 2010, MNRAS, 406, 2325
- Otte et al. (2003) Otte, B., Murphy, E. M., Howk, J. C., et al. 2003, ApJ, 591, 821
- Peñarrubia et al. (2006) Peñarrubia, J., McConnachie, A., & Babul, A. 2006, ApJ, 650, L33
- Points et al. (2000) Points, S. D., Chu, Y.-H., Snowden, S. L., & Staveley-Smith, L. 2000, ApJ, 545, 827
- Popescu et al. (2004) Popescu, C. C., Tuffs, R. J., Kylafis, N. D., & Madore, B. F. 2004, A&A, 414, 45
- Protassov et al. (2002) Protassov, R., van Dyk, D. A., Connors, A., Kashyap, V. L., & Siemiginowska, A. 2002, ApJ, 571, 545
- Rand (1994) Rand, R. J. 1994, A&A, 285, 833
- Rand (1996) —. 1996, ApJ, 462, 712
- Rand et al. (2011) Rand, R. J., Wood, K., Benjamin, R. A., & Meidt, S. E. 2011, ApJ, 728, 163
- Rossa et al. (2004) Rossa, J., Dettmar, R.-J., Walterbos, R. A. M., & Norman, C. A. 2004, AJ, 128, 674
- Rupen (1991) Rupen, M. P. 1991, AJ, 102, 48
- Sancisi & Allen (1979) Sancisi, R., & Allen, R. J. 1979, A&A, 74, 73
- Sancisi et al. (2008) Sancisi, R., Fraternali, F., Oosterloo, T., & van der Hulst, T. 2008, A&A Rev., 15, 189
- Schlegel et al. (2003) Schlegel, E. M., Holt, S. S., & Petre, R. 2003, ApJ, 598, 982
- Shapiro & Field (1976) Shapiro, P. R., & Field, G. B. 1976, ApJ, 205, 762
- Smith & Wang (2004) Smith, D. A., & Wang, Q. D. 2004, ApJ, 611, 881
- Smith et al. (2001) Smith, R. K., Brickhouse, N. S., Liedahl, D. A., & Raymond, J. C. 2001, ApJ, 556, L91
- Smith & Cox (2001) Smith, R. K., & Cox, D. P. 2001, ApJS, 134, 283
- Snowden et al. (2004) Snowden, S. L., Collier, M. R., & Kuntz, K. D. 2004, ApJ, 610, 1182
- Spitzer (1962) Spitzer, L. 1962, Physics of Fully Ionized Gases
- Strickland & Heckman (2009) Strickland, D. K., & Heckman, T. M. 2009, ApJ, 697, 2030
- Strickland et al. (2004) Strickland, D. K., Heckman, T. M., Colbert, E. J. M., Hoopes, C. G., & Weaver, K. A. 2004, ApJS, 151, 193
- Strickland et al. (2000) Strickland, D. K., Heckman, T. M., Weaver, K. A., & Dahlem, M. 2000, AJ, 120, 2965
- Strickland & Stevens (2000) Strickland, D. K., & Stevens, I. R. 2000, MNRAS, 314, 511
- Sutherland & Dopita (1993) Sutherland, R. S., & Dopita, M. A. 1993, ApJS, 88, 253
- Swaters et al. (1997) Swaters, R. A., Sancisi, R., & van der Hulst, J. M. 1997, ApJ, 491, 140
- Temple et al. (2005) Temple, R. F., Raychaudhury, S., & Stevens, I. R. 2005, MNRAS, 362, 581
- Thilker et al. (1998) Thilker, D. A., Braun, R., & Walterbos, R. M. 1998, A&A, 332, 429
- Tikhonov & Galazutdinova (2005) Tikhonov, N. A., & Galazutdinova, O. A. 2005, Astrophysics, 48, 221
- Tüllmann et al. (2006) Tüllmann, R., Pietsch, W., Rossa, J., Breitschwerdt, D., & Dettmar, R.-J. 2006, A&A, 448, 43
- Tyler et al. (2004) Tyler, K., Quillen, A. C., LaPage, A., & Rieke, G. H. 2004, ApJ, 610, 213
- van den Bergh (1962) van den Bergh, S. 1962, AJ, 67, 486
- van der Kruit & Searle (1981) van der Kruit, P. C., & Searle, L. 1981, A&A, 95, 116
- Veilleux et al. (2005) Veilleux, S., Cecil, G., & Bland-Hawthorn, J. 2005, ARA&A, 43, 769
- Vogler et al. (1995) Vogler, A., Pietsch, W., & Kahabka, P. 1995, Advances in Space Research, 16, 139
- Wang et al. (1995) Wang, Q. D., Walterbos, R. A. M., Steakley, M. F., Norman, C. A., & Braun, R. 1995, ApJ, 439, 176
- Weaver et al. (1977) Weaver, R., McCray, R., Castor, J., Shapiro, P., & Moore, R. 1977, ApJ, 218, 377
- Wilms et al. (2000) Wilms, J., Allen, A., & McCray, R. 2000, ApJ, 542, 914
- Woolf & West (2012) Woolf, V. M., & West, A. A. 2012, MNRAS, 2606
- Worthey et al. (1996) Worthey, G., Dorman, B., & Jones, L. A. 1996, AJ, 112, 948
- Xilouris et al. (1998) Xilouris, E. M., Alton, P. B., Davies, J. I., et al. 1998, A&A, 331, 894
- Yukita et al. (2010) Yukita, M., Swartz, D. A., Tennant, A. F., & Soria, R. 2010, AJ, 139, 1066
- Zschaechner et al. (2011) Zschaechner, L., Rand, R. J., Heald, G. H., Gentile, G., & HALOGAS Team. 2011, in Bulletin of the American Astronomical Society, Vol. 43, American Astronomical Society Meeting Abstracts #217, #246.23