CXOGBS J174444.7260330: a new long orbital period cataclysmic variable in a low state††thanks: data from ESO programs 085.D-0441(A) and 087.D-0596(D)
Abstract
We present phase-resolved spectroscopy and photometry of a source discovered with the Chandra Galactic Bulge Survey (GBS), CXOGBS J174444.7260330 (aka CX93 and CX153 in the previously published GBS list). We find two possible values for the orbital period , differing from each other by 13 seconds. The most likely solution is 5.69014(6) hours. The optical lightcurves show ellipsoidal modulations, whose modeling provides an inclination of 32∘ for the most likely . The spectra are dominated by a K5 Vcompanion star (the disc veiling is 5%). Broad and structured emission from the Balmer lines is also detected, as well as fainter emission from HeI. From the absorption lines we measure K1178 and . By solving the system mass function we find M0.8 M⊙ for the favored and , consistent with a white dwarf accretor, and M0.60.2 M⊙. We estimate a distance in the range . Although in a low accretion state, both spectroscopy and photometry provide evidence of variability on a timescale of months or faster. Besides finding a new, long orbital period cataclysmic variable in a low accretion state, this work shows that the design of the GBS works efficiently to find accreting X-ray binaries in quiescence, highlighting that the spectra of CVs in a low-accretion state can at times appear suggestive of a quiescent neutron star or a black hole system.
keywords:
stars: individual (CXOGBS J174444.7260330) — individual (CX93 =CX153) —accretion: accretion discs — X-rays: binaries — (stars:) novae, cataclysmic variables— stars: dwarf novae1 introduction
We present optical follow-up of the X–ray source CXOGBS J174444.7260330, discovered in the Galactic Bulge survey (GBS) of Jonker et al. (2011). For the ease of readability, we will refer to the source with its label in the GBS source list, CX93. One of the main goals of the GBS is to detect quiescent X-ray binaries (XRBs) - namely binary systems where a white dwarf (WD), a neutron star (NS) or a black hole (BH) is accreting matter from a companion star - that are suitable for dynamical measurements of the mass of the compact object. Those mass measurements can be done through phase-resolved optical spectroscopy of the donor star, provided that good constraints can be put on the binary inclination. If the system inclination is known, the mass of the accreting compact object can be obtained by solving the system mass function (see, for instance, Charles & Coe 2006). This requires measuring the orbital period , the semi-amplitude of the radial velocity curve of the companion star K2 and the ratio between the mass of the donor and that of the accretor, . In Roche lobe filling XRBs, with tidally locked companion stars, is a function of K2 and of the projected rotational velocity of the secondary star (Wade & Horne, 1988), which is measured from the broadening of the stellar absorption lines.
Prime targets for this study are eclipsing systems, where the inclination can be derived from the eclipse duration based on geometrical arguments only. Among non-eclipsing systems, the inclination can be estimated by modeling the ellipsoidal variation in the optical lightcurve, caused by the distortion of the companion star shape associated with Roche-lobe overflow (care must be taken if other continuum sources contribute to the lightcurves).

Because CXOGBS J174444.7260330 was initially not identified as a duplicate, it has two labels in the GBS source list, CX93 and CX153 (the offset between the two detections is 3′′). The best X–ray source position, from observation CX93, is R.A. = , Dec. = (the 1 uncertainties, indicated in between brackets, do not include the 90% confidence 06 Chandra boresight error). The source was identified as a quiescent X-ray binary candidate based on preliminary low-resolution spectra of the optical counterpart (Figure 1). A near infrared (NIR) counterpart to CX93 was found in the data from the VISTA (Visible and Infrared Survey Telescope for Astronomy) variable sources in the Via Lactea (VVV) survey (Minniti et al. 2009, Catelan et al. 2011, Saito et al 2011), with magnitude 14.810.02 in the J-band, 14.010.02 in the H-band and 13.760.03 in the K-band. Here we present phase-resolved photometry and optical spectroscopy of the target performed with several instruments. We detected signatures from the mass donor star, which allowed us to measure the orbital ephemeris and constrain the mass of the accreting compact object.
2 Observations and data reduction
| Instrument | Date | # | Exposure | Grism/Filter | Seeing | Slit width | Binning | Sp. range | Resolution | Dispersion |
| (UT) | (s) | (arcsec) | (arcsec) | () | () | (/px) | ||||
| Spectroscopy | ||||||||||
| VIMOS | 2011 Apr. 29 | 2 | 875 | MR-2.2 | 0.6 | 1.0 | 1x1 | 4879-10018 | 10 | 2.50 |
| IMACS | 2011 Jun. 23-26 | 4 | 1200-600 | Gri-300-17.5 | 0.8-1.2 | 1.0 | 1x1 | 4365-6654 | 4.5 | 1.28 |
| FORS | 2011 Jul. 4 | 4 | 900 | 1200R+93 | 0.9-1.4 | 1.0 | 2x2 | 5957-7280 | 2 | 0.38 |
| MagE | 2011 Aug. 6 | 1 | 900 | Echelle | 1.2 | 1.0 | 1x1 | 3100-11200 | 1.6 | 0.47 |
| Photometry | ||||||||||
| Mosaic | 2010 Jul. 12-18 | 33 | 120 | Sloan r′ | 1.3 | – | – | – | – | – |
| Swope | 2011 Jun. 27-28 | 360 | 60 | Gunn r | 1.5 | – | – | – | – | – |
2.1 Phase-resolved imaging
CX93 was observed in 2010 Jul. using the Mosaic-2 instrument on the Cerro Tololo Interamerican Observatory 4 m Blanco telescope (Table 1).
Thirty three 120s-long exposures were collected through the Sloan filter. Initial data processing was done by the National Optical Astronomy Observatory (NOAO) Mosaic pipeline (Shaw, 2009). The lightcurves were extracted using the ISIS image subtraction code (Alard & Lupton, 1998; Alard, 1999), which provided clean subtracted images. A variable optical counterpart coincident with the X-ray position of CX93 was clearly identified, despite the fact the variability is only at the level of 5%. We independently analyzed the images using DAOPhot II (Stetson, 1987) and obtained comparable lightcurves, although of somewhat poorer quality than those obtained with ISIS. Since ISIS only yields differential count rates, we used DAOPhot II on the best reference image to measure the baseline (non-variable) count rate. This together with the differential count rates from ISIS yielded total count rates as a function of time. We finally converted these to approximate magnitudes using conversion factors supplied by the NOAO pipeline. These are deduced by comparison to USNO B1.0 stars, and have an estimated uncertainty of at least 0.5 magnitudes. The magnitude of CX93 is 170.5 magnitudes in the r′-band.
CX93 was also observed using the Direct CCD Camera on the Henrietta Swope Telescope at Las Campanas Observatory on the night of 2011 Jun. 27/28. A sequence of 60 sec exposures was obtained through a Gunn filter for about six hours. Bias correction and flat fielding was performed through standard CCD data processing in iraf111IRAF is distributed by the National Optical Astronomy Observatory, which is operated by the Association of Universities for Research in Astronomy (AURA) under cooperative agreement with the National Science Foundation.. ISIS was used for image subtraction photometry as for the Mosaic-2 data.
 |
 |
 |
2.2 Optical spectroscopy
We combined spectroscopic observations from a number of telescopes: the VIsible Multi-Object Spectrograph (VIMOS) and the Focal Reducer and Spectrograph (FORS) at the Very Large Telescope, the Inamori Magellan Areal Camera and Spectrograph (IMACS) at the Magellan telescope, the ESO Faint Object Spectrograph and Camera (EFOSC) at the New Technology Telescope (NTT) and the Magellan Echelle (MagE) spectrograph, also at the Magellan telescope. A list of the observations and the instrument settings is given in Table 1. The NTT/EFOSC data are not included in the table and in the rest of this work because of the poor quality of the data due to weather conditions. Template spectra of the stars HD163197 (spectral type K4IV) and HD130992 (K3.5V) were also observed with FORS and MagE, respectively. The images were corrected for bias, flat-fielded and extracted using the Figaro package within the Starlink software suite and the packages Pamela and Molly developed by T. Marsh. We used sky flats for the flat-fielding and we subtracted the sky background by fitting clean sky regions along the slit with a second order polynomial. The spectra were optimally extracted following the algorithm of Horne (1986) implemented in Pamela and wavelength-calibrated in Molly with a final accuracy of 0.02 for FORS (using arc exposures taken during daytime), 0.04 for IMACS, 0.09 for VIMOS and 0.04 for MagE. In each spectrum, the wavelength calibration was checked and corrected for shifts with respect to the position of the night-sky OI lines at 5577.338 and/or at 6300.304 (Osterbrock et al., 1996). Each spectrum has been normalised dividing by a spline fit to the continuum, with a maximum order of 10. The full MagE spectrum was extracted, but only order 9 (5630-6673 ) and 10 (6265-7415 ) were used for our dynamical study of CX93, as they cover the spectral region of the H and Ca I, which is rich in absorption features for K type stars and where the signal-to-noise ratio in the spectrum is highest. The MagE spectra show a complex continuum, mainly caused by instrumental response variations across the relevant orders. In order to normalise the spectra, we clipped two 300 -long pieces from the order 9 spectrum (5920-6240 and 6310-6630 ), and one from the order 10 (6300-6750 ). The regions were selected to keep as many absorption lines as possible in one spectrum. By selecting short pieces from the spectrum we could achieve a good fit to the continuum on each piece with a relatively low-order spline (order 10), avoiding as much as possible the risk of altering the equivalent width of the lines that occurs when using high order splines. The overlap between the orders 9 and 10 allows for a double-check of the results.
 |
 |
3 Analysis and results
3.1 Spectral features
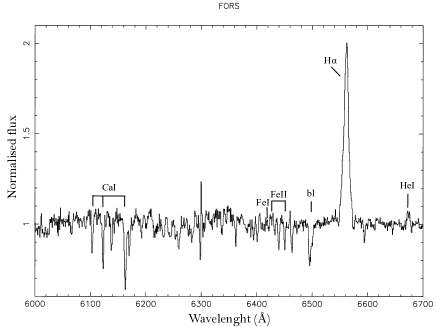
The spectra of CX93 display a number of absorption lines from the stellar atmosphere of the companion star, but also strong emission lines consistent with H and H and with HeI at 6678.149 and 5875.618. For each instrument, we combined all the spectra into an average spectrum, after correcting for the Doppler shift of the lines due to the orbital motion (see Section 3.3 for the measurement of the orbital shifts).
The top panel of Figure 2 shows the average of the IMACS spectra where the H and H lines appear as prominent emission features. HeI in emission at 5875.618 is next to a blend of the NaI doublet lines in absorption (5895.92, 5889.95) mainly produced by the interstellar medium. The MgI triplet at 5167, 5172 and 5183 is visible, although not resolved. The CaI triplet (6102, 6122 and 6162) and a blend of stellar lines in absorption at 6495 are also present.
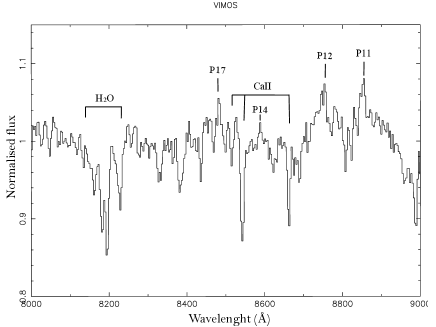
The Doppler-corrected average of the FORS spectra, in the central panel of Figure 2, shows the region of H, with better resolution than that of the IMACS spectrum. HeI in emission at 6678.149 and a forest of absorption lines are visible, in particular from FeII at 6432.65 and 6457 and FeI at 6430.85. Finally, the bottom panel of Figure 2 shows a section of the Doppler-corrected average of the VIMOS spectra, displaying the main features in the red part of the spectrum of CX93: the CaII triplet in absorption, at 8498, 8542 and 8662, and a number of emission lines from the Paschen series of hydrogen. A telluric molecular band of water is also present.
In most of the spectra, the H emission line appears single-peaked but composite, with a main peak overlapping with at least one side wing. Both components are broad, with FWHM of the order of 350-450 . The equivalent width (EW) of the line is roughly constant around across the IMACS and FORS spectra, with no dependence on phase. In the MagE spectrum, taken one month later, it drops significantly to -2.9 . The two VIMOS spectra, collected two months earlier than all the other data-sets, suggest a more active state of the source compared to the IMACS and FORS observations. The EW is -133 and -140 in the two spectra.
The H line has similar EW to H and an even larger FWHM of .
3.2 Binary period
The orbital period of CX93 was determined using the Mosaic-2 lightcurve, combined with spectroscopic information. The Swope data provide only loose constraints on the system parameters, which we therefore only used as a consistency check of our results. In order to obtain the best possible accuracy on , we followed three main steps.
-
•
An initial Lomb-Scargle periodogram of the Mosaic-2 data revealed an apparent period of 0.12 d. Some dispersion was seen when the Mosaic-2 lightcurve was folded on this period indicating that this is the first harmonic. Folding on twice this period yielded an asymmetric double-humped lightcurve (Figure 3, top panel). A period of =0.23710(5) d was measured by fitting the lightcurve with a sum of two sine waves, with a 2:1 frequency ratio, and amplitudes and relative phases allowed to vary freely. Error bars were estimated in the usual way from totals, after adding an additional error to the Mosaic-2 datapoints to represent unresolved flickering. The Swope data provide a less constrained 0.23(1) d, consistent with the Mosaic-2 result. Unfortunately a joint fit to both data sets was not well constrained due to the difficulty in extrapolating the ephemerides across a year (see below), and possible changes in lightcurve morphology.
-
•
The Mosaic-2 was then used to phase fold the spectroscopic observations and construct an initial radial velocity curve (rvc, the procedure is described in Section 3.3, for the final orbital period). The rvc looked consistent with orbital motion of the companion star, and was fitted with a sine wave, measuring T0 in between the time of the spectroscopic observations. We double-checked the measurement of the orbital period leaving it free in the fit, obtaining d as expected.
-
•
At last, T0 was compared with the time of the phase 0 in the Mosaic-2 lightcurve, . We refined the measurement of by considering that it must be such that the difference TTM corresponds to an integer number of orbital cycles. Both the minima in the Mosaic-2 lightcurve potentially correspond to , since the measured above is not accurate enough to unambiguously phase the lightcurve, collected one year earlier than the spectroscopic observations. Depending on the phasing, we find three possible solutions for . If is at the deepest, primary minimum of the Mosaic-2 lightcurve, then d, with TT. If corresponds to the secondary minimum, than 0.237169(3) d with TT or d with TT. The rvc fitting favors the first solution, as it is the closest to the best-fitting period. The second solution is less likely but, yielding a of 3.5 with respect to the best-fit , it has a probability of % to be correct. The last solution is very unlikely, yielding .
In conclusion, 0.237089(3) d is the statistically most likely orbital period for CX93, although 0.237169(3) d can not be ruled out at high confidence.
3.3 Radial velocity curve
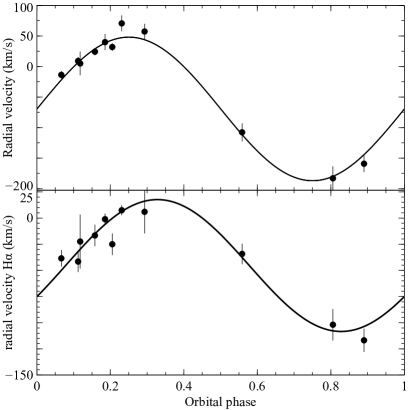
The orbital Doppler shifts of the companion star in CX93 were measured from the absorption lines in the spectra, by cross-correlating with the K4 IV template star spectrum acquired with FORS. The emission lines were masked. Since we were using observations from different instruments, the template and each target spectrum were re-binned to the same dispersion and broadened to the same spectral resolution before the cross-correlation. For MagE, the order 10 and the two parts in which the order 9 was split were cross-correlated separately with the FORS template, and the results were averaged in order to reduce the uncertainty. For all the spectra, the uncertainty on the velocity offsets due to the wavelength calibration has been added in quadrature to the velocity errors from the cross-correlation. The observations were phase folded with the most likely orbital period from Section 3.2, obtaining the rvc shown Figure 4 (top panel).
The rvc was fitted with a circular orbit of the form v()=K, providing a large reduced of (8 degrees of freedom). The uncertainties on the parameters were estimated assuming that the sinusoidal model was correct, and multiplying the errors of the individual velocity shifts by 3 to reach a reduced close to 1. T0 was calculated near the middle of the time of the observations and so that , according to the convention of phase 0 at inferior conjunction of the companion star. The period was fixed in the fit. The resulting parameter values are:
T HJD/UTC
K
and , in the rest frame of template star employed for the cross correlation. A systemic radial velocity of 29.80.4 was found for the latter, by fitting a Gaussian function to the H absorption line and measuring the offset of the line centroid with respect to its rest-frame wavelength. The systemic velocity for CX93 is thus
396 .
Figure 4 (bottom panel) shows the rvc for the H line, where the orbital velocities were measured through Gaussian fitting to the line peak in each spectrum. The curve was constructed and fitted as we did above. The orbital motion is close to that of the companion star (from the absorption lines), only slightly leading in phase by 0.080.03. The fit provides K , smaller than the radial velocity semi-amplitude we measured from the absorption lines, suggesting an origin of the H line towards the inner face of the companion. The CX93 systemic velocity is , consistent at the 1 level with the result above.
Similarly, we measured radial velocity shifts for the H wing feature. We find variable velocity shifts from up to 600 towards the red or the blue, with no clear dependence on the orbital phase.
3.4 Rotational broadening and mass ratio
The observed FWHM of the absorption lines in the spectra is determined by the intrinsic line width, expected to be dominated by rotational broadening, broadened by the instrumental resolution profile and smeared by the motion of the companion star during the integration time of one observation.
In order to measure the intrinsic line width, namely , we analysed the MagE spectra, which have the best resolution among our data-sets. We considered all the absorption lines in the spectrum (none of which is known to be strongly affected by thermal or pressure broadening), masking the emission lines. The spectral type of the MagE template, K3.5V, is likely close to that of the companion star in CX93 (see Section 3.5). Steeghs & Jonker (2007) showed that a small difference in the spectral type of target and template star do not significantly effect the measurement of in close binaries. The integration time smearing on the target spectra was taken into account by artificially smearing the template spectrum by , where is the duration of one exposure on CX93. After that, we broadened the template spectrum with different trial values of . For each trial value, the template was subtracted from the target spectrum and a test was performed on the residuals. Different scalings of the template are tried to account for possible disc veiling222the optimal subtraction is performed using the optsub command in molly. The routine works on normalized spectra, assuming , where is the flux of the target, of the template, is the disc contribution outside the lines and is a constant, the optimum factor. The routine finds the that minimizes the structure in the residuals between and a smooth version of (), accounting for broad features in the disc spectrum. The disc veiling is .. The broadening that gives the minimum is a measure of the actual . A value of 0.5 for the limb darkening was assumed, appropriate for a main sequence star as we expect for a 5 hour orbit. Steeghs & Jonker (2007) tested the effect of the uncertainty on the limb darkening coefficient on , showing that it is for a difference of 0.25 in the limb darkening. This is negligible with respect to the error on our measurement (see below). Finally, since we subtract template and target spectra acquired with the same instrument, the instrumental resolution profile is not affecting the procedure.
The uncertainty on was estimated following the Monte Carlo approach used by Steeghs & Jonker (2007). We copied the target spectrum 500 times, using a bootstrap technique where the input spectrum is resampled by randomly selecting data points from it. The bootstrapping maintains the total number of data points in the spectrum. For each bootstrap copy, one value of was measured, corresponding to the minimum of the residuals as described above. The distribution of obtained from the 500 copies is well described by a Gaussian, whose mean and root-mean-square (rms) provides the best-fit and its 1 error. Our final measurement of the rotational broadening is the uncertainty-weighted average of the measures from the first and second piece of the MagE order 9, (Figure 5).
Given and K2 we could calculate the system mass ratio from the relation (Wade & Horne, 1988). The uncertainty on q was again estimated with a Monte-Carlo simulation, calculating q for 1000 sets of and K2 randomly selected within the 1 uncertainty on the parameters.
The average of the 1000 simulated measurements provides , where the uncertainty is the standard deviation of the sample.
3.5 Companion star spectral type
In order to constrain the spectral type of the mass donor in CX93, we considered a set of 21 high signal-to-noise template spectra of G and K stars of luminosity class V, III and IV, acquired with the William Herschel and the Isaac Newton telescopes between 1992 and 1994. Some of them were previously used for spectral type classification by Casares et al. (1996) and Torres et al. (2002).
We subtracted each template spectrum from the Doppler-corrected average of our FORS observations, performing a test on the residuals of the subtraction. The template resulting in the minimum provides our best estimate for the source spectral type. The spectra were shifted to the rest frame of the FORS average spectrum, and degraded to match the FORS sampling and the line broadening in the target spectra. The appropriate broadening (accounting for the difference in resolution between the templates and the FORS spectrum and the line broadening intrinsic to the source) was found in a similar manner as we did for measuring : different broadened versions of each template were subtracted (through optimal subtraction, accounting for veiling) from the CX93 spectrum, until the minimum was obtained from the fitting of the residuals. As for , we assumed a limb darkening of 0.5.
The minimum is obtained for the K5 V template 61CYGA, with an optimum factor of 0.98, indicating a disc veiling of %. It is reasonable to assume an uncertainty of one spectral type when using this procedure.
Using the same method decribed in Ratti et al. (2010) (but adopting standard stellar magnitude in the 2mass J, H and K filters from Mamajek 2011333http://www.pas.rochester.edu/emamajek/
EEM_dwarf_UBVIJHK_colors_Teff.dat) we find that the spectral type K5 V is fully consistent with the J, H and K magnitude of CX93 from VVV, for a reasonable value of the extinction of A (A, see Discussion).
3.6 Ellipsoidal modulations and system inclination
The phase folded Mosaic-2 and Swope lightcurves in Figure 3 show variability between the two data-sets. The Swope lightcurve displays pure ellipsoidal modulations, with equal maxima and the deepest minimum at phase 0.5, while the Mosaic-2 one, collected one year earlier, presents asymmetric maxima.
We attempted to determine the system inclination by modeling the lightcurves with the XRbinary program written by E.L. Robinson444http://pisces.as.utexas.edu/robinson/XRbinary.pdf.
The Mosaic-2 Sloan and the Swope Gunn filters were represented by a 5548-6952 and by a 6181-7212 square bandpass, respectively. In the modeling we assume K2 and as determined in Sections 3.3 and 3.4, and that the mass donor is a K5V star (see Section 3.5) with an effective temperature of 4500 K (Mamajek 2011). As we did in Section 3.2, the Mosaic-2 data were primely used to constraint the inclination, while the Swope observations was kept for consistency checks only, due to the poorer quality of the data.
Depending on the phasing, we fitted the Mosaic-2 lightcurve (Figure 3, top panel) with two models. For the most likely period, the lightcurve has the deepest minimum at phase 0.5 and the highest maximum at phase 0.25. We modeled this with ellipsoidal modulations plus a single (corotating) hot spot on the outer edge of an otherwise non-luminous disc, centred so that it faces earth at phase 0.25 (which is unusual, see Discussion). This provides a reduced of 4 (30 d.o.f.) and an inclination of .
For the alternative orbital period, the minimum at phase 0.5 is no longer the deepest, which implies heating of the side of the secondary facing the primary.
We modeled this assuming irradiation from the primary component. On top of ellipsoidal variations, a disc-edge spot, now at phase 0.75, is again included in the model to account for the asymmetric maxima. Since this model depends on the (unknown) disc geometry, two disc versions were tried, with a height to outer radius ratio of 1 to 12 and 1 to 24.
The resulting system inclination is and , respectively.
The Swope data, modeled with ellipsoidal modulations only, are consistent with all the values of the inclination determined above. Because the Swope observations were taken close to the spectroscopic ones (one night after the last IMACS pointing), and the disc veiling was 2% in the spectra, it is safe to assume very little disc contribution to the Swope lightcurve. Its consistency with the inclination estimated from the Mosaic-2 data therefore suggests that the latter are not heavily affected by an accretion disc contribution either (on the effect of a disc contamination on see Cantrell et al. 2010).
3.7 Mass of the stellar components
The mass function 0.04 of CX93 is too small to constrain the nature of the primary. However, including our measurements of and , we can solve it for all dynamical parameters. For the most probable period (see Section 3.2), we obtain M M⊙ and M M⊙. The uncertainty was obtained with a Monte-Carlo method, as we did for in Section 3.4. For the alternative period the inclination is more uncertain and the masses are reduced to M M⊙ and M M⊙.
3.8 UV counterpart
We searched for an ultraviolet (UV) counterpart to CX93 in 900 seconds long observations from the Galaxy Evolution Explorer (GALEX). The closest object to the source is a 2-detection at an angular distance of 2.2′′ from our Chandra position. Even assuming that the detection was real, the position is not consistent with that of CX93 (the 1 accuracy of the astrometry of GALEX is 04, plus a systematic uncertainty of 02 in Dec). The non-detection of a counterpart in GALEX provides an upper limit to the magnitude of CX93 of 22 AB magnitudes in the near UV GALEX filter (at 2500 , limiting magnitude at 3).
4 Discussion
We have performed phase resolved optical spectroscopy and photometry of the optical counterpart to CX93, constraining the system parameters. We found an orbital period of more than 5.6 hours (most likely 5.69014(6) hours) and an inclination of 32-36∘(most likely ). The best-estimated masses of the primary and secondary star are 0.8 M⊙ and 0.60.2 M⊙, although lower masses are possible depending on the phasing of the Mosaic-2 lightcurve. The latter displays minima consistent with ellipsoidal modulations, but asymmetric maxima (this is often called O’Connel effect, see Wilsey & Beaky 2009 for a review). Two values of the period, differing by 13 seconds, provide an acceptable fit to both the lightcurve and the radial velocity data, causing an ambiguity of half cycle in the phasing. For the most likely period, we could model the lightcurve with ellipsoidal modulations plus a disc spot accounting for the highest maximum, at phase 0.25. The phasing of the disc spot is unusual though, as a mass transfer stream hitting the accretion disc is expected to produce a hot spot that leads the donor. Alternative effects causing the shape of the lightcurve, consistent with the phasing, are tidal interaction of the companion star with the outer disc (Frank et al. 2002, although the most commonly observed tidal interaction effect, superhumps, can only happen in systems with , Hynes 2012) or starspots reducing the light at one maximum (see, e.g., Wilsey & Beaky 2009). The latter are often invoked to explain to the O’Connel effect, but a realistic model of starspots is hard to produce with lightcurve modeling codes, especially when a single band lightcurve is available. Compared to the disc-spot model, the effect of a starspot model on the system parameters would be to increase the inclination, leading to smaller masses.
All our data indicate that the primary is a WD, placing CX93 in the class of cataclysmic variables (CVs). The mass of the donor is consistent with the spectral type favored by our spectroscopic observations (K5 V, typical mass is M⊙; Drilling & Landolt 2000), or slightly under-massive for the highest inclination scenario. Under-massive companions are often observed in XRBs and CVs as a result of their accretion history (e.g., Her X–1 and Cyg X–2, see Tauris & van den Heuvel 2006, Knigge 2006).
The de-reddened upper limit to the UV flux that we could obtain from the Galex observations (assuming AV as derived in section 3.5) is rather uncertain, due to possible deviation of the extinction law compared to the standard one we used (from Cardelli et al. 1989). Still, by comparing WD models from Koester et al. (2005) with our UV upper limit, we conclude that the non-detection of a UV counterpart is consistent with the presence of a 15000-30000 K WD (in agreement with the WD temperature we find for the irradiation model of the Mosaic-2 lightcurve) while a much hotter object would have been detected.
4.1 Distance and X–ray luminosity
By comparing the typical K-band magnitude of a K5V star (M4.42, Mamajek 2011) with the observed magnitude m, and assuming A (A) as estimated in Section 3.5, we obtain the distance 66423 to CX93.
This estimate relies on the assumption that the absolute magnitude of the companion is typical of a normal main sequence star, which is not true for CVs in general (Knigge, 2006). The typical radius of a K5V star is 0.72 R⊙ (Drilling & Landolt, 2000). Using the mass-to-radius relation found by Knigge (2006) for secondary stars in long orbital period CVs, we find that our best mass estimate for the donor, 0.60.2 M⊙, yields a radius of R⊙ (this is consistent with the Roche lobe radius of the companion 0.62 R⊙ for M and ). The secondary in CX93 is then fainter than a typical K5V by 0.1 to 0.6 magnitude, allowing a distance of 500 .
Further uncertainty to the distance comes from the assumed spectral type. Allowing the spectral type to be off by one, our observations suggest a likely distance between .
Although seemingly high, the extinction we estimated is consistent with a nearby object. In fact, extinction maps obtained from red clump stars within VVV, with a resolution of 22′, indicate E(B-V)=1.67 (A) in the direction of CX93 (Gonzalez et al., 2011).
Converting into an hydrogen column density (following Güver & Özel 2009) yields N. Assuming a power-law spectrum with index 1.6, the 14 counts observed by Chandra from CX93 in the full ACIS range (0.3-8 keV) correspond to an unabsorbed flux of 3.910-13 . For 664 the 0.3-8 keV X–ray luminosity of CX93 is 1.8 . Compared with typical CVs luminosities ( ) this is consistent with a low accretion state.
4.2 The difficult classification of quiescent XRBs
The low X–ray luminosity, the the lack of clear signatures of ongoing accretion and the little disc veiling in the optical spectra indicate that CX93 was in a low state during most of our observations. Disc emission is possibly responsible for the wings at the base of the H line, showing high radial velocities of a few hundred , but the peak of the line traces the donor star (only slightly leading in phase) and can hardly be reconciled with disc motion.
The low state and dominance of the companion over the spectra makes the classification of the system in terms of CV subclasses difficult. An intermediate polar scenario, consistent with the presence of little disc, seems to be ruled out by the lack of typical lines from magnetic CVs in the spectra (such as prominent HeII, Williams 1989, Schwarz et al. 2004), but even those lines could be absent if the accretion rate is very low.
The complex H line resembles nova-like systems such as BB Doradus (Schmidtobreick et al., 2012) which do show composite emission features that are not directly from either the secondary star or a remnant disc. Although the dynamics of the line suggests an origin near the tip of the companion star, in fact, the observed FWHM is too broad ( ) to be ascribed to photospheric activity or irradiation of the secondary surface only (although saturation effect might play an important role). CX93 also shows some similarity with the VY Sculptoris subclass of nova-like CVs (NL), which do show extended low accretion states when there can be hardly any evidence of ongoing accretion (see, e.g. the low state of MV Lyrae in Linnell et al. 2005). A dwarf nova scenario also seems viable, with the source ongoing a small outburst at the time of the Mosaic-2 observations, but with the low accretion rate preventing clear accretion features from showing the classification remains tentative.
CX93 also shows that a little level of variability in a quiescence CV can produce spectral features resembling a quiescent BH or NS.
Plotting the EW of the Balmer lines detected in the VIMOS spectra against the X–ray to optical flux ratio (, following Patterson & Raymond 1985) provides outlying values for a CV that are suggestive of a more compact accretor. The values are consistent with a normal CV if we consider the IMACS spectra instead.
Moreover, it is worth noticing that reference quantities such as the X–ray luminosity and are not good indicators of the source type for deeply quiescent systems as they are for actively accreting ones. The typical X–ray luminosity for quiescent NS or BH XRBs ( ) is in fact consistent with that of a CV in a low state, and is the same for all XRBs when the companion star dominates the optical light.
In conclusion, in a quiescent system like CX93 even the nature of the accretor can be mistaken without a complete dynamical study (see also Marsh et al. 1994). This is important to take into account for projects, such as the GBS, that aim to identify new NSs or BHs.
5 Conclusion
We performed a full dynamical study of the GBS source CXOGBS J174444.7260330 (CX93), finding that the source is a nearby () long orbital period ( hours) CV, in a state of low accretion rate. One episode of accretion at higher rate was possibly caught in one of our lightcurves, displaying asymmetric maxima that could be fitted with a disc spot. Alternative causes for the asymmetric maxima, such as the presence of starspots on the companion star, are difficult to realistically model. The secondary is likely of spectral type (close to) K5 V and dominates the spectra, which display a disc contribution of . The classification of the source among CV subclasses is difficult. A DN (in particular a VY Sculptoris) or NL system in a low state seems likely, although we can not exclude a magnetic WD accreting at a very low rate. The case of CX93 highlights that CVs in a low accretion state can be hard to distinguish from quiescent XRBs with a NS or BH primary.
Acknowledgments
R. I. H and C. T. B. acknowledge support from the National Science Foundation under Grant No. AST-0908789.. R. I. H. also acknowledges support from NASA/Louisiana Board of Regents grant NNX07AT62A/LEQSF(2007-10) Phase3-02. P. G. J acknowledges support from a VIDI grant from the Netherlands Organisation for Scientific Research. D. S. acknowledges support from STFC via an Advanced Fellowship and the Warwick Rolling grant. Tom Marsh is thanked for developing and sharing his packages Pamela and Molly and E.L. Robinson for his XRbinary code. We also acknowledge G. Nelemans for useful discussions and J.E.McClintock for his comments.
References
- Alard (1999) Alard C., 1999, A&A, 343, 10
- Alard & Lupton (1998) Alard C., Lupton R. H., 1998, ApJ, 503, 325
- Cantrell et al. (2010) Cantrell A. G., Bailyn C. D., Orosz J. A., McClintock J. E., Remillard R. A., Froning C. S., Neilsen J., Gelino D. M., Gou L., 2010, ApJ, 710, 1127
- Cardelli et al. (1989) Cardelli J. A., Clayton G. C., Mathis J. S., 1989, ApJ, 345, 245
- Casares et al. (1996) Casares J., Mouchet M., Martinez-Pais I. G., Harlaftis E. T., 1996, MNRAS, 282, 182
- Charles & Coe (2006) Charles P. A., Coe M. J., 2006, in Cambridge Astrophysics Series, Vol. 39, Compact stellar X-ray sources, Lewin, W., van der Klis, M., ed., Cambridege Univ. Press, pp. 215–265
- Deller et al. (2012) Deller A. T., Archibald A. M., Brisken W. F., Chatterjee S., Janssen G. H., Kaspi V. M., Lorimer D., Lyne A. G., McLaughlin M. A., Ransom S., Stairs I. H., Stappers B., 2012, ArXiv e-prints
- Dickey & Lockman (1990) Dickey J. M., Lockman F. J., 1990, ARA&A, 28, 215
- Drilling & Landolt (2000) Drilling J. S., Landolt A. U., 2000, in Allen’s Astrophysical Quantities, Cox, A. N., ed., New York: AIP Press; Springer, p. 381
- Frank et al. (2002) Frank J., King A., Raine D. J., 2002, Accretion Power in Astrophysics: Third Edition. Cambridge, UK: Cambridge University Press
- Gonzalez et al. (2011) Gonzalez O. A., Rejkuba M., Zoccali M., Valenti E., Minniti D., 2011, A&A, 534, A3
- Güver & Özel (2009) Güver T., Özel F., 2009, MNRAS, 400, 2050
- Honeycutt & Kafka (2004) Honeycutt R. K., Kafka S., 2004, AJ, 128, 1279
- Horne (1986) Horne K., 1986, PASP, 98, 609
- Hynes (2012) Hynes R. I., 2012, to appear the proceedings of the XXI Canary Islands Winter School of Astrophysics. Ed. T Shahbaz, CUP, arXiv:1010.5770
- Jonker et al. (2011) Jonker P. G., Bassa C. G., Nelemans G., Steeghs D., Torres M. A. P., Maccarone T. J., Hynes R. I., Greiss S., Clem J., Dieball A., Mikles V. J., Britt C. T., Gossen L., Collazzi A. C., Wijnands R., In’t Zand J. J. M., Méndez M., Rea N., Kuulkers E., Ratti E. M., van Haaften L. M., Heinke C., Özel F., Groot P. J., Verbunt F., 2011, ApJS, 194, 18
- Knigge (2006) Knigge C., 2006, MNRAS, 373, 484
- Koester et al. (2005) Koester D., Napiwotzki R., Voss B., Homeier D., Reimers D., 2005, A&A, 439, 317
- Linnell et al. (2005) Linnell A. P., Szkody P., Gänsicke B., Long K. S., Sion E. M., Hoard D. W., Hubeny I., 2005, ApJ, 624, 923
- Marsh et al. (1994) Marsh T. R., Robinson E. L., Wood J. H., 1994, MNRAS, 266, 137
- Osterbrock et al. (1996) Osterbrock D. E., Fulbright J. P., Martel A. R., Keane M. J., Trager S. C., Basri G., 1996, PASP, 108, 277
- Patterson & Raymond (1985) Patterson J., Raymond J. C., 1985, ApJ, 292, 535
- Ratti et al. (2010) Ratti E. M., Bassa C. G., Torres M. A. P., Kuiper L., Miller-Jones J. C. A., Jonker P. G., 2010, MNRAS, 408, 1866
- Schmidtobreick et al. (2012) Schmidtobreick L., Rodríguez-Gil P., Long K. S., Gänsicke B. T., Tappert C., Torres M. A. P., 2012, MNRAS, 422, 731
- Schwarz et al. (2004) Schwarz R., Schwope A. D., Staude A., Urrutia T., Rau A., Hasinger G., 2004, in Astronomical Society of the Pacific Conference Series, Vol. 315, IAU Colloq. 190: Magnetic Cataclysmic Variables, Vrielmann S., Cropper M., eds., p. 230
- Shaw (2009) Shaw R. A., 2009, NOAO Data Handbook (Version 1.1). Tucson: National Optical Astronomy Observatory
- Steeghs & Jonker (2007) Steeghs D., Jonker P. G., 2007, ApJ, 669, L85
- Stetson (1987) Stetson P. B., 1987, PASP, 99, 191
- Tauris & van den Heuvel (2006) Tauris T. M., van den Heuvel E. P. J., 2006, Formation and evolution of compact stellar X-ray sources, Cambridge University Press, pp. 623–665
- Tokunaga (2000) Tokunaga A. T., 2000, in Allen’s Astrophysical Quantities, Cox, A. N., ed., Springer-Verlag (New York), p. 143
- Torres et al. (2002) Torres M. A. P., Casares J., Martínez-Pais I. G., Charles P. A., 2002, MNRAS, 334, 233
- Wade & Horne (1988) Wade R. A., Horne K., 1988, ApJ, 324, 411
- Williams (1989) Williams R. E., 1989, AJ, 97, 1752
- Wilsey & Beaky (2009) Wilsey N. J., Beaky M. M., 2009, Society for Astronomical Sciences Annual Symposium, 28, 107