Meridional tilt of the stellar velocity ellipsoid during bar buckling instability
Abstract
The structure and evolution of the stellar velocity ellipsoid plays an important role in shaping galaxies undergoing bar driven secular evolution and the eventual formation of a boxy/peanut bulge such as present in the Milky Way. Using collisionless N-body simulations, we show that during the formation of such a boxy/peanut bulge, the meridional shear stress of stars, which can be measured by the meridional tilt of the velocity ellipsoid, reaches a characteristic peak in its time evolution. It is shown that the onset of a bar buckling instability is closely connected to the maximum meridional tilt of the stellar velocity ellipsoid. Our findings bring new insight to this complex gravitational instability of the bar which complements the buckling instability studies based on orbital models. We briefly discuss the observed diagnostics of the stellar velocity ellipsoid during such a phenomenon.
Subject headings:
galaxies: bulges – galaxies:kinematics and dynamics – galaxies: structure –galaxies:evolution – Galaxy: disk, galaxies:halos, stellar dynamics1. Introduction
Understanding the structure and dynamics of a galaxy crucially depends on the knowledge of the three dimensional stellar distribution function (DF), which is not a direct observable. The first few moments of the DF, e.g., density, mean velocity and the velocity dispersion tensor together can provide important clues regarding the dynamical state of the galaxy and the gravitational instabilities it might have undergone (van der Kruit, 1999). Of particular interest is the buckling instability of a stellar bar in a disk galaxy and the subsequent formation of a boxy/peanut bulge (Combes et al., 1990; Pfenniger & Friedli, 1991; Raha et al., 1991; Pfenniger, 1993; Athanassoula, 2005). A bar buckles under its own self-gravity when it becomes sufficiently strong, thereby bringing substantial changes in the velocity distribution of stars and the galactic potential. One possible way to quantify such a change is to study the structure and evolution of the stellar velocity ellipsoid during the buckling instability and to provide potential diagnostic observables. In particular, how is the tilt of the velocity ellipsoid related to the boxy/peanut bulge such as presented in the Milky Way (Dwek et al., 1995). This requires, however, an unambiguous identification of the buckling event that a galaxy might be experiencing. However, the onset of buckling instability is not clearly understood because it is difficult to follow the orbits of stars subject to a rapidly changing gravitational potential during the buckling. During this transient phase the dynamics is strongly collective and an orbit decomposition can only be a partial description of the process. Nevertheless, numerous simulation studies marked this event by a decrease in the bar strength or in the ratio of vertical-to-radial velocity dispersion () (Combes et al., 1990; Martinez-Valpuesta et al., 2006), providing a gross understanding of this event. Simulations show that often such demarcation is blurred and a more precise indicator of this event would be useful and complementary to the already existing ideas. It is worth re-investigating the buckling instability and the relation it might have with the orientation of the stellar velocity ellipsoid, in particular with the tilt angle.
The shape and orientation of the stellar velocity ellipsoid are tightly connected to the symmetry of the underlying galaxy potential (Lindblad, 1930; Lynden-Bell, 1962; Amendt & Cuddeford, 1991). In a stationary, axisymmetric disk galaxy the stellar velocity ellipsoid in the galactic midplane is perfectly aligned with the galactocentric coordinate axes, in other words, all the off-diagonal elements of the velocity dispersion tensor are zero (Binney & Tremaine, 1987). Thus, measuring the off-diagonal components of the dispersion tensor in observation may provide one with an inference about the presence of non-axisymmetric features in a galaxy. Away from the galactic midplane, the tilt of the velocity elliposid might depend on the mass distribution of the galactic disc as well as the flattening of the dark matter halo. In the context of the Milky Way, the analysis of the RAVE survey data release 2 (Zwitter et al, 2008) shows that the velocity ellipsoid is tilted towards the Galactic Plane (Siebert et al., 2008) and has been nicely demonstrated in a recent paper by Pasetto et al. (2012). However, the measured tilt angles can not put a strong constraint on the disc parameters and halo flattening due to large proper motion errors and small sample size in the RAVE DR2 (Siebert et al., 2008).
On the other hand, non-axisymmetric structures such as bars, spiral arms in disk galaxies might play an important role in accounting for the observed orientation of the stellar velocity ellipsoid. Numerical study by Vorobyov & Theis (2008) shows that the vertex deviation of the velocity ellipsoid is globally correlated to the amplitude of the spiral arms. Using Hipparcos data and dynamical modeling, Dehnen (2000) has shown how the Galactic Bar (Blitz & Spergel, 1991; Binney et al., 1991; Dwek et al., 1995) could have influenced the velocity distribution in the solar neighborhood. The observed low-velocity streams in the solar neighborhood are also thought to have arisen due to the Galactic Bar (Minchev et al., 2010). It would be useful to understand how the presence of a bar or spiral arms which are highly time dependent would change the orientation of the velocity ellipsoid.
We use N-body simulations to follow the evolution of the stellar velocity ellipsoid in a galaxy which undergoes bar instability and forms a boxy bulge during the secular evolution in a self-consistent way. The buckling of the bar causes the morphological evolution of the disk, converting its central parts into a boxy/peanut bulge. In order to gain further insight into the physics of bar buckling (Merrifleld, 1996; Martinez-Valpuesta & Shlosman, 2004), we investigate the role of anisotropic stellar pressure and show that there is a characteristic signature in the way the stellar velocity ellipsoid evolves. The primary goal of this paper is to understand the buckling event of a bar which forms the boxy/peanut bulge and its relation with the tilt of the stellar velocity ellipsoid.
The paper is organized as follows. In the next section, we outline the general concept of the stellar velocity ellipsoid and the relevant quantities that we measure from our simulation. Section 3 briefly describes the galaxy models used for the present study and simulation. The disk evolution and boxy bulge formation is described in section 4. The shear stress and its relation to bar buckling is shown in section 5. We discuss the tilt angle of the velocity ellipsoid in section 5.1. Finally, section 6 presents the discussion and conclusions from this work.
2. Stellar velocity ellipsoid
The components of the velocity dispersion tensor at a radial location in the stellar disk are computed from the velocity components of a group of stars using the following formula (Binney & Tremaine, 1987):
| (1) |
where and denote the velocities of a group of stars. in a cylindrical coordinate system. Angular bracket denotes the averaging over a group of stars. Given the velocity dispersion tensor, the stress tensor of the stellar fluid can be written as
| (2) |
where is the local volume density of stars at a position . It is convenient to think of the entire stress tensor as a sum of two different kinds of forces acting on a small differential imaginary surface () between two adjacent volumes of stars, i.e.,
| (3) |
where is called the normal stress acting along the normal to and are the diagonal components of the above matrix. is called the shear stress, acting along a direction perpendicular to the normal to , i.e., in the plane . In general, the shape of the velocity ellipsoid is determined by the normal stress, and the shear stress is responsible for the orientation or deformation of the ellipsoid w.r.t. the galactocentric axes (). The orientation of the velocity ellipsoid can be computed using the off-diagonal components of the velocity dispersion tensor. The meridional tilt of the velocity ellipsoid can be computed using the following relation:
| (4) |
We evaluate the shape of the velocity ellipsoid and the tilt angle in the inner region of the disk where the dynamics of stars is dominated by a bar and study their evolution as the bar enters into the non-linear regime where an analytic understanding is difficult.
| Models | |||||
|---|---|---|---|---|---|
| () | (Gyr) | ||||
| RCG051A | 1.21 | 4.75 | 0.301 | 6.52 | 0.05 |
| RHG097 | 1.84 | 3.11 | 0.306 | 7.88 | 0.43 |
| RHG057 | 2.98 | 0.86 | 0.326 | 22.53 | 0.18 |
3. Initial galaxy models
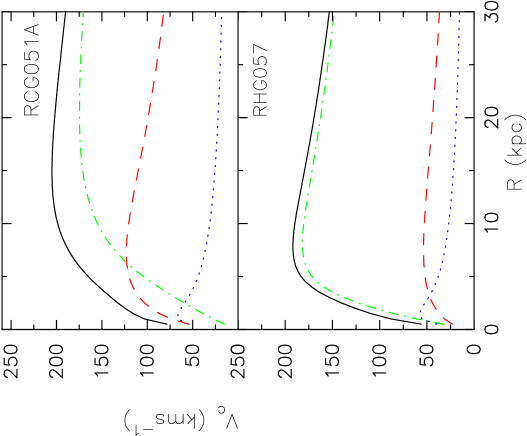
In order to study the evolution of the stellar velocity ellipsoid subject to a non-axisymmetric bar potential, we perform a large number of simulations of isolated galaxies built using the method of Kuijken & Dubinski (1995). Of these, we present here 3 fiducial models (named as RCG051A, RHG057 and RHG097) of disk galaxies with varying dark matter distribution and Toomre stability parameter (Q). The initial disk has an exponentially declining surface density with a scale length and mass . The live dark matter halo and bulge are modelled with a lowered Evans and King DF respectively. For further details on model construction, the reader is referred to Saha et al. (2010, 2012). We scale the models such that kpc and the disk masses are given in Table 1. Orbital time scales (at ) and other initial parameters are given in Table 1. In Fig. 1, we show the circular velocity curves for RCG051A and RHG057. Circular velocity curve for RHG097 can be found in Fig. 2 of Saha et al. (2010).
The simulations were performed using the Gadget code (Springel et al., 2001) which uses a variant of the leapfrog method for the time integration. The gravitational forces between the particles are calculated using the Barnes-Hut tree algorithm with a tolerance parameter . The integration time step used was Myr for RCG051A, Myr for RHG097 and Myr for RHG057. Two of these models were evolved for about Gyr, and RHG057 was evolved for about 12 Gyr to understand the long term evolution, bar growth and the asymptotic properties of the stellar velocity ellipsoid.
Each of these models were constructed using a total of million particles, out of which disk and halo have million each and million particles are assigned to the bulge. The softening lengths for disk, bulge and halo particles were chosen so that the maximum force on each particle is nearly the same (McMillan & Dehnen, 2007). In the model RHG097, the softening lengths used for the disk, bulge and halo were and pc respectively. For RCG051A, they were , and pc and for RHG057, , and pc respectively. The total energy is conserved well within 0.2% till the end of the simulation.
4. Disk evolution through bar growth
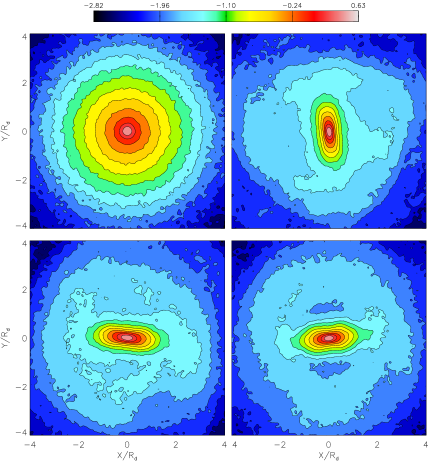
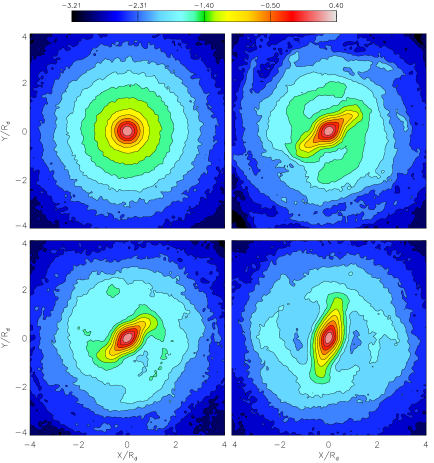
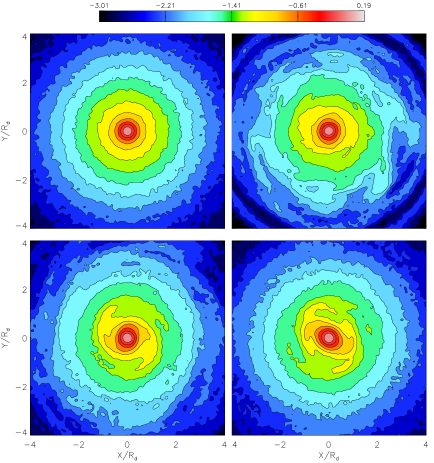
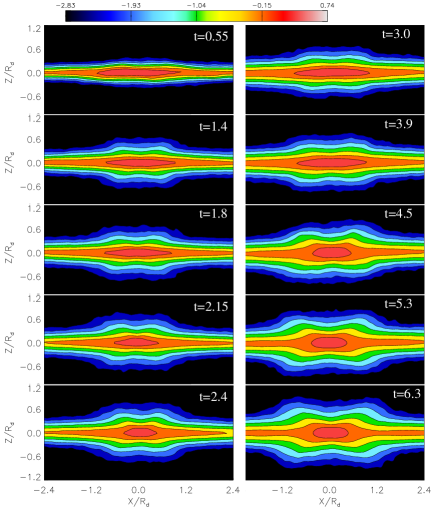
Bar driven secular evolution is an important internal process through which galaxies change their morphology and kinematics. The rapidity of such a process depends on various factors of which bar strength plays a significant role. A bar forms out of the disk instability and grows via nonlinear processes as the disk stars exchange energy and angular momentum with the surrounding dark matter halo and a preexisting classical bulge (Saha et al., 2012) through gravitational interaction. The evolution of an initially axisymmetric stellar disk and growth of a bar is depicted in Fig. 2, Fig. 3 and Fig. 4 which present the surface density maps of all the stars including that of a preexisting classical bulge.
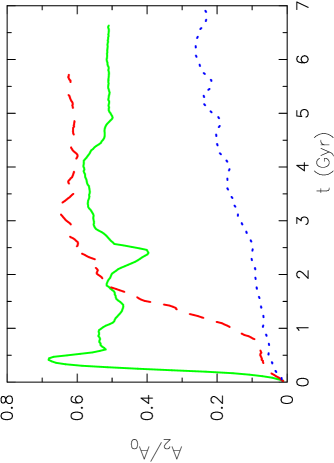
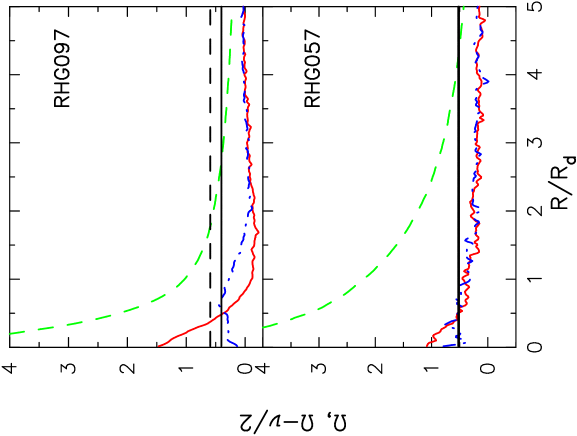
In Fig. 5, we present the time evolution of the bar amplitude measured by the Fourier component of the surface density of disk stars alone for the three fiducial models mentioned above. The growth rates of bars are significantly different in these models which also differ in the relative fraction of dark matter within the disk region. In model RHG057, the dark matter dominates the disk right from the center of the galaxy, see Fig. 1. According to the classification of Saha et al. (2010), model RHG057 forms a type-II bar and models RCG051A and RHG097 form a type-I bar. Typically, type-I bars are strong and go through the well known vertical buckling instability (Combes et al., 1990; Pfenniger & Friedli, 1991; Raha et al., 1991; Martinez-Valpuesta et al., 2006; Debattista et al., 2006) leading to the formation of a boxy/peanut (hereafter b/p) bulge as depicted in Fig. 11 and Fig. 12. Whereas type-II bars which are weak and grow on secular evolution time scale, normally do not go through any appreciable buckling instability. We evolved the model RHG057 for a Hubble time and the disk showed no signature of buckling instability, although it has grown a moderate size bar by that time. As a result, the disk in this model did not form a b/p bulge by that time. A thorough understanding of the buckling instability would perhaps require a tool combining the orbital analysis and collective effect of the stars in the disk and their role at the vertical inner Lindblad resonance (ILR). In order to pinpoint the location of the ILR, corotation resonances (CR), we first compute the disk frequencies (, , ) by a direct sum of the first and second derivatives of the -body potential obtained from the reflection symmetrized particle distribution with respect to the plane and the rotation axis. We carry out this exercise for each snapshot and compare and with the pattern speed of the bar. Fig. 6 shows the locations of the vertical ILRs and CRs at two different epochs for the two models RHG097 and RHG057. In the case of RHG097, the locations of vertical ILRs before ( Gyr) and after ( Gyr) the buckling instability are still within the bar region indicating that the orbits lie close to the vertical oscillations before and after the peanut formation. A detailed orbital analysis by Pfenniger & Friedli (1991) shows that the vertical resonance is essentially responsible for the formation of b/p bulge, but the collective behaviour of stars in the vicinity of such resonances remains obscured. For example, it is not understood what is the role of shear stress or the anisotropic stellar pressure in such a process which eventually leads to the formation of b/p bulges. Below we elaborate on the possible relation between the buckling instability and the structure and evolution of the stellar velocity ellipsoid, in particular the shear stress due to the disk stars.
5. Shear Stress and buckling instability
As the bar becomes stronger it enters into the regime of the buckling instability. This instability is highly nonlinear in the sense that the bending oscillation amplitude is not proportional to self-gravity. In the case of a bending instability, we would expect a proportionality between the bending oscillation and the imposed load (here, self-gravity). In the linear regime, a stellar disk is stable against the low order (e.g., ) bending perturbation and the self-gravity of the perturbation acts like a stabilizing agent as shown by several authors, e.g., Toomre (1966), Araki (1985), Merritt & Sellwood (1994), Sellwood (1996), Saha & Jog (2006). It is the pressure forces which destabilizes a stellar disk in response to a bending perturbation. From the works of Toomre (1966), Araki (1985) and Fridman & Poliachenko (1984), we learnt that a stellar slab of finite thickness would go bending unstable if . However, the critical value of , at which a self-consistent rotating stellar bar would go bending unstable is unclear. Actually, it is doubtful that a criterion based only on a local quantity such as would apply in a bar, as the vertical resonance is a crucial factor which reflects a non-local feature of the system: its orbital behavior. Indeed and contrary to collisional fluids, collisionless fluids may develop long range correlations which are not captured by a purely local description. The distinction between kinematic based and spatial mass distribution based instabilities in collisionless system has been presented by Pfenniger (1996, 1998). A fire-hose instability belongs to instabilities depending on a strong gradient in the velocity part of the DF, while a bar buckling instability belongs to instabilities mainly related to the presence of a strong resonance, which is determined by the spatial mass distribution.
In this section, we investigate the role played by the shear stress, in particular, the meridional component () which exerts a torque in the vertical direction on an imaginary cube of the stellar fluid.
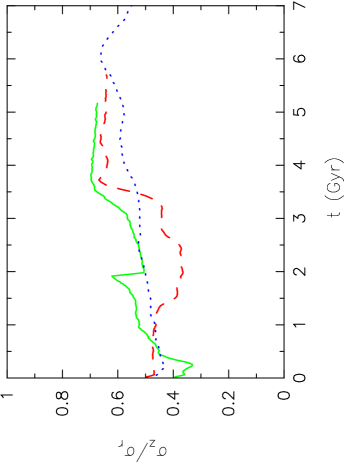
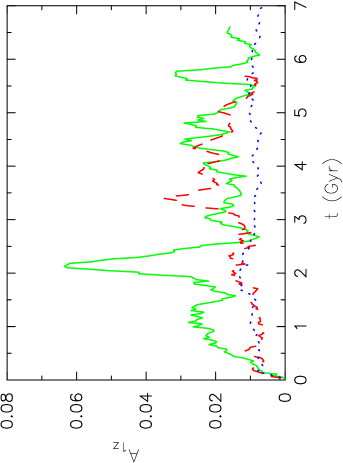
First, we quantify the buckling amplitude () by computing the Fourier component in the plane of the disk with the major axis of the bar aligned to the disk major axis and identify the buckling phase by studying the time evolution of . During the the buckling phase reaches a peak value and sometimes goes through a second buckling (Martinez-Valpuesta et al., 2006). In Fig. 7, we present the time evolution of for the three models. for RCG051A shows a strong peak at Gyr usually considered as the first buckling of the bar. It is interesting to note that the bar in this model suffers subsequent buckling of smaller amplitudes. The onset of the buckling instability can be indicated by different physical parameters, e.g., a drop in or as mentioned above. For the model RCG051A, both Fig. 5 and Fig. 8 indicate that at around Gyr, there is a drop in and respectively as found in previous studies.
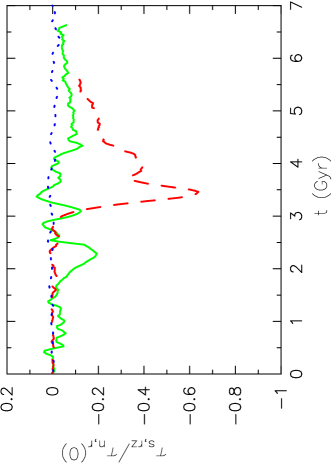
In Fig. 9, we show the time evolution of the meridional shear stress normalized by the initial normal stress defined in Eq. 3. It demonstrates clearly that the meridional stress develop slowly as the bar evolves and reaches its first peak value as the bar enters the buckling phase at about Gyr following closely the time evolution of in RCG051A. We establish, here, a new indicator of the bar buckling instability that correlates well with other indicators mentioned above in a galaxy with a cold stellar disk undergoing a rapid phase of bar growth (here, RCG051A). Let us now examine the other two models where the bar growth rate is rather slow in comparison to RCG051A.
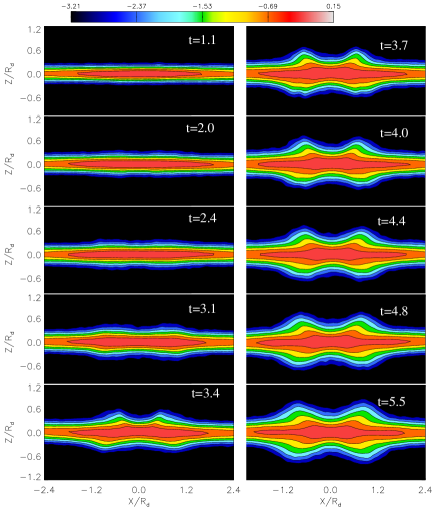
In model RHG097, the peak in (see Fig. 7) coincides with that in the meridional stress shown in Fig. 9 at around Gyr. However, the drop in occurs noticeably earlier at around Gyr, when no buckling event was found from the time evolution of as well as from the visual inspection of the surface density maps in edge-on projection (see Fig. 12). It is evident that a drop in is not an unambiguous indicator of the buckling event of strong bars, whereas the meridional stress is promising in indicating the onset of buckling instability.
On the other hand, for a dark matter dominated radially hot stellar disk as in model RHG057, the bar grows on a much slower rate (see Fig. 5) and shows no peak in (see Fig. 7). Also Fig. 8 shows no appreciable drop in except at around Gyr where a smooth decrease in is apparent. The meridional stress remains nearly flat and close to zero for this galaxy model which has been evolved for about 12 Gyr during which no buckling event was detected.
As the bar evolves through the buckling phase, the disk midplane also responds and exhibits a characteristic buckling mode. We compute the location of the disk midplane using the following formula to follow the buckling:
| (5) |
where is the volume density distribution of stars. Since the meridional shear stress for the model RHG097 was comparatively high, the disk midplane was expected to show noticeable bending. We discuss here only the case of RHG097 and mention briefly the other models.
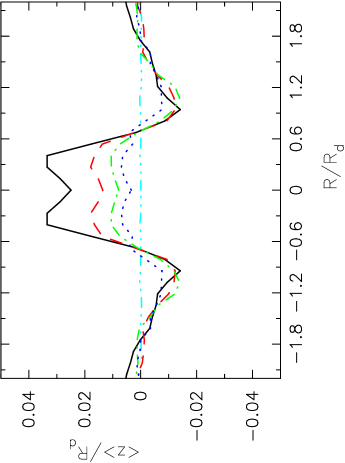
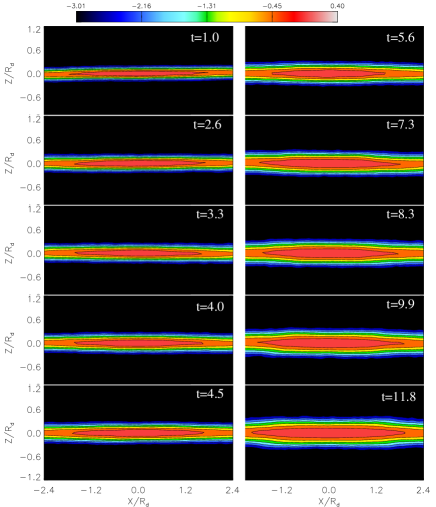
Initially, the disk midplane remains flat at as shown in Fig. 10 for the model RHG097. At Gyrs, the midplane reaches its peak value pc. Subsequently, the -amplitude decreases to nearly zero at around Gyrs restoring the symmetry along the vertical direction. The buckling modes of the bar in this model have characteristic nodes at and (see Fig. 10). Comparing with Fig. 6, we find that the location of the second node is close to the corotation of the bar. The time evolution of the -amplitude indicates that the buckling instability is a sudden event in the galaxy evolution.
The model RCG051A also showed similar behaviour in the -amplitude. But the -amplitude in model RHG057 remained close to zero at all times.
5.1. Meridional tilt of the velocity ellipsoid
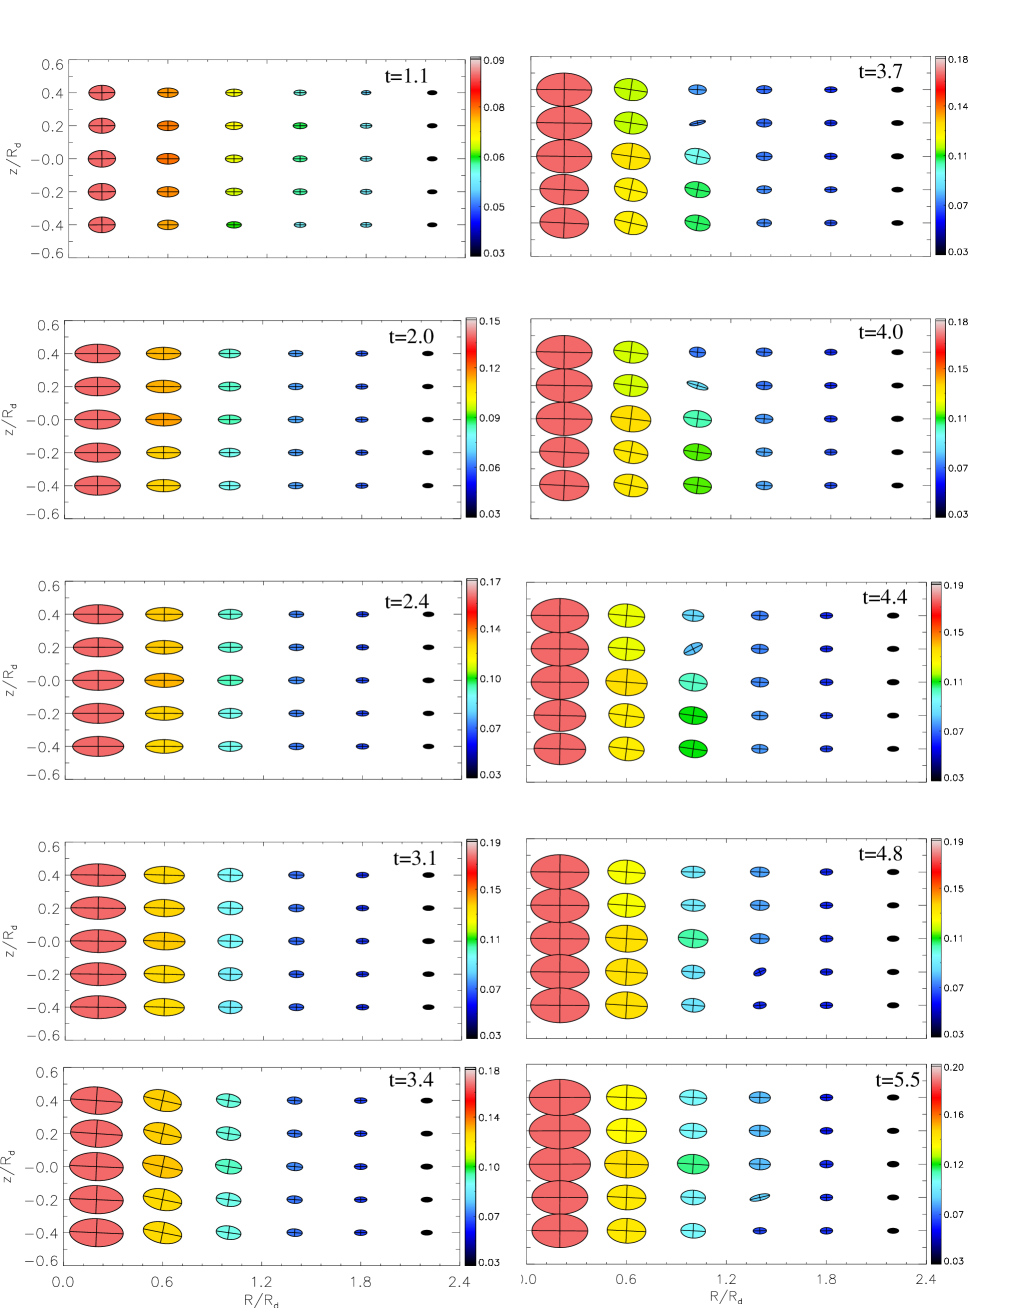
In this section, we discuss the orientation of the stellar velocity ellipsoid in the meridional plane ( plane) of the galactic disk. Since the buckling instability creates an asymmetry in the vertical density distribution and assuming it preserves reflection symmetry with respect to the galactic centre, we consider only one half of the meridional plane for the computation of the stellar velocity ellipsoid. When the bar has formed, we rotate it so that its major axis is perpendicular to the line-of-sight; in other words, the tilt is calculated in the meridional plane containing the bar major axis. In edge-on projection, the meridional plane would closely resemble the surface density maps shown, for example, in Fig. 12. In order to understand the spatio-temporal variation of the stellar velocity ellipsoid in a model galaxy, we further subdivide the entire meridional plane into several small cells each of which contain sufficient number of particles for reasonable estimate of the velocity dispersion and the meridional tilt. The cell sizes are fixed at in radius and . The number of particles in each of these cells vary over time as they are subject to mixing and migration driven by the combined effect of an evolving bar and spiral structures in the disk (Minchev & Famaey, 2010). To give an idea of the number of particles used, the cell at and contains about particles and the innermost cells have about particles at Gyr for the model RHG097 (for reference see Fig. 14).
Fig. 14 depicts the spatio-temporal variation of the velocity ellipsoid in the meridional plane of the galaxy model RHG097. Initially, the velocity ellipsoid in the disk are all aligned with the galactocentric coordinate axes and the same holds true for a period of about Gyr when the bar has fully developed in the disk, see Fig. 3. At Gyr, the bar undergoes a sudden buckling instability and the meridional tilt of the velocity ellipsoid reaches a peak value as can be seen from the corresponding panel in Fig. 14. Note that the maximum of the tilt occurs at the first node of the buckled bar (see Fig. 10) which roughly coincides with the edge of the peanut shape in this model (see Fig. 12). In general, higher values of tilt angle can be found in the b/p region away from the minor axis of the galaxy during the buckling phase. It is interesting to notice the spontaneous symmetry breaking in the shape distribution of the velocity ellipsoid in the meridional plane about the midplane of the galaxy just after the peak of the buckling phase. Such asymmetry continues to persist for about Gyr since the onset of buckling instability, during which the density distribution is also asymmetric about the midplane (see, Fig. 12). After the peak of the buckling phase, the tilt angle of the velocity ellipsoid gradually decreases to a low value during the subsequent evolution of the galaxy, restoring symmetry both in the shape distribution of the velocity ellipsoid and the mass density about the midplane.
Note that, the velocity ellipsoid near the minor axis of the galaxy remains nearly aligned with the galactocentric coordinate axes before the onset of buckling instability and at later times. Although not shown explicitly here, the meridional tilt angle of the velocity ellipsoid along the minor axis of the galaxy remains zero at all times during the galaxy evolution. The meridional tilt of the velocity ellipsoid outside the b/p region is nearly unaffected by the buckling instability. As shown clearly in Fig. 14 (see panel at Gyr), the meridional tilt angle is nearly zero for galaxies which host a bar that did not go through a buckling instability. From Fig. 14, it is clear that the size of the velocity ellipsoid near the minor axis nearly doubles at times when buckling instability is at its maximum and their sizes continue to increase. Since the semi-major axis of the velocity ellisoid actually measures the radial velocity dispersion, it shows clear indication of heating in the whole b/p region of the galaxy model.
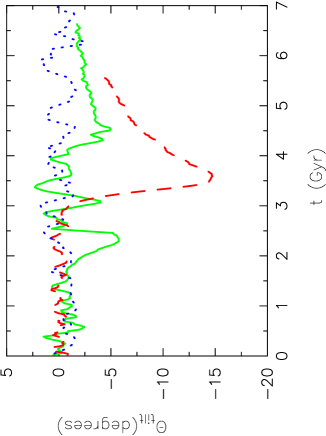
Fig. 15 shows the time evolution of the average meridional tilt angle () of the velocity ellipsoid computed in the b/p region for all the models. In both models RHG097 and RCG051A, the meridional tilt angle rises to a peak value during the buckling instability phase. On the other hand, the tilt angle scatters around zero for the model RHG057 at all times. From the time evolution, a large value of the tilt angle is a characteristic signature of the buckling phase that these model galaxies might have undergone. In other words, findings of a large value of the tilt angle in the b/p region of a galaxy would indicate that it might be in the buckling phase or near the vicinity of the buckling instability. The subsequent evolution of the buckling instability in model RHG097 is particularly interesting because of the gradual decrement of the tilt angle. It takes about Gyr for the meridional tilt angle to fall by half its peak value and can be considered as the half-life of the buckling phase () the galaxy has experienced. We find that , where is the orbital time at the disk half-mass radius (for this model), which is quite short compared to the galaxy’s lifetime. This might be the reason for the difficulty in observing galaxies in the buckling phase. However, may depend on various parameters of the galaxy models and a thorough search of the parameter space is required to find an optimal galaxy model which would show large values of tilt angle over long periods of time. The dependence of on the dark halo and bulge properties will be considered in a future paper.
5.2. Second moment of DF
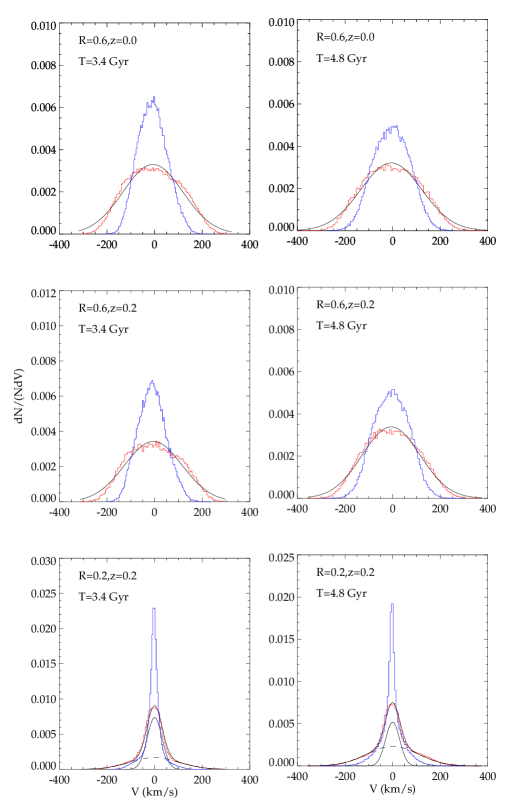
The calculation of the stellar velocity ellipsoid assumes that the moment integrals of the DF exist and returns a finite value. However, the validity of such an assumption is questionable, especially when the stellar system is undergoing an unstable phase e.g., buckling instability in the present case. The resonant parts of the phase space during such an instability can develop bi-modal and/or particle distribution with long tail for which the very notion of first or second moment of the DF is mathematically no longer meaningful. Bimodal velocity distribution has been observed for late-type stars in the solar neighborhood by Hipparcos and numerical models of disk response to a bar is shown to have reproduced many such features in the local velocity distribution (Dehnen, 2000; Fux, 2001; Minchev et al., 2010). In Fig. 16, we show the normalized histograms for radial () and vertical () velocities in the model RHG097 during and after the buckling instability nearly disappeared. We picked up three different regions in the meridional plane and histograms, in the two regions ( and ) where the meridional tilt was maximum, are fairly well represented by a single Gaussian DF with different variances. In the region close to the minor axis of the galaxy i.e., , the radial velocity histograms needed two Gaussian DFs: one with cold component with dispersion kms-1 and one with a hot component with a dispersion kms-1. A close inspection of Fig. 14 indicates that the stars are heated strongly in that region as it is clear from the size of the ellipsoids. At the time of buckling, the size of the ellipsoid nearly doubles indicating an increase in the velocity dispersion by a factor of two. In any case, in all the regions examined, we have a unimodal DF to represent the stars in the meridional plane and they show well behaved first and second moments.
6. Discussion and conclusions
The buckling instability is one of the routes through which an initially axisymmetric stellar disk would form a boxy/peanut bulge such as present in our own Galaxy. In order to understand the formation of such a boxy/peanut morphology, it is important to have further insight on the buckling instability. How and when would a bar go buckling unstable? How many buckling events has a present day galaxy experienced? How does it depend on the dark matter fraction in galaxies? There are several issues needed to be addressed in order to grasp this phenomenon. The current paper addresses one such issue on the onset of a buckling event in a disk galaxy. It is shown that there is a connection between the onset of the buckling instability and the shear stress of stars. We see that the shear stress reaches its peak value during the buckling phase and then decreases gradually. The development of a shear stress in the stars is a result of collective process in the disk. If these stars are also trapped in the vertical ILRs, this would eventually lead to the buckling instability (Pfenniger & Friedli, 1991; Quillen, 2002).
From our study, it is clear that a bar that grows very slowly, on a several Gyr time scale, does neither develop any appreciable shear stress nor go through any buckling instability. On the other hand, bars that grow very rapidly such as in RCG051A, develop both, shear stress and buckling instability. In no cases that we have studied does a shear stress develop in the bar and not go through the buckling instability. One emerging scenario is that the development of shear stress is related to the rate at which a bar grows i.e., the rate at which a bar strength grows through transport of angular momentum outward. In galaxy models with higher values of Toomre , the growth of bar strength is rather slow leading to weak bar and insignificant amount of shear stress.
Several important kinematical changes occur in the galaxy during and after the episode of the buckling instability. From the Fig. 14, it is clear that the stars are heated in the b/p region, especially close to the minor axis of the galaxy, by a factor of during the buckling instability. This was shown previously by Saha et al. (2010) for model RHG097 and others. Another interesting aspect is the kinematical changes in the vertical structure of the galaxy. Note, the stellar disk is isothermal initially (see the first panel at Gyr in Fig. 14). In the after-episode of the buckling phase, there is a clear distinction in the velocity dispersion above and below the disk midplane indicating spontaneous breaking of isothermal structure in the b/p region. Such non-isothermal vertical structure in the b/p region is persistent long after the buckling phase. We will address this issue in more detail in a future paper.
Our main conclusions from this work are as follows:
1. We show that the meridional tilt of the stellar velocity ellipsoid is a better indicator compared to a drop in the bar amplitude or for the onset of the buckling instability of a stellar bar in a disk galaxy. During the buckling event, the tilt angle reaches a peak value followed by a gradual decrease. Outside the buckling episode, the tilt angle is nearly zero. The meridional shear stress of stars and the onset of the buckling instability of a stellar bar is closely connected.
2. A large value of the tilt angle of the stellar velocity ellipsoid in the b/p region indicates the occurrence of a buckling event in the galaxy. The meridional tilt angle of the velocity ellipsoid remains close to zero if the bar does not experience the buckling phase.
3. Disk galaxies that are radially hot and highly dominated by the dark matter halo might not have gone through a buckling instability. Buckling instability appears to depend on the growth rate of bar strength.
4. Buckling instability changes the vertical structure and kinematics in the boxy/peanut region of the galaxy, in particular it changes vertical structure from isothermal to non-isothermal in one of our models.
Acknowledgement
The simulations presented in this paper were carried out on the computer cluster system of ASIAA. This work was supported, in part, by the Theoretical Institute for Advanced Research in Astrophysics operated under the ASIAA. K.S. acknowledges support from the Alexander von Humboldt Foundation. D.P. acknowledges support from the Swiss National Science Foundation. The authors thank the anonymous referee for insightful comments on the manuscript.
References
- Amendt & Cuddeford (1991) Amendt, P., & Cuddeford, P. 1991, ApJ, 368, 79
- Araki (1985) Araki, S. 1985, PhD thesis, MIT.
- Athanassoula (2005) Athanassoula, E. 2005, MNRAS, 358, 1477
- Binney et al. (1991) Binney, J., Gerhard, O. E., Stark, A. A., Bally, J., & Uchida, K. I. 1991, MNRAS, 252, 210
- Binney & Tremaine (1987) Binney, J., & Tremaine, S. 1987, Galactic dynamics
- Blitz & Spergel (1991) Blitz, L., & Spergel, D. N. 1991, ApJ, 379, 631
- Combes et al. (1990) Combes, F., Debbasch, F., Friedli, D., & Pfenniger, D. 1990, A&A, 233, 82
- Debattista et al. (2006) Debattista, V. P., Mayer, L., Carollo, C. M., et al. 2006, ApJ, 645, 209
- Dehnen (2000) Dehnen, W. 2000, AJ, 119, 800
- Dwek et al. (1995) Dwek, E., Arendt, R. G., Hauser, M. G., et al. 1995, ApJ, 445, 716
- Fridman & Poliachenko (1984) Fridman, A. M., & Poliachenko, V. L. 1984, Physics of gravitating systems. II - Nonlinear collective processes..etc.
- Fux (2001) Fux, R. 2001, A&A, 373, 511
- Kuijken & Dubinski (1995) Kuijken, K., & Dubinski, J. 1995, MNRAS, 277, 1341
- Lindblad (1930) Lindblad, B. 1930, MNRAS, 90, 503
- Lynden-Bell (1962) Lynden-Bell, D. 1962, MNRAS, 124, 95
- Martinez-Valpuesta & Shlosman (2004) Martinez-Valpuesta, I., & Shlosman, I. 2004, ApJ, 613, L29
- Martinez-Valpuesta et al. (2006) Martinez-Valpuesta, I., Shlosman, I., & Heller, C. 2006, ApJ, 637, 214
- McMillan & Dehnen (2007) McMillan, P. J., & Dehnen, W. 2007, MNRAS, 378, 541
- Merrifleld (1996) Merrifleld, M. R. 1996, in Astronomical Society of the Pacific Conference Series, Vol. 91, IAU Colloq. 157: Barred Galaxies, ed. R. Buta, D. A. Crocker, & B. G. Elmegreen, 179
- Merritt & Sellwood (1994) Merritt, D., & Sellwood, J. A. 1994, ApJ, 425, 551
- Minchev et al. (2010) Minchev, I., Boily, C., Siebert, A., & Bienayme, O. 2010, MNRAS, 407, 2122
- Minchev & Famaey (2010) Minchev, I., & Famaey, B. 2010, ApJ, 722, 112
- Pasetto et al. (2012) Pasetto, S., Grebel, E. K., Zwitter, T., et al. 2012, ArXiv e-prints
- Pfenniger (1993) Pfenniger, D. 1993, in IAU Symposium, Vol. 153, Galactic Bulges, ed. H. Dejonghe & H. J. Habing, 387
- Pfenniger (1996) Pfenniger, D. 1996, in Astronomical Society of the Pacific Conference Series, Vol. 91, IAU Colloq. 157: Barred Galaxies, ed. R. Buta, D. A. Crocker, & B. G. Elmegreen, 273
- Pfenniger (1998) Pfenniger, D. 1998, CeMDA, 72, 37
- Pfenniger & Friedli (1991) Pfenniger, D., & Friedli, D. 1991, A&A, 252, 75
- Quillen (2002) Quillen, A. C. 2002, AJ, 124, 722
- Raha et al. (1991) Raha, N., Sellwood, J. A., James, R. A., & Kahn, F. D. 1991, Nature, 352, 411
- Saha & Jog (2006) Saha, K., & Jog, C. J. 2006, A&A, 446, 897
- Saha et al. (2012) Saha, K., Martinez-Valpuesta, I., & Gerhard, O. 2012, MNRAS, 421, 333
- Saha et al. (2010) Saha, K., Tseng, Y., & Taam, R. E. 2010, ApJ, 721, 1878
- Sellwood (1996) Sellwood, J. A. 1996, ApJ, 473, 733
- Siebert et al. (2008) Siebert, A., Bienaymé, O., Binney, J., et al. 2008, MNRAS, 391, 793
- Springel et al. (2001) Springel, V., Yoshida, N., & White, S. D. M. 2001, NewA, 6, 79
- van der Kruit (1999) van der Kruit, P. C. 1999, Ap&SS, 269, 139
- Vorobyov & Theis (2008) Vorobyov, E. I., & Theis, C. 2008, MNRAS, 383, 817
- Zwitter et al (2008) Zwitter et al. 2008, AJ, 136, 421