THE BALDWIN EFFECT IN THE NARROW EMISSION LINES OF AGNS
Abstract
The anti-correlations between the equivalent widths of emission lines and the continuum luminosity in AGNs, known as the Baldwin effect are well established for broad lines, but are less well studied for narrow lines. In this paper we explore the Baldwin effect of narrow emission lines over a wide range of ionization levels and critical densities using a large sample of broad-line, radio-quiet AGNs taken from Sloan Digital Sky Survey (SDSS) Data Release 4. These type1 AGNs span three orders of magnitude in continuum luminosity. We show that most narrow lines show a similar Baldwin effect slope of about -0.2 while the significant deviations of the slopes for [N II] 6583, [O II] 3727, [Ne V] 3425 , and the narrow component of H can be explained by the influence of metallicity, star-formation contamination and possibly by difference in the shape of the UV-optical continuum. The slopes do not show any correlation with either the ionization potential or the critical density. We show that a combination of 50% variations in continuum near 5100Å and a log-normal distribution of observed luminosity can naturally reproduce a constant Baldwin effect slope of -0.2 for all narrow lines. The variations of the continuum could be due to variability, intrinsic anisotropic emission, or an inclination effect.
Subject headings:
galaxies: active–galaxies:Seyfert–(galaxies:) quasars: emission lines1. Introduction
The anti-correlation between the equivalent widths of broad emission lines and AGN luminosity (the “Baldwin effect”; hereinafter BE) was first discovered by Baldwin (1977) for the C IV 1549 broad emission line in high redshift AGNs. It was initially hoped to be able to use the effect to calibrate the AGN luminosity to be able to use AGNs as cosmological standard candles (Baldwin et al. 1978), but the large dispersion of this relationship rendered this impossible (Baldwin et al. 1989; Zamorani et al. 1992). The BE is now well established for nearly all broad emission lines and the slope of the BE steepens with increasing ionization potential (Zheng & Malkan 1993; Dietrich et al. 2002). Several mechanisms have been proposed to explain this effect (See Shields 2007 for a review). Among these perhaps the most widely accepted one is that the ionizing continuum softens with increasing luminosity so there are relatively fewer ionizing photons for broad emission line formation in high-luminosity AGNs. This model can reproduce the ionization energy–BE slope relationship fairly well (Korista et al. 1998) and the assumption has observational support (Binette et al. 1989; Zheng & Malkan 1993; Wang & Lu 1998; Korista et al. 1998). Some theoretical models (Netzer 1985, 1987; Netzer, Laor, & Gondhalekar 1992; Wandel 1999a,b) could produce a softer ionizing spectrum in high-luminosity sources, but the standard thin disc model (Shakura & Sunyaev 1973) they adopt suffers from many problems (Antonucci 2002; Gaskell & Klimek 2003; Gaskell 2008; Lawrence 2012; Antonucci 2012). In this sense, the explanation of broad line BE is still elusive and controversial. An outlier of the ionization energy–BE slope relationship is N V 1240, which has an ionization energy of 97.7eV but shows no BE at all (Dietrich et al. 2002). It has been proposed that this can be explained by a dependence of metallicity on AGN luminosity, which in turn is a combination of Eddington ratio () and black hole mass (Korista et al. 1998; Hamann & Ferland 1993, 1999; Dietrich et al. 1999; Dietrich & Wilhelm-Erkens 2000). In local galaxies, gas metallicity correlates well with the mass of galaxies (Tremonti et al. 2004), and more massive galaxies have larger black hole masses () according to the - relationship. For Type1 AGN population, the brighter AGNs would have higher on average (Kollmeier et al. 2006; Steinhardt & Elvis 2010a,b; Lusso et al. 2012) and thus higher metallicities. Recent studies of the BE for C IV, Mg II and Fe II, however, challenge this picture by showing that the BE might instead be driven by the EW’s correlation with Eddington ratio (Baskin & Laor 2004; Bachev et al. 2004; Warner, Hamann & Dietrich 2004; Zhou et al. 2006; Dong et al. 2009a,b) or with (Netzer, Laor & Gondhalekar 1992; Wandel, Peterson & Malkan 1999; Shields 2007; Kovacevic et al. 2011).
The BE of narrow emission lines is much less well studied, and some results are still controversial. Steiner (1981) discovered a strong BE for [O III] 5007 (especially in AGNS with strong optical Fe II) and Wills et al. (1993) found the narrow lines in high-luminosity AGNs are very weak. Meanwhile, Croom et al. (2002) found a significant BE for [Ne V] 3425 and [O II] 3727 but obtained a null result for [Ne III] 3870 and [O III] 5007 using the 2dF sample. Subsequent work shows, however, that [O III] 5007 does show a BE (Dietrich et al. 2002, Netzer et al. 2004). Hönig et al. (2008) and Keremedjiev et al. (2009), used Spitzer data to find that the BEs of different mid-IR narrow emission lines have a nearly constant slope. Several mechanisms have been proposed to explain the NLR BE. NLRs follow a size–luminosity relationship (Schmitt et al. 2003b; Bennert et al. 2002; Greene et al. 2011). The size of the NLR may grow beyond the size of the host galaxy in high-luminosity AGNs, thus turning from ionization-bounded to matter-bounded, and so producing the BE (Croom et al. 2002). As the EW is proportional to the covering factor (CF) and it is found that the CF contributes to much of the variance of the EW (Baskin & Laor 2005), a luminosity- dependent CF is also a possible cause of the BE (Shields et al. 1995; Stern & Laor 2012b; Stern & Laor 2012c). It has recently been proposed that the EW of narrow emission lines is dependent on the inclination to the accretion disc (Risaliti et al. 2011), at least in the highest EW sources. In principle, this is a potential cause of the BE too.
To make progress in understanding the NLR BE, we need to measure narrow emission lines of a wide range of ionization potentials and critical densities, and determine the nature of their BEs more accurately. In this paper, we use a well-defined sample drawn from SDSS DR4 and employ the technique of composite spectra to investigate the BE for prominent narrow emission lines in the optical band and to study the origin of the NLR BE. We use a cosmology with = 70 km s-1 Mpc-1, = 0.3, and = 0.7 throughout this paper.
2. Sample and Measurements
2.1. Sample
We need accurate emission line and continuum measurements to ensure reliable determinations of equivalent widths and continuum luminosities. From the spectral data set of the Sloan Digital Sky Survey Fourth Data Release (Adelman-McCarthy et al. 2006), we have selected 4178 Seyfert 1 galaxies and quasars (i.e., type 1 AGNs) as described in Dong et al. (2011). We apply a redshift cutoff of 0.8 so that the redshift of the spectrum can be accurately determined using [O III] 5007. To ensure high-quality spectra we require a median signal-to-noise ratio (S/N) of per pixel in the optical. To minimize the host-galaxy contamination (see the Appendix of Dong et al. 2011), we restrict the weak stellar absorption features, such that the rest-frame EWs of Ca K (3934 Å), Ca H + H (3970 Å), and H (4102 Å) absorption features are undetected at significance. This criterion ensures that the host contamination is less than 10% around 4200Å(Dong et al. 2011). One may note that Dong et al. (2011) do not consider very young stellar population (i.e., emission line galaxies). But previous analysis have shown that in massive galaxies, the optical continuum is not dominated by very young stellar population although the UV continuum may be (Schawinski et al. 2007). After removing duplications and sources with too many bad pixels in the H + [O III] region, we obtain 4178 type 1 AGNs. Including radio-loud AGNs may influence the measurement of EW of emission thus produce false effect for two reasons: firstly, the jet may interact with the ISM to enhance the narrow line emission (Labiano et al. 2007) and secondly, it might also enhance the continuum through beaming if the jet points close to our line of sight. By matching with the FIRST catalog (Becker et al. 1995) using the method of Lu et al. (2010), we reject 499 radio-loud AGNs so that our final sample consists of 3677 sources.
2.2. Spectral fitting and measurements
We give a brief description of our spectrum fitting process here; the details can be found in Dong et al. (2011). To model the spectrum, we used a code based on the MPFIT package (Markwardt 2009) and fit the AGN featureless continuum, the Fe II multiplets, and other emission lines simultaneously. The AGN continuum is represented locally by a power-law, for the region of 4200–5600 Å and for the H region (if present). The Fe II template by Véron-Cetty et al. (2004) that we use, is constructed using the identification and measurement of Fe II lines in I Zw 1. It has two separate sets of templates in analytical forms, one for the broad-line system and the other for the narrow-line system. Within each system, the relative velocity shifts and relative strength are assumed to be the same as those in I Zw 1. Broad Fe II lines share the same profile as broad H, while each narrow Fe II lines is modeled with a Gaussian. During the fitting, the normalization and redshift of each system are taken as free parameters. The broad Balmer lines are fitted with as many Gaussians as is statistically justified. All narrow emission lines, except for the [O III] 4959, 5007 doublet lines, are fitted with a single Gaussian. Each line of the [O III] doublet is modeled with two Gaussians, one accounting for the line core and the other for a possible blue wing, as seen in many objects. Since the sources in our sample do not suffer from significant host galaxy contamination, we do not apply starlight corrections to individual spectra. For each source, we use and FWHM of broad H line to obtain the using the virial mass estimates by the Dibai method (Dibai 1977) using the formalism of Wang et al. (2009). The typical statistical scatter about the obtained by reverberation-mapping is about 0.4 dex, and it may also be subject to more systematic errors. (Krolik 2001; Collin et al. 2006; Shen et al. 2008; Fine et al. 2008; Marconi et al. 2008; Denney et al. 2009; Rafiee & Hall 2011a; Steinhardt 2011). The error of is of similar magnitude as that of .
2.3. Composite Spectra Generating and Fitting
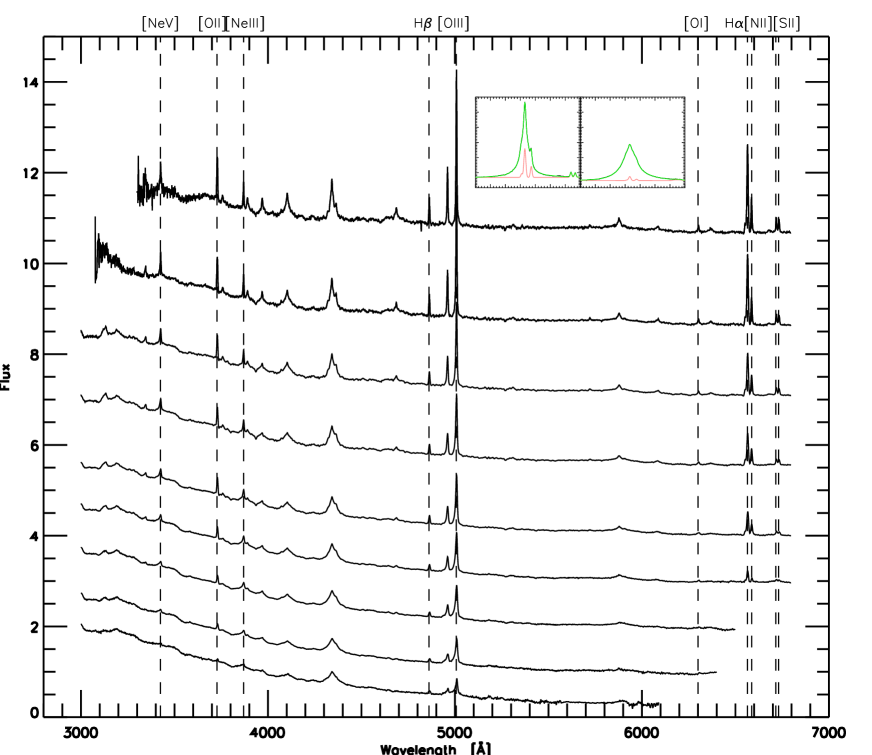
A convenient way to explore the correlations between EWs and other parameters like luminosity is to make composite spectra for different parameter bins. We normalize individual spectrum to the mean flux around 4200Å and then construct the geometric composite as Vanden Berk et al. (2001). To get an accurate continuum measurement, we need to subtract the broad emission lines, especially, H and H and Fe II emission from the spectrum. For the broad component of H and Fe II we subtract them from the original spectrum; but for the broad component of H, we leave it un-subtracted when making composite spectra. This is because the broad H is highly blended with [N II] 6583 and [N II] 6548, so deblending in individual spectrum is not reliable while deconvolving the blends in the high SN composite spectrum is easier. The fitting algorithm used to model the composite spectrum is the same as described in Section 2.2. More specifically, we fit the blends using one gaussian for the narrow component of H, [N II] 6583 and [N II] 6548, two gaussians for [S II] 6717, 6731 and three for H. The broad-line-subtracted spectra are shown in Fig. 1. The embedded panels show the fitting result for the H+ [N II] blends.
3. Results
3.1. The Baldwin effect for different lines
First, we want to explore if the BE exists in the prominent narrow lines [Ne V] 3425 , [O II] 3727, [Ne III] 3870 , H, [O III] 5007, [O I]6300, H, [N II] 6583 and [S II] 6717, 6731. Measuring narrow lines in individual spectrum are subject to the SN limit and the EW- relation of all our lines shows a large dispersion (typical 0.2 dex, this can be seen clearly in the middle panel of Fig. 4), so we turn to composite spectra for reliable measurements. We divide our sample into intervals of 0.3 dex in luminosity starting at log = 43.2 to 45.9 . and make a composite spectrum in each luminosity bin as described in Section 2.3. From Fig.1 we can see two clear and remarkable results:
-
•
With increasing luminosity, the narrow lines vanish.
-
•
The slope of the observed continuum become bluer with increasing luminosity.
To see the dependencies of the EWs on the luminosity more clearly, in Fig. 2 we plot the log EW that derived from composite spectra for each luminosity bin for each of the lines listed above against log in order to get more qualitative results. For each line, we show a weighted linear regression of the logarithm of the EW on the logarithm of the luminosity and we list all the BE slopes of the narrow emission lines together with their ionization energies and critical densities in Table.1. When fitting the relationship, we add an error to each data point that would help to reduce the normalized to 1. These added errors are the same for individual narrow line, and they account for the potential other systematic errors. The BE slopes of the high-ionization lines [Ne III] 3870 and [Ne V] 3425 are , respectively which are consistent with the results of Keremedjiev et al. (2009) who obtained , and respectively for the Ne III 15.56m, and Ne V 14.32m lines. Our [O III] 5007 BE slope of is similar to the values of found by Kovacevic et al. (2011) and steeper than the found by Dietrich et al. (2002). The difference might be due to different sample we employ. The error of slopes we give here include only the statistic error of the fitting, but do not include the measuring error and intrinsic dispersion of the EW, which may reach 0.2 dex typically.
In addition to finding the BE in high-ionization lines, we also find the BE in the low-ionization lines of [O I]6300 [S II] 6717, 6731 and [O II] 3727. The narrow recombination line: H also shows a BE with a similar slope as for the forbidden lines. For comparison, the broad H line shows an inverse BE with a slope of 0.16 for our sample. This is consistent with Greene & Ho (2005) and Croom et al. (2002) who reported and respectively. We can see in Fig. 2 that the EW of the narrow component of H increases with luminosity too. These indicate that the behaviors of broad lines and narrow lines are different.
The correlation coefficients between EW([O III]) and , z, , are -0.12, -0.05, -0.01, -0.21, respectively. These are similar to the results in Zhang et al. (2011). For our flux-limited sample, the redshift, luminosity, black hole mass, and Eddington ratio are correlated with each other. The correlation coefficients between and , , are 0.81, 0.67, 0.15 respectively. After controlling for or in a partial correlation analysis, EW([O III]) correlates with with =-0.14 and -0.16. This indicates that the BE of narrow lines is not a secondary effect of correlations between the EW and redshift or but an independent phenomenon. We note that as the correlation strength is not strong, one possibility is that there are other factors that regulate the EW as discussed in Zhang et al. (2011). Also, measurement error in EW([O III]) may act to smear the correlation. The measurement error could be introduced by limited SN and fitting process. In spite of these uncertainties, the BE of narrow lines does exist and may shed light on physical process in AGNs as explored in detail below.
3.2. The ionization energy – BE slope relationship: no correlation
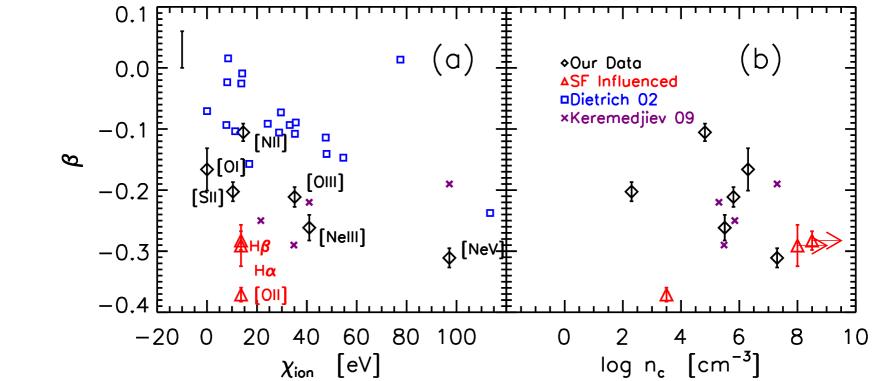
A dependence of the BE slope on ionization energy is found for broad emission lines in AGNs (see introduction) and this is the most compelling evidence for a luminosity-dependent ionizing spectrum. The NLR lies far from the nucleus, has a complex geometry and may contain dust (Netzer & Laor 1993; Tomono et al. 2001; Radomski et al. 2003; Schweitzer et al. 2008). This makes the response of the narrow-line flux to changes in the SED complicated. We plot the slope of BE against the ionization energies of the narrow lines in the left panel of Fig. 3. We also plot the Keremedjiev et al. (2009) data for [SIV] 10.51m:, [Ne II] 12.81m:, [Ne III] 15.56m: and [Ne V] 14.32m: in purple crosses and the broad-line BE from Dietrich et al. (2002) in blue rectangles for comparison. We can see that the narrow-line BE slopes do not correlate with the ionization-energy ( meaning the two-sided probability that a correlation is not present is 78%.) but cluster around -0.2 with a dispersion of . [N II] 6583, H and [O II] 3727 have slopes of , , and so they deviate from -0.2 significantly. Possible reasons for this are discussed in Section 4.1.
3.3. Critical Density – Slope relationship: No correlation
It is well known that the NLR is stratified that the high-ionization lines rise from the inner part of the NLR while low-ionization lines rise further away (see, for example, Veilleux et al. 1991; Robinson et al. 1994; Bennert et al. 2006a,b; Kraemer et al. 2009). The central electron temperature, density, and ionization parameter are, in general, higher in Seyfert 1s than in Seyfert 2s (Gaskell 1984; Schmitt 1998; Bennert et al. 2006b). The lines of lower critical density are not as strong near the nuclei as the higher critical density lines. A possible explanation of this is that the change in critical density marks a transition between difference types of clouds. To see if this is a factor in the NLR BE we therefore plot the EWs against critical density in the right panel of Fig. 2 using the same symbols of panel (a). We again fail to find any correlation in this plot ( using a Spearman rank correlation analysis).
4. Discussions
Using our sample of 3677 radio-quiet AGNs from SDSS DR4 that have little contamination by host galaxy, we find that, in contrast with the BE of broad emission lines, the narrow lines show a nearly constant BE slope irrespective of ionization potential or critical density. The [O II] 3727, [N II] 6583 and H lines show significantly different BE slopes from other lines.
4.1. Deviation from constant BE slope
Although the slope of different lines cluster around -0.2, we do find some lines that show large deviations.
Firstly, [N II] 6583 show a much flatter slope () than other lines ( 5% in two-sided KS test, meaning if the two samples are drawn from the same distribution, we expect to see a difference as large or larger than we see here only 5 in 100 times.). This flattening was also found for N V 1240, which has an ionization potential of 77.7 eV but no BE. One plausible explanation of a weaker or absent BE for the nitrogen lines is that the increase of metallicity in brighter AGN will enhance nitrogen abundance relative to carbon, oxygen etc., because nitrogen is a secondary element whose abundance scale as . This trend could compensate for the decrease of EW in higher-luminosity sources thus making the BE slope flatter. This explanation is supported by a number of recent studies. The metallicities of the BLR (Hamann & Ferland 1993; Nagao et al. 2006a; Juarez et al. 2009) and NLR (e.g., Nagao et al. 2006b; Matsuoka et al. 2009) are both found to correlate with the luminosity of the AGN. So in principal, the –L relationship could produce the flattening of the BE of [N II] 6583 we observe here. However, this explanation has a major problem because N IV] and N III], which would be expected to deviate from the ionization energy–slope relationship for the same reason, lie on it (Dietrich et al. 2002). Despite this serious problem to be resolved, Occam’s razor suggests that an enhanced abundance in high-luminosity AGNs is the simplest and most plausible explanation of the flatter BE slope of [N II] 6583.
The second significant deviation from a BE slope of -0.2 is the steep slopes of H and [O II] 3727. Both of these are star formation (SF) indicators in star-forming galaxies (Kenicutt et al. 1998, Ho 2005) and their EW may reach several hundred Å in starburst galaxies. So even though the AGNs we selected show no absorption feature in the continuum, the emission lines are still possible subject to SF contamination because of their large EW. In low-luminosity sources whose continuum is low, the emission line from SF may contribute significantly to the total line flux, and thus enhance the EW. In type-2 AGNs, the SF contribution of H is estimated to be more than 60% (Brinchmann et al. 2004). The H emitting region of type-1 AGNs, however, may have a higher fraction of the emission originating with the AGN (Zhang et al. 2008) but still be heavily influenced by SF. Furthermore, a variety of studies have established a correlation between the strength of AGN activity and star formation in the local universe ( e.g., Rowan-Robinson 1995; Croom et al. 2002; Netzer et al. 2007, 2009; Shao et al. 2010). The steepest correlation is (Netzer 2009) meaning , a BE slope steeper than -0.2. So it makes sense that the SF in host galaxies would steepen the BE slopes of H and [O II] 3727. However, the [O II] 3727 and H BEs cannot be attributed entirely to SF–AGN relationship. For a plausible range of ionization parameters, densities, and ionizing spectra, the intensity of [O II] 3727 is proportional to that of [O III] 5007 (10% - 30%, Ferland & Osterbrock 1986; Ho et al. 1993a, 1993b). Since [O III] 5007 shows a significant BE, [O II] 3727 is unlikely to show a radically different trend. So it is safe to conclude that the [O II] 3727 and H BE could be partly (but not totally) produced by SF contamination.
A third effect we can see in Fig. 1 is the optical continuum getting bluer towards higher luminosity. This would leverage the continuum and lower the EW if the line flux remains unchanged. This could arise if the NLR sees a filtered spectral-energy distribution (SED) (Kraemer et al. 1998; Groves et al. 2004a,b) so that a change in the ionizing spectrum of an AGN would not change the SED the NLR sees much. The [Ne V] 3425 , [O II] 3727 and [Ne III] 3870 lines are most likely to be influenced by a continuum shape difference effect because of their shorter wavelength. A possible explanation of the bluer color of the UV-optical SED is the anisotropy of the continuum emission. Because the accretion disc is optically thick, we will see a dimmer continuum when viewing it edge-on. (This is the combined result of the projection effect and the disk equivalent of “limb darkening”.) We could also preferentially be seeing the inner, high-temperature part of the disc when viewing face-on. These effects will combine to give a higher observed luminosity with a face-on viewing angle. The reddening of spectrum depends on viewing angle too (Keel 1980; de Zotti & Gaskell 1985; Zhang et al. 2008). Gaskell et al. (2004) used radio orientations to get AGN reddening curves and found the continuum shape is profoundly affected by reddening for all but the bluest AGNs. Because of these effects sources with small inclination would both show large luminosity and have low reddening. An alternative explanation of continuum shape difference is host galaxy contamination. Shen et al. (2011) made composite spectra of different luminosity bins and found that the UV part of all the composite spectra are similar while the optical part flatten with decreasing luminosity. They interpreted this trend as due to host galaxy contamination in the optical region of the spectrum in low-luminosity AGNs. Similar argument is given by Stern & Laor et al. (2012a). Even though we have rejected objects with significant stellar light contributions, weak absorption lines can be spotted on the final composite spectrum of the lowest luminosity bin because of its extremely high signal to noise ratio. Our data cannot distinguish different mechanisms that give rise to the continuum shape difference, and this is beyond the scope of this paper. After correcting the deviations listed above, our conclusion that the slopes of BE for different narrow lines are nearly constant is further strengthened.
4.2. Possible causes of the NLR Baldwin effect
4.2.1 Softening of the ionizing continuum
It has been argued on both observational and theoretical grounds that there is a softening of the ionizing continuum with increasing luminosity (see, for example, Binette et al. 1989; Netzer, Laor, & Gondhalekar 1992; Zheng & Malkan 1993; Wang & Lu 1998; Korista et al. 1998). If this is indeed the case, an important prediction of this is the ionization potential – BE slope relationship (Korista et al. 1998). It is successful in explaining the broad line BE, but a major failing is that it fails to explain the constant BE slope of narrow lines. It is already known that the NLRs of different AGNs are similar in the sense that the line ratios show less than 0.5 dex difference from object to object. (Koski 1978; Veilleux & Osterbrock 1987; Veilleux 1991a, 1991b, 1991c; Veron-Cetty & Veron 2000; Dopita et al. 2002; Gorjian et al. 2007). Kraemer et al. (2000), Dopita et al. (2002) and Groves et al. (2004a,b) proposed a NLR model where dust regulates the incident ionizing spectrum so as to keep the ionization parameter in the NLR constant. In this model, variation of the SED is filtered by dust in the NLR and thus the continuum shape seen by the NLR is dominated by the effect of the dust rather than by intrinsic changes in the SED. This leads to more stable conditions in the NLR. This could be the cause of the lack of a dependence of the slope of the BE on the ionization energy.
4.2.2 Luminosity-dependence Covering Factor
A luminosity-dependent covering factor is a natural explanation of both a BLR and NLR BE. However, to explain the ionization dependence, the variation in covering factor must have a different dependence for lines of different ionizations. This would not be a surprise for the BLR since there is strong radial ionization stratification and the highest ionization lines are an order of magnitude closer to the black hole than the lowest ionization lines (see Gaskell 2009 for a review). Shields, Ferland, & Peterson (1995) suggested that the broad-line BE could be caused by a luminosity-dependent covering factor for clouds that are optically-thin to photons with wavelength less than 912Å. The optically-thin clouds which have small column densities, preferentially emit high-ionization lines. However, comparison of line profiles shows that the BLR BE is due to changes in the low velocity BLR gas (Francis et al. 1992) rather than changes in the very broad component. Furthermore, Snedden & Gaskell (2007) argued that optically-thin gas does not make a substantial contribution to the BLR. Nevertheless, given the strong radial ionization stratification of the BLR, and the decreasing covering factor with ionization (e.g., Francis et al. 1992), an additional luminosity-dependence of the covering factor could explain the BE and why the high-ionization lines should show a steeper slope than low-ionization lines. While this could be consistent with the BLR, it is not obvious how such an explanation can be reconciled with the lack of an ionization-dependence we find here for the BE.
4.2.3 A Disappearing NLR?
The NLR size is correlated with the luminosity of an AGN as (Bennert et al. 2002; Schmitt et al. 2003b; Bennert et al. 2006a,b; Greene et al. 2011). So in high-luminosity AGNs, the NLR may possibly turn from ionization-bounded to matter-bounded, and the luminosity of narrow lines would cease increasing with AGN luminosity. This model could in principle explain part of the BE of NLR (Croom et al. 2002) but it would be too rash a conclusion that it is the origin of the BE because the bulk of the NLR emission originates from within the central few tens or hundreds of pc (Schmitt et al. 2003a) so is unlikely to exceed the scale of the galactic bulge. Besides, the NLR has no natural size because it has no definite edge, so some cut in surface brightness or line-ratio is needed to define the size (Schmitt et al. 2003b; Bennert et al. 2006a,b; Greene et al. 2011). This makes the interpretation of size complicated. Netzer et al. (2004) argue that that is theoretically sound yet this relationship must break down for exceeding a few kpc. They found that high- AGNs have NLR sizes no larger than 10kpc. It is also well known that the the NLR is stratified so that the high-ionization lines rise from the inner part of NLR while low-ionization lines from further away (Veilleux et al. 1995; Bennert et al. 2006a,b). So the “disappearing NLR effect”, if exists, could preferentially influence low-ionization and low-critical density lines. This again stands against the constant slope we find.
4.2.4 Continuum Variation
Because different lines all seem to share a similar BE slope, it is natural to think that it might be the continuum, rather than the emission lines, which is the cause. Jiang et al. (2006) proposed that the continuum variation can produce a weak BE () if the light-crossing time for the region emitting narrow exceeds the variability timescale for the X-ray continuum and the amplitude of variability anti-correlates with the luminosity. Shu et al. (2012) found a strong anti-correlation between the EW of the narrow line and ( (where means time-averaged values) consistent with the X-ray BE expected in an individual AGN if the narrow-line flux remains constant while the continuum varies. For a NLR whose light-crossing time is about yr, the narrow-line luminosity can safely be assumed to be constant. The amplitude of variability of the ionizing continuum can be obtained from the monitoring of AGNs after correction for the constant host galaxy light contribution. As is well known, the amplitude of variability of an AGN increases with time. This can be most readily seen from the structure functions of AGNs (the variance as a function of time interval between observations). We are interested in variability on the longest timescales (timescales similar to the NLR light-crossing time). We do not, of course, have monitoring on such long timescales, but we can estimate the amplitude from structure functions. Cid Fernandez et al. (2000) have presented structure functions for bright AGNs. These are all consistent with the amplitude of variability rising as the time interval increases to a characteristic time of a year or a few years and then remaining constant. Collier & Peterson (2001) got a similar result for lower-luminosity AGNs (but with a shorter characteristic time) and also find that the forms of the UV structure functions are similar to the optical ones. There are indications that the structure function increases gradually on much longer timescales, but data on this part of the structure function are limited. Observed variability thus gives a lower limit to variability on the light-crossing timescale of the NLR.
In order to minimize the host galaxy light contribution one needs to go to as short a wavelength as possible. This means using -band observations or space ultraviolet observations. For example, for NGC 4151 Merkulova (2006) found an observed peak-to-peak -band amplitude of a factor of 7.5. UV variability can be a lot larger. For example, the peak-to-peak amplitude at 1300Å for Fairall 9 is a factor of 25 (Koratkar & Gaskell 1989). Inspection of the results of long-term UV monitoring of a number of AGNs with the IUE satellite (Koratkar & Gaskell 1989, Koratkar & Gaskell 1991a,b, Clavel et al. 1991, and O’Brien et al. 1998) give a median UV peak-to-peak variability of a factor of 7, but the upper quartile is a factor of 13. After correction for host-galaxy light, the amplitudes of optical variability are similarly large. For example, the NGC 4151 photometry of Lyuty & Doroshenko (1999) gives a peak-to-peak amplitude of a factor of about 25 to 30.
Continuum anisotropy (Wang & Lu 1999) can produce an effect similar to that caused by the actual variability of the continuum. It was recently found by Risaliti et al. (2011) that the optically-thick disc emission responsible for the continuum and isotropic [O III] emission will produce the EW([O III]) distribution very well. Variability and continuum anisotropy are, in practice, indistinguishable, so we can consider them together.
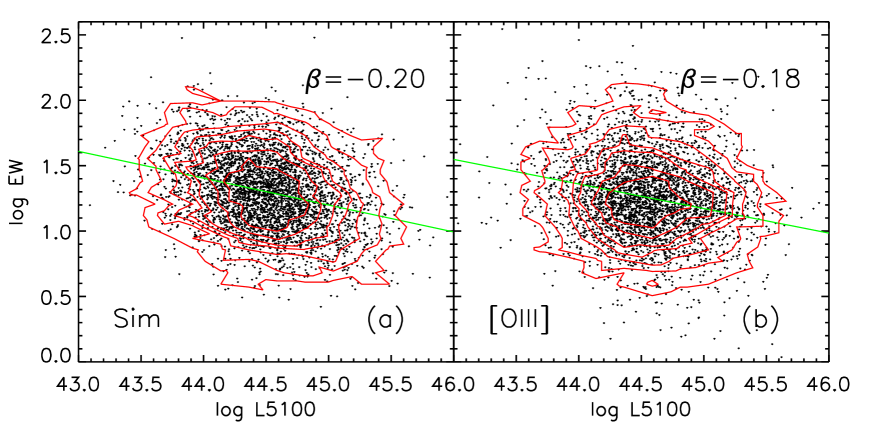
We made Monte-Carlo simulations to explore whether continuum variability can explain the BE slope. In a flux-limited survey, the luminosity will show an approximately log-normal distribution. We generated an artificial sample of sources with a similar distribution of as the observed AGN sample (0.35 dex here). We set the EW of the artificial-sources to be the mean EW of the whole sample, and we add a Gaussian of 0.22 dex to the EW to account for the intrinsic dispersion. UV and optical AGN variability is approximately log-normal – i.e., it looks normal when plotted in magnitudes (see Gaskell 2004 for a discussion of log-normal variation of AGNs). The continuum variation was simulated by adding a Gaussian with (0.18 dex) to the continuum while the emission line flux was kept unchanged. This is an over-simplification, but it can help us to gain some insight into the effect that continuum variability brings. We generated 4000 sources in each round and measured the slope of BE using the 4000 sources. An example of the simulation is shown in Fig. 4. With a peak-to-peak continuum variation of a factor of three, the simulation can produce a BE slope of while a factor of six variation produces a BE slope of . The simulated distribution of EW- can be seen to be very similar to what is observed. Obviously, this model will produce a similar slope for every narrow line if the continuum change with similar amplitude in the wavelength range we concern. It should be noted that due to variation in continuum slope, not all lines show the same BE slope, but depends on wavelength. We assume a constant narrow line flux during the continuum variability. This is an approximation for the continuum variations on time scales of much shorter than the light travel time over the NLR because at such short time scale, the NLR has little response to the continuum variations. For variations on longer time scales, one needs to properly convolve the continuum variations with the response of emission lines (transfer function). By considering the latter response, the variations of equivalent width will be somewhat smaller, but this is equivalent to requiring a somewhat larger continuum variability amplitude.
Conversely, since continuum variability or the equivalent of continuum variability will inevitably produce a BE, the BE slope we observe could give an upper-limit on the few yrs to yrs variability of AGN optical continuum. If the variability amplitudes exceed the factor of three a steeper BE will emerge. This might seem at first sight to be at variance with the amplitudes of UV variability and structure functions observed, but it must be remembered that the equivalent width is the ratio of the line flux to the observed optical continuum and the observed continuum has a substantial starlight contamination. An example of how the apparent continuum variability is substantially less than the real variability is shown in Fig. 4 of Gaskell et al (2008). Host galaxy light limits the apparent peak-to-peak continuum variability to about a factor of three (i.e., a rms variability of a few tenths of a magnitude). This is just what is observed for the PG AGNs studied by Cid Fernandez et al. Since the structure functions are relatively flat after a year or so (Cid Fernandez et al. 2000), the variability effect on the BE should be apparent in a few years. An obvious test of this is to reobserve AGNs after a few years.
4.3. Drawbacks
In summary, the combination of a 50% variation of and a log-normal distribution of luminosity will naturally produce a -0.20 slope of BE for every narrow line, as we observe. The model we employ is obviously an oversimplification. To make a more realistic model, we need a dedicated treatment of sample selection effects and to make a more realistic assumption of the variability including amplitude, variation form, and their dependence on wavelength etc, about the light curve. Despite these simplifications, our results do show that continuum variation will inevitably produce a similar BE for each narrow line. Meanwhile, while the model predicts the same BE slope for each narrow line, the differences in slope are still significant due to the small error bars. There must therefore be some additional factor at work. It has been shown in Fig. 3 that the differences do not correlate with the ionization potential or critical density, so there must be other factors taking effect. A deeper exploration of other factors like ionization slope, NLR geometry and a more realistic model are needed to make progress, but these are beyond the scope of this paper.
5. Conclusion
We have constructed a sample of 3677 radio-quiet AGNs from Sloan Digital Survey Data Release 4 that span three orders of magnitude in luminosity to explore the relationship between equivalent width of narrow lines and . We have computed composite spectra for each bin to enhance the S/N ratio. H and H as well as Fe II were subtracted to get an accurate measurement of narrow emission lines and continuum. We find that most narrow lines show a similar BE slope of about -0.2 while the large deviation of [N II] 6583, [O II] 3727, H and [Ne V] 3425 might be explained by a metallicity effect, SF contamination, or the UV-optical continuum difference. The slope does not show any correlation with ionization energy and critical density. We propose that the combination of a 50% variation of the continuum near 5100Å and a log-normal distribution of observed luminosity distribution will naturally produce a -0.2 slope of BE for every narrow line.
References
- Adelman-McCarthy et al. (2006) Adelman-McCarthy, J. K., et al. 2006, ApJS, 162, 38
- Antonucci (2002) Antonucci, R. 2002, Astrophysical Spectropolarimetry, 151
- Antonucci (2012) Antonucci, R. 2012, arXiv:1210.2716
- Baldwin (1977) Baldwin, J. A. 1977, ApJ, 214, 679
- Baldwin et al. (1978) Baldwin, J. A, Burke, W. F., Gaskell, C. M., & Wampler, E. J. 1978, Nature, 273, 431
- Baldwin et al. (1989) Baldwin, J. A., Wampler, E. J., & Gaskell, C. M. 1989, ApJ, 338, 630
- Bachev et al. (2004) Bachev, R., Marziani, P., Sulentic, J. W., Zamanov, R., Calvani, M., & Dultzin-Hacyan, D. 2004, ApJ, 617, 171
- Baskin & Laor (2004) Baskin, A., & Laor, A. 2004, MNRAS, 350, L31
- Baskin & Laor (2005) Baskin, A., & Laor, A. 2005, MNRAS, 358, 1043
- Becker et al. (1995) Becker, R. H., White, R. L., & Helfand, D. J. 1995, ApJ, 450, 559
- Bennert et al. (2002) Bennert, N., Falcke, H., Schulz, H., Wilson, A. S., & Wills, B. J. 2002, ApJ, 574, L105
- Bennert et al. (2006) Bennert, N., Jungwiert, B., Komossa, S., Haas, M., & Chini, R. 2006, A&A, 459, 55
- Bennert et al. (2006) Bennert, N., Jungwiert, B., Komossa, S., Haas, M., & Chini, R. 2006, A&A, 456, 953
- Binette et al. (1989) Binette, L., Prieto, A., Szuszkiewicz, E., & Zheng, W. 1989, ApJ, 343, 135
- Clavel et al. (1991) Clavel, J., Reichert, G. A., Alloin, D., et al. 1991, ApJ, 366, 64
- Cid Fernandes et al. (2000) Cid Fernandes, R., Sodré, L., Jr., & Vieira da Silva, L., Jr. 2000, ApJ, 544, 123
- Collier & Peterson (2001) Collier, S., & Peterson, B. M. 2001, ApJ, 555, 775
- Collin et al. (2006) Collin, S., Kawaguchi, T., Peterson, B. M., & Vestergaard, M. 2006, A&A, 456, 75
- Croom et al. (2002) Croom, S. M., Rhook, K., Corbett, E. A., et al. 2002, MNRAS, 337, 275
- de Zotti & Gaskell (1985) de Zotti, G., & Gaskell, C. M. 1985, A&A, 147, 1
- Denney et al. (2009) Denney, K. D., Peterson, B. M., Dietrich, M., Vestergaard, M., & Bentz, M. C. 2009, ApJ, 692, 246
- Dibai (1977) Dibai, E. A. 1977, Soviet Astron. Lett., 3, 1
- Dietrich et al. (1999) Dietrich, M., Appenzeller, I., Wagner, S. J., et al. 1999, A&A, 352, L1
- Dietrich & Wilhelm-Erkens (2000) Dietrich, M., & Wilhelm-Erkens, U. 2000, A&A, 354, 17
- Dietrich et al. (2002) Dietrich, M., Hamann, F., Shields, J. C., Constantin, A., Vestergaard, M., Chaffee, F., Foltz, C. B., & Junkkarinen, V. T. 2002, ApJ, 581, 912
- Dong et al. (2009a) Dong, X.-B., Wang, T.-G., Wang, J.-G., et al. 2009, ApJ, 703, L1
- Dong et al. (2009b) Dong, X., Wang, J., Wang, T., et al. 2009, The Starburst-AGN Connection, 408, 83
- Dong et al. (2011) Dong, X.-B., Wang, J.-G., Ho, L. C., et al. 2011, ApJ, 736, 86
- Dopita et al. (2002) Dopita, M. A., Groves, B. A., Sutherland, R. S., Binette, L., & Cecil, G. 2002, ApJ, 572, 753
- Ferland & Osterbrock (1986) Ferland, G. J., & Osterbrock, D. E. 1986, ApJ, 300, 658
- Fine et al. (2008) Fine, S., Croom, S. M., Hopkins, P. F., et al. 2008, MNRAS, 390, 1413
- Francis et al. (1992) Francis, P. J., Hewett, P. C., Foltz, C. B., & Chaffee, F. H. 1992, ApJ., 398, 476
- Gaskell (1984) Gaskell, C. M. 1984, Ap.Lett, 24, 43
- Gaskell (2004) Gaskell, C. M. 2004, ApJ, 612, L21
- Gaskell et al. (2004) Gaskell, C. M., Goosmann, R. W., Antonucci, R. R. J., & Whysong, D. H. 2004, ApJ, 616, 147
- Gaskell (2008) Gaskell, C. M. 2008, Rev. Mexicana de Astron. y Astrofis. Conf. Ser., 32, 1
- Gaskell (2009) Gaskell, C. M. 2009, New Astronomy Reviews, 53, 140
- Gaskell & Klimek (2003) Gaskell, C. M., & Klimek, E. S. 2003, Astronomical and Astrophysical Transactions, 22, 661
- Gorjian et al. (2007) Gorjian, V., Cleary, K., Werner, M. W., & Lawrence, C. R. 2007, ApJ, 655, L73
- Greene & Ho (2005) Greene, J. E., & Ho, L. C. 2005, ApJ, 630, 122
- Greene et al. (2011) Greene, J. E., Zakamska, N. L., Ho, L. C., & Barth, A. J. 2011, ApJ, 732, 9
- Groves et al. (2004) Groves, B. A., Dopita, M. A., & Sutherland, R. S. 2004, ApJS, 153, 9
- Groves et al. (2004) Groves, B. A., Dopita, M. A., & Sutherland, R. S. 2004, ApJS, 153, 75
- Hamann & Ferland (1993) Hamann, F., & Ferland, G. 1993, ApJ, 418, 11
- Hamann & Ferland (1999) Hamann, F., & Ferland, G. 1999, ARA&A, 37, 487
- Ho et al. (1993) Ho, L. C., Shields, J. C., & Filippenko, A. V. 1993, ApJ, 410, 567
- Ho et al. (1993) Ho, L. C., Filippenko, A. V., & Sargent, W. L. W. 1993, ApJ, 417, 63
- Ho (2005) Ho, L. C. 2005, ApJ, 629, 680
- Hönig et al. (2008) Hönig, S. F., Smette, A., Beckert, T., et al. 2008, A&A, 485, L21
- Jiang et al. (2006) Jiang, P., Wang, J. X., & Wang, T. G. 2006, ApJ, 644, 725
- Juarez et al. (2009) Juarez, Y., Maiolino, R., Mujica, R., et al. 2009, A&A, 494, L25
- Keel (1980) Keel, W. C. 1980, AJ, 85, 198
- Kennicutt (1998) Kennicutt, R. C., Jr. 1998, ApJ, 498, 541
- Keremedjiev et al. (2009) Keremedjiev, M., Hao, L., & Charmandaris, V. 2009, ApJ, 690, 1105
- Kollmeier et al. (2006) Kollmeier, J. A., Onken, C. A., Kochanek, C. S., et al. 2006, ApJ, 648, 128
- Koratkar & Gaskell (1989) Koratkar, A. P. & Gaskell, C. M. 1989, ApJ., 345, 637
- Koratkar & Gaskell (1991) Koratkar, A. P., & Gaskell, C. M. 1991, ApJ, 375, 85
- Koratkar & Gaskell (1991) Koratkar, A. P., & Gaskell, C. M. 1991, ApJS, 75, 719
- Korista et al. (1998) Korista, K., Baldwin, J., & Ferland, G. 1998, ApJ, 507, 24
- Koski (1978) Koski, A. T. 1978, ApJ., 223, 56
- Kovačević et al. (2010) Kovačević, J., Popović, L. Č., & Dimitrijević, M. S. 2010, ApJS, 189, 15
- Kraemer et al. (1998) Kraemer, S. B., Ruiz, J. R., & Crenshaw, D. M. 1998, ApJ, 508, 232
- Kraemer et al. (2000) Kraemer, S. B., Crenshaw, D. M., Hutchings, J. B., et al. 2000, ApJ, 531, 278
- Kraemer et al. (2009) Kraemer, S. B., Trippe, M. L., Crenshaw, D. M., et al. 2009, ApJ, 698, 106
- Krolik (2001) Krolik, J. H. 2001, ApJ, 551, 72
- Labiano (2008) Labiano, A. 2008, A&A, 488, L59
- Lawrence (2012) Lawrence, A. 2012, MNRAS, 423, 451
- Lyuty & Doroshenko (1999) Lyuty, V. M., & Doroshenko, V. T. 1999, Astronomy Letters, 25, 341
- Lu et al. (2010) Lu, Y., Wang, T.-G., Dong, X.-B., & Zhou, H.-Y. 2010, MNRAS, 404, 1761
- Lusso et al. (2012) Lusso, E., Comastri, A., Simmons, B. D., et al. 2012, MNRAS, 425, 623
- Marconi et al. (2008) Marconi, A., Axon, D. J., Maiolino, R., et al. 2008, ApJ, 678, 693
- Markwardt (2009) Markwardt, C. B. 2009, in Astronomical Data Analysis Software and Systems XVIII, ed. D. A. Bohlender, D. Durand, & P. Dowler (San Francisco: ASP), 251
- Matsuoka et al. (2009) Matsuoka, K., Nagao, T., Maiolino, R., Marconi, A., & Taniguchi, Y. 2009, A&A, 503, 721
- Merkulova (2006) Merkulova, N. I. 2006, Astronomical Society of the Pacific Conference Series, 360, 17
- Nagao et al. (2006) Nagao, T., Maiolino, R., & Marconi, A. 2006, A&A, 447, 863
- Nagao et al. (2006) Nagao, T., Marconi, A., & Maiolino, R. 2006, A&A, 447, 157
- Netzer (1985) Netzer, H. 1985, MNRAS, 216, 63
- Netzer (1987) Netzer, H. 1987, MNRAS, 225, 55
- Netzer et al. (1992) Netzer, H., Laor, A., & Gondhalekar, P. M. 1992, MNRAS, 254, 15
- Netzer & Laor (1993) Netzer, H., & Laor, A. 1993, ApJ, 404, L51
- Netzer et al. (2004) Netzer, H., Shemmer, O., Maiolino, R., Oliva, E., Croom, S., Corbett, E., & di Fabrizio, L. 2004, ApJ, 614, 558
- Netzer et al. (2007) Netzer, H., Lutz, D., Schweitzer, M., et al. 2007, ApJ, 666, 806
- Netzer (2009) Netzer, H. 2009, MNRAS, 399, 1907
- O’Brien et al. (1998) O’Brien, P. T., Dietrich, M., Leighly, K., et al. 1998, ApJ, 509, 163
- Radomski et al. (2003) Radomski, J. T., Piña, R. K., Packham, C., et al. 2003, ApJ, 587, 117
- Rafiee & Hall (2011) Rafiee, A., & Hall, P. B. 2011, ApJS, 194, 42
- Risaliti et al. (2011) Risaliti, G., Salvati, M., & Marconi, A. 2011, MNRAS, 411, 2223
- Robinson et al. (1994) Robinson, A., Vila-Vilaro, B., Axon, D. J., et al. 1994, A&A, 291, 351
- Rowan-Robinson (1995) Rowan-Robinson, M. 1995, MNRAS, 272, 737
- Schawinski et al. (2007) Schawinski, K., Thomas, D., Sarzi, M., et al. 2007, MNRAS, 382, 1415
- Schmitt, H. R. (1998) Schmitt, H R. 1998 , ApJ, 506, 647
- Schmitt et al. (2003a) Schmitt, H. R., Donley, J. L., Antonucci, R. R. J., Hutchings, J. B., & Kinney, A. L. 2003, ApJS, 148, 327
- Schmitt et al. (2003b) Schmitt, H. R., Donley, J. L., Antonucci, R. R. J., et al. 2003, ApJ, 597, 768
- Schweitzer et al. (2008) Schweitzer, M., Groves, B., Netzer, H., et al. 2008, ApJ, 679, 101
- Shao et al. (2010) Shao, L., Lutz, D., Nordon, R., et al. 2010, A&A, 518, L26
- Shakura & Sunyaev (1973) Shakura, N. I., & Sunyaev, R. A. 1973, A&A, 24, 337
- Shen et al. (2008) Shen, Y., Greene, J. E., Strauss, M. A., Richards, G. T., & Schneider, D. P. 2008, ApJ, 680, 169
- Shen et al. (2011) Shen, Y., Richards, G. T., Strauss, M. A., et al. 2011, ApJS, 194, 45
- Shields et al. (1995) Shields, J. C., Ferland, G. J., & Peterson, B. M. 1995, ApJ, 441, 507
- Shields (2007) Shields, J. C. 2007, The Central Engine of Active Galactic Nuclei, 373, 355
- Shu et al. (2012) Shu, X. W., Wang, J. X., Yaqoob, T., Jiang, P., & Zhou, Y. Y. 2012, ApJ, 744, L21
- Snedden & Gaskell (2007) Snedden, S. A. & Gaskell, C. M. 2007, ApJ, 669, 126
- Steiner (1981) Steiner, J. E. 1981, ApJ, 250, 469
- Steinhardt & Elvis (2010) Steinhardt, C. L., & Elvis, M. 2010, MNRAS, 402, 2637
- Steinhardt & Elvis (2010) Steinhardt, C. L., & Elvis, M. 2010, MNRAS, 406, L1
- Steinhardt (2011) Steinhardt, C. L. 2011, ApJ, 738, 110
- Stern & Laor (2012) Stern, J., & Laor, A. 2012, MNRAS, 423, 600
- Stern & Laor (2012) Stern, J., & Laor, A. 2012, arXiv:1207.5543
- Stern & Laor (2012) Stern, J., & Laor, A. 2012, arXiv:1210.6394
- Tomono et al. (2001) Tomono, D., Doi, Y., Usuda, T., & Nishimura, T. 2001, ApJ, 557, 637
- Tremonti et al. (2004) Tremonti, C. A., Heckman, T. M., Kauffmann, G., et al. 2004, ApJ, 613, 898
- Vanden Berk et al. (2001) Vanden Berk, D. E., Richards, G. T., Bauer, A., et al. 2001, AJ, 122, 549
- Véron-Cetty & Véron (2000) Véron-Cetty, M. P., & Véron, P. 2000, A&A Rev., 10, 81
- Véron-Cetty et al. (2004) Véron-Cetty, M.-P., Joly, M., & Véron, P. 2004, A&A, 417, 515
- Veilleux & Osterbrock (1987) Veilleux, S., & Osterbrock, D. E. 1987, ApJS, 63, 295
- Veilleux (1991a) Veilleux, S. 1991, ApJS, 75, 357
- Veilleux (1991b) Veilleux, S. 1991, ApJS, 75, 383
- Veilleux (1991c) Veilleux, S. 1991, ApJ, 369, 331
- Wandel (1999) Wandel, A. 1999, ApJ, 527, 649
- Wandel (1999) Wandel, A. 1999, ApJ, 527, 657
- Wandel et al. (1999) Wandel, A., Peterson, B. M., & Malkan, M. A. 1999, ApJ, 526, 579
- Warner et al. (2004) Warner, C., Hamann, F., & Dietrich, M. 2004, ApJ, 608, 136
- Wang et al. (2009) Wang, J.-G., et al. 2009, ApJ, 707, 1334
- Wang& Lu (2001) Wang, T., & Lu, Y. 2001, A&A, 377, 52
- Wills et al. (1993) Wills, B. J., Netzer, H., Brotherton, M. S., et al. 1993, ApJ, 410, 534
- Zamorani et al. (1992) Zamorani, G., Marano, B., Mignoli, M., Zitelli, V., & Boyle, B. J. 1992, MNRAS, 256, 238
- Zhang et al. (2008) Zhang, K., Wang, T., Dong, X., & Lu, H. 2008, ApJ, 685, L109
- Zhang et al. (2011) Zhang, K., Dong, X.-B., Wang, T.-G., & Gaskell, C. M. 2011, ApJ, 737, 71
- Zheng & Malkan (1993) Zheng, W., & Malkan, M. A. 1993, ApJ, 415, 517
- Zhou et al. (2006) Zhou, H., Wang, T., Yuan, W., et al. 2006, ApJS, 166, 128
| Line | log | slope | |
|---|---|---|---|
| (1) | (2) | (3) | (4) |
| [Ne V] 3425 | 97.12 | 7.3 | -0.31 0.015 |
| [O II] 3727 | 13.62 | 3.5 | -0.37 0.011 |
| [Ne III] 3870 | 40.96 | 5.5 | -0.26 0.020 |
| H | 13.6 | Infinity | -0.28 0.015 |
| [O III] 5007 | 35.11 | 5.8 | -0.21 0.016 |
| [O I]6300 | 0 | 6.3 | -0.16 0.030 |
| H | 13.6 | Infinity | -0.29 0.033 |
| [N II] 6583 | 14.5 | 4.82 | -0.10 0.014 |
| [S II] 6717, 6731 | 10.36 | 2.3 | -0.20 0.016 |
Columns from left to right: (1)The name of
the line. (2) The ionization energy needed to create the ion. (3) The critical
density of specific line. (4) The log EW – log slope.