Young accreted globular clusters in the outer halo of M31
Abstract
We report on Gemini/GMOS observations of two newly discovered globular clusters in the outskirts of M31. These objects, PAndAS-7 and PAndAS-8, lie at a galactocentric radius of kpc and are projected, with separation kpc, onto a field halo substructure known as the South-West Cloud. We measure radial velocities for the two clusters which confirm that they are almost certainly physically associated with this feature. Colour-magnitude diagrams reveal strikingly short, exclusively red horizontal branches in both PA-7 and PA-8; both also have photometric FeH. At this metallicity, the morphology of the horizontal branch is maximally sensitive to age, and we use the distinctive configurations seen in PA-7 and PA-8 to demonstrate that both objects are very likely to be at least 2 Gyr younger than the oldest Milky Way globular clusters. Our observations provide strong evidence for young globular clusters being accreted into the remote outer regions of M31 in a manner entirely consistent with the established picture for the Milky Way, and add credence to the idea that similar processes play a central role in determining the composition of globular cluster systems in large spiral galaxies in general.
keywords:
globular clusters: general, galaxies: individual: M311 Introduction
It has long been recognized that some fraction of the globular clusters in the Milky Way halo have very likely been accumulated via the accretion and destruction of their satellite host galaxies, rather than having formed in situ. However much of the observational support for this picture is circumstantial rather than direct. In their seminal paper Searle & Zinn (1978) showed that halo clusters outside the solar circle exhibit no abundance gradient with Galactocentric radius, and further that the horizontal branch (HB) morphologies for these objects (taken as a proxy for age) show little correlation with abundance. They postulated that the outer globular clusters did not form during the initial collapse of the Galaxy but originated in smaller “proto-galactic fragments” that were subsequently accreted into the Galactic potential well, even long after the formation of the central regions of the Milky Way was complete.
Modern studies with vastly improved datasets still support this scenario. It is now known that a wide variety of properties commonly associated with globular clusters in the outer parts of the Milky Way, such as their ages (measured directly from precise main-sequence turn-off photometry), kinematics, HB morphologies, spatial locations, luminosities, and sizes, are consistent with an external origin (see e.g., Zinn, 1993; Mackey & Gilmore, 2004; Mackey & van den Bergh, 2005; Marín-Franch et al., 2009; Forbes & Bridges, 2010; Dotter et al., 2010, 2011; Keller, Mackey & Da Costa, 2012). Under the assumption that age is the dominant second parameter controlling horizontal branch morphology, Zinn (1993) labelled the ensembles of globular clusters with red and blue HBs at given FeH as the “young” and “old” halo systems, respectively. That young halo clusters typically have ages several Gyr younger than old halo members has now been explicitly demonstrated (e.g., Dotter et al., 2010, 2011), and it is these objects, with their characteristic diffuse structures and frequently retrograde orbits, that are the strongest candidates for having been accreted into the Milky Way.
The “smoking gun” for the accretion scenario was the discovery of the disrupting Sagittarius dwarf (Ibata, Gilmore & Irwin, 1994) and the recognition that at least four remote Galactic globular clusters (M54, Arp 2, Terzan 7 and 8) are in fact members of this galaxy caught in the midst of their arrival into the Milky Way halo (Ibata, Gilmore & Irwin, 1995; Da Costa & Armandroff, 1995). It has been shown more recently that at least one young halo globular cluster widely separated from the main body of Sagittarius on the sky, Palomar 12, also once belonged to that galaxy (Martínez-Delgado et al., 2002; Cohen, 2004); furthermore, a handful of additional clusters are strong candidates for being ex-members (e.g., Bellazzini, Ferraro & Ibata, 2003; Law & Majewski, 2010; Forbes & Bridges, 2010).
If a significant fraction of remote Milky Way globular clusters have indeed been accreted, it might be expected that the outskirts of these objects would be an excellent place to search for the remnants of their host galaxies. However, despite a significant investment of effort (e.g., Sohn et al., 2003; Martínez-Delgado et al., 2004) and a few tantalising recent hints (e.g., Olszewski et al., 2009; Sollima et al., 2012), no such streams have yet been definitively identified. To date, the handful of clusters arriving along with the Sagittarius dwarf represent the only direct evidence for the accretion scenario; all else remains circumstantial. In particular, despite the compelling properties of the young halo ensemble, it is not clear to what extent these objects are representative of the entirety of the accreted population – several of the Sagittarius clusters are old halo members, and indeed a number of the clusters seen in the LMC and the Fornax dSph would also be classified as such (e.g., Mackey & Gilmore, 2004; Mackey & van den Bergh, 2005).
M31 is of vital importance in providing a unique external system for addressing the above problems; it is the only other large galaxy in which globular clusters may be resolved into individual stars. Wide-field surveys conducted by our group, including, most recently, the Pan-Andromeda Archaeological Survey (PAndAS; McConnachie et al., 2009), have uncovered a wealth of streams and substructure in the M31 field halo (see also Ferguson et al., 2002; Ibata et al., 2007), along with a large number of remote globular clusters with projected radii in the range kpc (Huxor et al., 2005, 2008, 2013, in prep.). We have previously demonstrated that there is a striking correlation between a number of the tidal streams seen in the M31 halo and the positions of many of the globular clusters (Mackey et al., 2010a); now that the PAndAS footprint is complete, it has become clear that this association apparently holds across the entire M31 halo beyond kpc (Mackey et al. 2013, in prep.). The unavoidable conclusion from these observations is that much of the outer M31 globular cluster system () has been assembled via the accretion of cluster-bearing satellite galaxies, just as has long been suspected in the Milky Way.
We have embarked on a detailed observational programme aimed at measuring (i) radial velocities for, and (ii) the resolved properties of, remote M31 globular clusters, especially those projected onto tidal streams and overdensities. These observations will confirm (or refute) individual associations between clusters and substructures, and allow us to explore in detail the characteristics – in particular the metallicities, HB morphologies, and structures – of accreted M31 globular clusters for direct comparison with Milky Way subsystems such as the young and old halo ensembles.
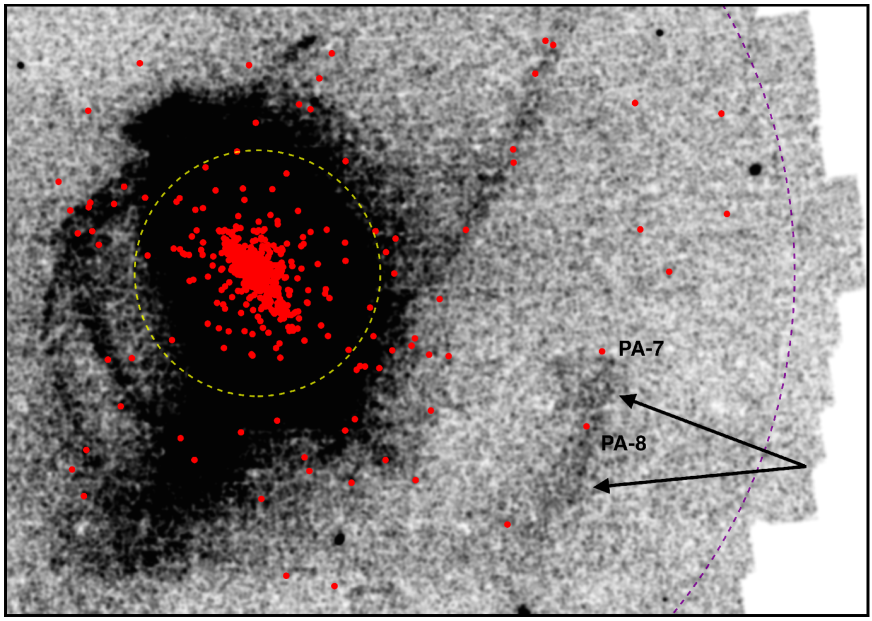
In this paper we report on some of the first results of this work. We have targeted two newly-discovered M31 globular clusters from the PAndAS survey, PAndAS-7 and PAndAS-8 (Huxor et al. 2013, in prep.), with imaging and spectroscopic observations using the GMOS instrument on Gemini North. Assuming the usual M31 distance modulus of , PA-7 and PA-8 lie at projected galactocentric radii of and kpc, respectively, and are separated by a distance of kpc. Both project onto a field halo substructure known as the South-West Cloud, as shown in Figure 1 (see also Mackey et al., 2010a).
So far little is known about either the target clusters or the South-West Cloud. Based on the PAndAS discovery images both PA-7 and PA-8 appear sub-luminous, with and , respectively. With , they are also mildly redder than other globular clusters at similar radii (which typically have as in e.g., Huxor et al., 2011). The South-West Cloud was first described by McConnachie et al. (2009), and is one of the more diffuse substructures identified in the M31 halo to date. Density maps constructed using different photometric cuts (such as Fig. 1, see also Richardson et al., 2011), indicate that it must be predominantly composed of stars with FeH. No kinematics have yet been measured for the South-West Cloud; however, Lewis et al. (2012) describe a large spur of Hi gas extending from the central parts of M31 to very nearly overlap with this stellar substructure. While any link between the two remains circumstantial, we note that the Hi velocity is km s-1, with width km s-1.
In what follows we describe our data acquisition and reduction (Section 2), the results inferred from radial velocity measurements and the cluster colour-magnitude diagrams (Section 3), and the implications for our understanding of accretion processes in assembling both M31 and the Milky Way globular cluster systems (Section 4).
2 Observations and data reduction
2.1 Imaging and photometry
We imaged PA-7 and PA-8 over a number of nights in August and September 2008, as indicated in Table LABEL:t:obs, using the Gemini Multi-Object Spectrograph (GMOS) at the m Gemini North telescope on Mauna Kea, Hawaii. The data were obtained in queue mode via program GN-2008B-Q-22 (PI: Mackey) during clear, photometric conditions and under excellent seeing ().
| Cluster | Coordinates (J2000.0) | Filter or | Number of | Total | Dates | Image | |||
| Name | RA | Dec | Grating | Frames | Exposure | Observed | Quality | ||
| PAndAS-7 | s | --, -- | |||||||
| s | --, -- | ||||||||
| R831 | s | -- | |||||||
| PAndAS-8 | s | -- | |||||||
| s | -- | ||||||||
| R831 | s | --, -- | |||||||
| G1 | R831 | s | -- | ||||||
| MGC1 | R831 | s | -- | ||||||
The GMOS imager (Hook et al., 2004) is comprised of three adjacent pixel CCDs separated by gaps of , and has a field of view (which does not cover the full CCD package) of . To take advantage of the high quality conditions we employed unbinned imaging, resulting in a plate scale of arcsecpixel. We obtained our observations in the GMOS and filters, which are similar, but not identical, to the and filters used by the Sloan Digital Sky Survey (SDSS), and the and filters employed by the MegaCam imager on the Canada-France-Hawaii Telescope (CFHT). We took six images with the filter and five with the filter, arranged in a dither pattern with a step size of designed to eliminate the gaps between the CCDs and provide continuous coverage of our field. Exposure durations were s per image for the filter and s per image for the filter.
We reduced our data using the GMOS software package in iraf. Appropriate bias and flat-field images obtained as part of the standard GMOS baseline calibrations were downloaded from the Gemini science archive and then applied to each exposure using the gireduce task. The three CCD frames in a given exposure were next mosaicked into a single frame using the gmosaic task, and the five or six mosaicked frames for a given filter were then combined into a single image using the imcoadd task.
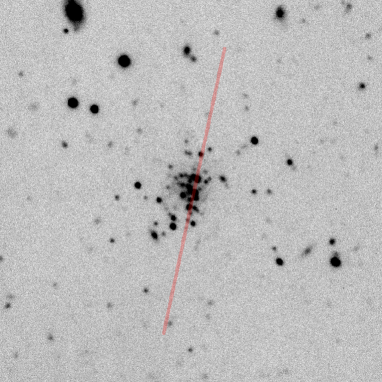
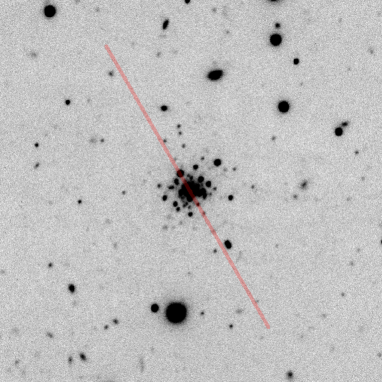
Fig. 2 shows the central regions of our combined s -band images of the two clusters. Stellar objects in the image of PA-7 have a FWHM pixels, or , while those in the image of PA-8 have a FWHM pixels, or . Although crowding precludes precise photometry in the innermost regions of both clusters, each has a sufficient number of individual members surrounding its centre to produce a useable colour-magnitude diagram (CMD).
We performed photometric measurements on our combined images following a procedure identical to that which we previously applied to GMOS imaging of the exceptionally remote M31 globular cluster MGC1 (Mackey et al., 2010b). In brief, we fit a point-spread function (PSF) model to each combined image using the stand-alone versions of daophot ii and allstar ii (Stetson, 1987). For any given image we began by conducting a first pass of object detection with daophot, and selected relatively bright, isolated stars from the list of detections to construct an initial PSF. Previous experience with MGC1, along with some additional experimentation on our present set of observations, showed that a ‘penny2’ PSF model (Gaussian core plus Lorentzian wings) varying quadratically across the GMOS field of view provided excellent results. We iteratively removed from the PSF list any stars with an error in their fit of more than three times the average, redefining the model each time.
After reaching convergence (at which point there were still typically stars defining the PSF) we used allstar to subtract from the image any stars neighbouring those in the PSF list. We then used the now completely isolated PSF stars on this subtracted image to recalculate and further refine the PSF model. Next, we applied this model to the original image using allstar and subtracted all known stars. This subtracted image was then run back through daophot in order to find faint objects missed in the first detection pass. Finally, we took the original image and our final PSF model and used allstar to perform photometric measurements on the complete list of detected objects.
In order to eliminate non-stellar objects and stars with poor photometry, we passed the resulting list of measurements through several quality filters based on parameters calculated by allstar. Specifically, we filtered objects by the of their PSF fit, their estimated photometric error, and their measured sharpness relative to the PSF model. Both clusters lie at moderately low Galactic latitude (), resulting in plenty of foreground stars scattered across both GMOS fields that allowed us to define, in each filter, suitable ranges in these parameters as a function of magnitude for well-measured point sources.
To calibrate our photometry, we decided to depart from the procedure we applied to our previous observations of MGC1. Instead of using the baseline Gemini calibration imaging of one standard field (containing stars) per cluster per night, we cross-matched our list of stellar detections against the PAndAS catalogue in order to derive suitable transformations from instrumental Gemini/GMOS magnitudes onto the CFHT/MegaCam photometric system. We excised circular regions of radius about each cluster to avoid problems associated with crowding; across the PA-7 field we matched stars while in the PA-8 field we matched stars. This large number of stars, covering a wide range of colours , allowed for a more robust transformation than we were able to achieve for MGC1 by employing four standard stars to calibrate our photometry onto the SDSS system.
| Cluster and | Linear Term | Exponential Term | Colour Term | |||||||||
|---|---|---|---|---|---|---|---|---|---|---|---|---|
| Passband | ||||||||||||
| PAndAS-7 -band | 1.0081 | 9.5523 | 0.0214 | 13.0 | 1.1072 | 0.000 | 0.000 | |||||
| PAndAS-7 -band | 1.0073 | 9.8127 | 0.0238 | 12.0 | 0.2743 | 0.025 | -0.050 | 1.80 | 3.60 | |||
| PAndAS-8 -band | 1.0080 | 9.5789 | 0.0260 | 13.3 | 0.3417 | -0.030 | 0.020 | 1.00 | 1.80 | |||
| PAndAS-8 -band | 1.0001 | 9.7305 | 0.0338 | 12.0 | 0.4752 | 0.025 | -0.020 | 1.60 | 2.80 | |||
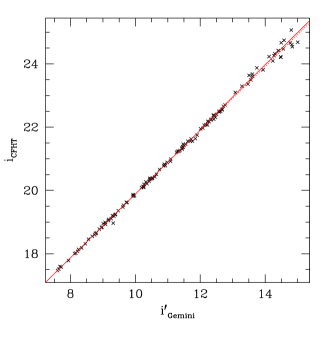
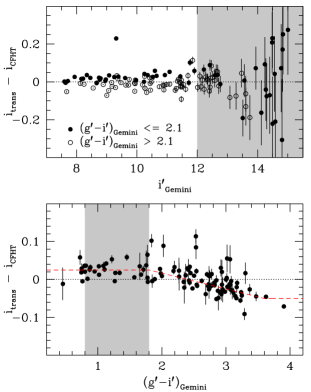
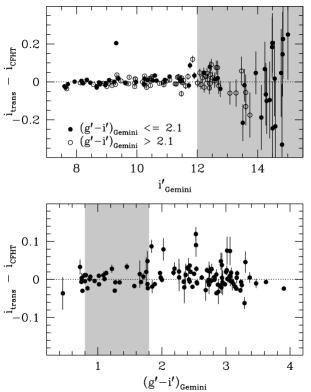
An example of our transformation procedure is shown in Figure 3. As noted previously, the GMOS and filters are similar, but not identical, to the and filters employed by CFHT. To a first approximation, we found both the -band and -band transformations to be linear. However, some experimentation revealed a mild deviation at the faint end for both filters, which we accounted for by adding a small exponential term at faint magnitudes. The necessity of this additional term is not evident to the eye in Figure 3, but was readily identified after, for example, trying to match globular cluster fiducial sequences to the colour-magnitude diagrams for PA-7 and PA-8 (Section 3.2).
As in Figure 3, plots of the resulting residuals revealed that further small corrections involving were required. The implied form of these was consistent across the - and -band photometry for both clusters – a constant offset at blue colours, moving linearly to another constant offset at red colours.
In summary, our final transformations took the form:
| (1) |
Here, is the instrumental GMOS or magnitude and is the instrumental colour, is the final transformed magnitude on the calibrated (PAndAS) CFHT/MegaCam scale, and are coefficients defining the linear term, and and are the exponential and colour terms, respectively:
The coefficient represents the cut-on magnitude for the exponential term, while and are the blue and red colours of the knees in the colour term. We list the derived coefficients for each of our photometric transformations in Table LABEL:t:phot. As in Figure 3, application of these transformations resulted in rms residuals at a level of a few mag across the full range of colours in both filters.
The MegaCam -band filter broke in June 2007 and was replaced in October 2007; these two filters are not identical at a level of up to mag across the full colour range (e.g. McConnachie et al., 2010). The PAndAS imaging covering PA-7 and PA-8 was taken in late 2006 and our transformations are hence to the original MegaCam -band system.
2.2 Spectroscopy
We obtained longslit spectra of PA-7 and PA-8 with GMOS-N on two nights in July and August 2010 with the aim of measuring radial velocities for these two faint clusters. The data were obtained in queue mode as part of program GN-2010B-Q-19 (PI: Mackey) during clear conditions and with seeing better than , as outlined in Table LABEL:t:obs. We employed the R831 grating operating at central wavelengths near Å, in combination with a slit width and the RG610 blocking filter, to obtain a (measured) resolution around the Ca ii triplet at Å, Å, and Å. We binned the CCD by a factor two in both directions to achieve a spatial resolution of per pixel and a dispersion of Å per pixel. PA-7 is a loosely aggregated cluster with no well defined core, so we placed the slit on the brightest central red giant member and oriented it at a position angle of east of north in order to cover the next brightest giant plus at least one fainter member. For PA-8 we oriented the slit at a position angle of east of north in order to cover the unresolved cluster core and the brightest resolved red giant member. Positioning of the slit for both targets is indicated in Figure 2.
For each cluster we obtained six s exposures, split into two groups of three observed at central wavelengths of Å and Å respectively. This strategy served to fill the wavelength coverage gaps between the three GMOS CCDs as well as mitigating the effects of hot pixels and bad columns. Within each group the three exposures were dithered by along the slit in order to fill the gaps created by the stabilising bridges on the GMOS longslit mask, further mitigate the impact of any detector defects, and to help reduce systematics during the subtraction of atmospheric emission lines. We bracketed each group of three science frames with arc-lamp exposures to ensure an accurate wavelength calibration. Flat-field images were taken for each central wavelength setting.
In addition to PA-7 and PA-8 we observed the very bright and concentrated M31 globular clusters G1 and MGC1 to serve as radial velocity templates. G1 is listed with a velocity km s-1 in the Revised Bologna Catalogue (RBC, V4.0; Galleti et al., 2004), while Alves-Brito et al. (2009) measured km s-1 for MGC1 from a high resolution spectrum. As outlined in Table LABEL:t:obs, our observations of G1 were obtained in July 2010 as part of the same program (GN-2010B-Q-19) under which PA-7 and PA-8 were targeted, while our spectra of MGC1 were obtained in August 2011 as part of program GN-2011B-Q-61 (PI: Mackey). For both clusters we employed an identical set-up to that described above for PA-7 and PA-8, except that the slit was centred on the unresolved core of each target. The brightness of the two clusters necessitated shorter individual exposure durations of s for G1 and s for MGC1. We obtained nine frames for each target, split into three groups of three observed at central wavelengths of Å, Å, and Å. As before, within each of these groups the three exposures were dithered by along the slit, and each group was bracketed with arc-lamp exposures.

As with the imaging data, we reduced our spectroscopic observations using the GMOS package in iraf. For a given cluster, we first created normalised flat-fields for each of the central wavelength settings using the gsflat task. These normalised flat-fields were then applied to the science frames, along with an appropriate bias image from the Gemini archive, using the gsreduce task. We also ran gsreduce on the arc-lamp exposures, but did not apply flat-fields to these frames. Next, we ran gswavelength on the reduced arcs in order to establish a wavelength calibration at all points along the slit for any given science frame, and then applied these calibrations and rectified the science frames with gstransform. We carefully examined the positions of the sky lines on each frame to check that the calibration was accurate, particularly near the object spectrum and the Ca ii triplet. We applied gsskysub to perform a sky subtraction on each of the calibrated science exposures, and then extracted 1D object spectra from the sky-subtracted frames using the gsextract task. This step was straightforward for the two reference clusters – for each one we simply extracted the spectrum of the bright unresolved core. For PA-8 we extracted the spectrum of the unresolved core as well as that of the bright red giant member we also placed on the slit. For PA-7 we attempted to extract spectra for all three of the red giants we placed on the slit; however only the brightest had sufficient signal to provide a useable spectrum.
Finally, we corrected each extracted spectrum to the heliocentric frame using the iraf tasks rvcorrect and dopcor, and then median-combined the individual exposures of a given target into a final spectrum using the scombine task. Best results, including cosmic-ray removal, were achieved by scaling the input spectra to a common flux level and then, when combining them, weighting each by its median flux value and applying a sigma-clipping rejection algorithm.
Figure 4 shows our combined spectra in the region of the Ca ii triplet for PA-7, PA-8 and the two reference clusters; each has been normalized using the iraf task continuum. We estimate that in this part of the spectrum the signal-to-noise is per resolution element for PA-7, and per resolution element for PA-8. Even so, the Ca ii lines are clearly visible in both cases – their positions suggest that both PA-7 and PA-8 have larger blue-shifts than either template cluster.
3 Results and analysis
3.1 Radial velocities
We used the iraf task fxcor to determine radial velocity estimates for PA-7 and PA-8 by cross-correlating their spectra against those of the template clusters G1 and MGC1 (see e.g., Tonry & Davis, 1979). Because of the presence of strong telluric absorption features at several different places within our spectral coverage, as well as the presence of non-zero residuals from the sky subtraction, we chose to cross-correlate just the region covering the Ca ii triplet with a Å buffer at either end (i.e., Å). This worked well for PA-8, producing a strong isolated cross-correlation peak; however for PA-7 the results were poor. We traced the problem for PA-7 to the Ca ii line at Å which falls in a crowded region of sky emission. Due to the low signal-to-noise of the source spectrum, residuals from the sky subtraction skewed the shape (and position) of this Ca ii line. By restricting the cross-correlation region to the Ca ii lines at Å and Å (i.e., adopting the range Å) we circumvented this problem. We verified that using just this region for PA-8, we were able to reproduce the velocity obtained from using all three Ca ii lines to better than the uncertainty on that measurement.
Our results are as follows: for PA-7 we obtained a heliocentric radial velocity km s-1, where the uncertainty includes the quoted errors on the velocities of the reference targets. The height of the cross-correlation peak, against either template, was , while the Tonry & Davis (1979) R-parameter – both indicating a sound match between the target and reference spectra. For PA-8 we found km s-1, with a cross-correlation peak of height , and – indicating a high quality match between the spectra.
These two velocities fall quite close together and are rather different from the systemic M31 velocity of km s-1, suggesting that PA-7 and PA-8 are likely to be associated with the underlying South-West Cloud rather than being two unrelated members of the M31 halo. Ultimate verification of this association will require velocity measurements for stellar members of the tidal substructure; for now we use a simple statistical test to quantify the significance of our result.
By measuring velocities for a large number of stars at a variety of different positions in the M31 halo, Chapman et al. (2006) estimated the (1-dimensional) halo velocity dispersion to decrease with projected radius as:
| (2) |
Extrapolating a small amount beyond their outermost field at kpc suggests that the velocity dispersion of the M31 halo at radii comparable to PA-7 and PA-8 ( kpc) should be km s-1. Under the assumption that remote M31 globular clusters share the global kinematics of the metal-poor field halo, we ask how likely it is that two independent objects, not members of any accreted substructure, should have velocities at least as far away from the M31 systemic velocity as observed for both PA-7 and PA-8, but within a similar margin of each other. We used a simple Monte Carlo model to address this question – we generated a very large number () of globular cluster pairs with velocities randomly drawn from a Gaussian distribution of width km s-1 centred on km s-1, and counted the number of times that (i) both clusters had velocities km s-1, and (ii) the difference between them km s-1. We found this to be a very unusual configuration, occuring just of the time. Note that the bounds adopted here are somewhat conservative to allow for the uncertainties in our radial velocity measurements, meaning that this probability is best treated as an upper limit.
This simple test indicates that PA-7 and PA-8 are almost certainly not unrelated members of the M31 halo, consistent with our observation that these two clusters are projected directly on top of the South-West Cloud and strongly suggestive that they are both associated with this substructure.
3.2 Metallicity and age constraints
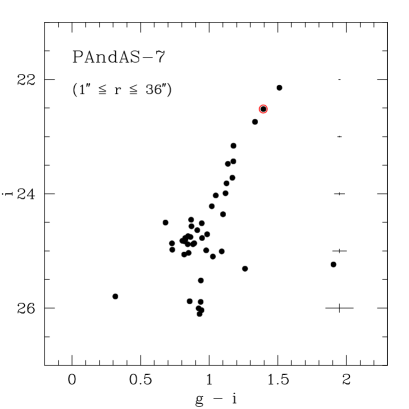
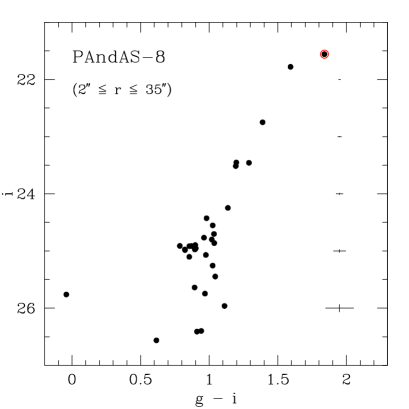
Colour-magnitude diagrams for PA-7 and PA-8 are displayed in Figure 5. Our photometry reaches to and , just over one magnitude below the typical horizontal branch level for globular clusters at the M31 distance and reddening. The CMDs are sufficiently well populated to discern the locus of the red giant branch (RGB) and the position and morphology of the HB. For both clusters the latter feature is particularly striking, being very short and exclusively red – in fact, more of a red clump than a typical globular cluster HB. In this respect the CMDs bear considerable resemblence to those for many of the young halo globular clusters found in the outskirts of the Milky Way, such as Palomar 3, 4, and 14, Pyxis, Eridanus, and AM-1 (e.g., Stetson et al., 1999; Hilker, 2006; Dotter, Sarajedini & Yang, 2008a, 2011). These particular objects possess ages several Gyr younger than the oldest members of the Galactic system (e.g., Marín-Franch et al., 2009; Dotter et al., 2010). Given this, it is quite possible that both PA-7 and PA-8 are also young globular clusters, and we assess the likelihood of this below.
The first point to note is that crowding and incompleteness do not affect the observed HB morphology for PA-7 and PA-8. That is, we do not believe that there are blue HB stars in these clusters that were preferentially missed during the photometric measurements. A by-eye inspection of the detected objects indicates that all stars at this brightness level in the vicinity of the clusters were photometred. A few were discarded due to crowding issues but none of these were significantly bluer than the HB stars with good measurements. As further evidence of this point, we direct the interested reader to our observations of the M31 halo cluster MGC1 (Mackey et al., 2010b), which we took with GMOS under very similar atmospheric conditions. Crowding and incompleteness is more of a problem in this luminous compact cluster, yet we still clearly detect stars all along its blue HB.
We estimated the metallicity, foreground reddening, and distance of PA-7 and PA-8 by overplotting fiducial sequences from several Galactic globular clusters on their CMDs. For a given comparison cluster we measured the vertical shift required to align the HB level with that of either PA-7 or PA-8, along with the horizontal shift required to align the colour of the red giant branches (RGBs) at the HB level. This horizontal shift gives the difference in colour excess between the two clusters; when combined with the vertical shift this then yields the difference in distance modulus. Since the shape of the upper RGB is strongly sensitive to FeH, the fiducial sequence most closely tracing this feature indicates the cluster metallicity.
Because the colour of the RGB at HB level is sensitive to age as well as FeH (and also, indeed, to Fe) we attempted, as far as possible, to adopt fiducial sequences for Galactic clusters possessing red HB morphology. Clem, Vanden Berg & Stetson (2008) provide fiducial sequences for globular clusters and one open cluster in the CFHT/MegaCam filter system, while An et al. (2008) provide sequences for globular clusters and open clusters in the SDSS filter system. Since our final photometry for PA-7 and PA-8 is calibrated to the MegaCam system, ideally we would have used the Clem et al. (2008) clusters as our templates. Unfortunately, however, a small amount of testing revealed that of their sample, only M71 was in any way close to PA-7 and PA-8 in terms of FeH and HB morphology.
The sample of An et al. (2008), on the other hand, possesses a number of red HB clusters with FeH comparable to that for PA-7 and PA-8. Of particular relevance here are the outer halo objects Palomar 3 and 4. Since the SDSS photometric system is slightly different to the CFHT/MegaCam system, it was necessary to apply suitable transformations to the An et al. (2008) fiducials before comparing them to our CMDs. We used the appropriate equations from the online documentation describing the MegaPipe pipeline reduction process for MegaCam imaging111http://www2.cadc-ccda.hia-iha.nrc-cnrc.gc.ca/megapipe/docs/filters.html:
| (3) |
We also desired a more metal-rich template cluster than Pal 3 or 4. In the An et al. (2008) sample, only M71 fits the bill; however employing this cluster as a template was a complex procedure. M71 is relatively nearby, meaning that its more luminous RGB members are saturated in SDSS images. The An et al. (2008) fiducial is consequently truncated at a level just brighter than the HB. To circumvent this issue we adopted the M71 sequence from Clem et al. (2008). Unfortunately, these authors do not provide HB fiducials for their clusters, or a public archive of their photometry. Therefore, we had to merge the An et al. HB photometry onto the Clem et al. RGB fiducial. In principle this simply requires the straightforward use of Eq. 3 as in Mackey et al. (2010b); however An et al., when comparing their photometry to that of Clem et al., found a significant disagreement for M71 (note that all other clusters matched to a level better than ). They ascribe this discrepancy to substantial uncertainties in their zero points for the M71 SDSS imaging. To correct for this, we tested a grid of zero-point offsets in . Each combination of offsets was applied to the full An et al. M71 fiducial, which was then transformed using Eq. 3. We located the set of offsets producing the best match between this transformed sequence and that of Clem et al., and then applied this to the An et al. HB photometry to properly transform it onto the Clem et al. M71 scale.
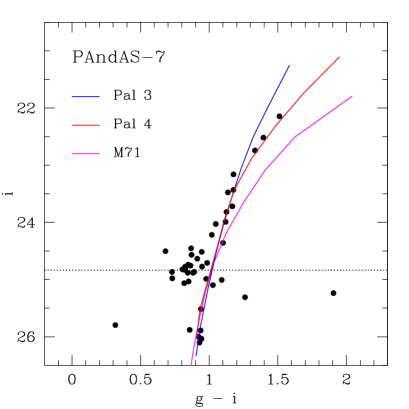
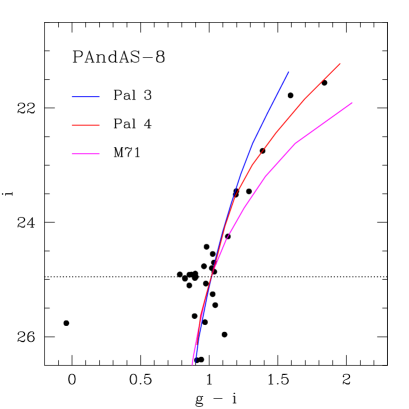
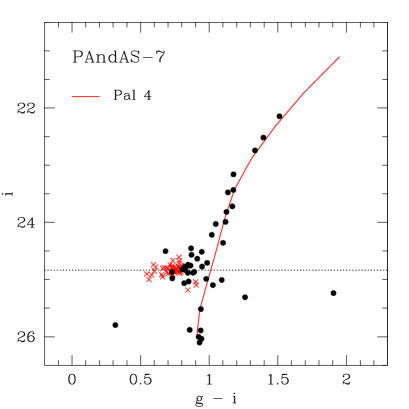
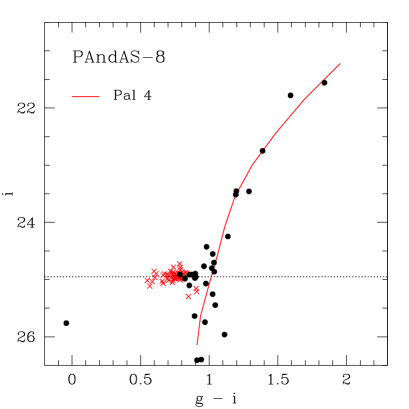
The results of our template alignment are presented in the upper panels of Figure 6. Based on the shape of the upper RGB, Palomar 3 is clearly more metal-poor than our M31 objects, while M71 is considerably more metal-rich. The 2011 update of the Harris (1996) globular cluster catalogue lists FeH and for these two objects, respectively. Palomar 4, on the other hand, provides an excellent upper RGB fit for both PA-7 and PA-8, indicating that they both share a similar metallicity to this globular cluster. The Harris catalogue lists FeH for Pal 4, commensurate with the value of FeH (statistical) (systematic) measured from high resolution spectroscopy by Koch & Côté (2010). However, other publications suggest it may be slightly more metal-rich than this – for example, the calcium triplet work of Armandroff, Da Costa & Zinn (1992) which returned a value FeH, or photometric studies from HST imaging which find FeH (e.g., Stetson et al., 1999; Dotter et al., 2011). Here we adopt FeH for Pal 4, and hence PA-7 and PA-8, but recognize a likely systematic uncertainty of dex in this quantity. Based on the quality of our photometry and the separation between the fiducial sequences of our template clusters, we estimate a statistical uncertainty of dex on our best-fit metallicity for PA-7 and PA-8.
The Harris catalogue lists a small colour excess for Pal 4, and an intrinsic distance modulus . Based on the vertical and horizontal shifts required to align the template fiducial with our photometry, the implied colour excess and distance modulus for PA-7 are and . For PA-8 we find and . Note that in deriving these quantities we have employed the extinction coefficients from Stoughton et al. (2002), specifically that . Our quoted uncertainties reflect only the precision with which we are able to align the fiducial sequences with our photometry – i.e., the uncertainties are obtained directly from those associated with the measured horizontal and vertical shifts.
Our measured colour excesses are in good agreement with predictions from the reddening maps of Schlegel, Finkbeiner & Davis (1998): and for PA-7 and PA-8, respectively. Similarly, our distance moduli match quite well the canonical M31 value (e.g., McConnachie et al., 2005). It is possible, at marginal significance, that PA-8 could be up to mag more distant than PA-7. This would imply a significant depth of up to kpc to the South-West Cloud along the line of sight. However, we must bear in mind the random uncertainties of mag on each of the distance measurements, and that these do not include any systematic components due to, for example, the photometric calibrations, transformation of the Pal 4 fiducial to the MegaCam photometric system, etc. It is therefore safe to say the distance estimates are consistent with each other, although it would not be surprising if there were a mild line-of-sight extension to the South-West Cloud.
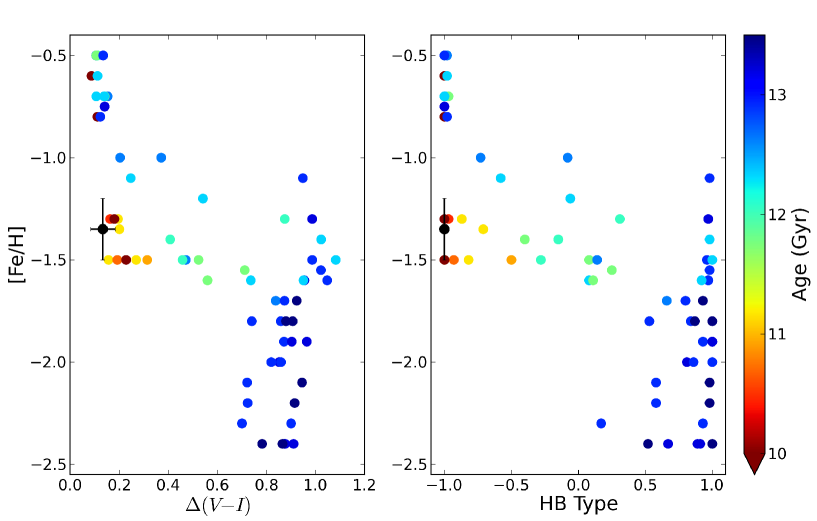
The distinctive HB morphology observed for our two M31 clusters provides an upper limit to their ages. To demonstrate this we consider the recent work of Dotter et al. (2010, 2011) who, using HST/ACS photometry, investigated HB morphology in nearly half the known Galactic globular clusters as a function of their other properties (in particular their ages and metal abundances). We reproduce one of the key results of this work (Figure 11 from Dotter et al., 2011) in Figure 7. This shows the relationship between a cluster’s age, HB morphology and FeH. HB morphology is parameterized using two different metrics. The first, introduced by Dotter et al. (2010), is the difference between the median colour of stars on the HB and the median colour of stars on the RGB at the HB level. The second is the commonly used ratio (e.g., Lee, Demarque & Zinn, 1994), where (alternatively, ) represents the number of HB stars lying to the blue (red) of the instability strip, and the number of RR Lyrae variables (i.e., the number of HB stars lying on the instability strip).
Irrespective of which HB metric is considered, it is clear that in the metallicity range FeH the morphology of the HB correlates strongly with the cluster age. The oldest objects in the Galactic system have very blue horizontal branches; those several Gyr younger have very red horizontal branches; and there is a relatively smooth transition in between. This metallicity range is the “sweet spot” for sensitivity to age – in more metal-rich clusters the HB morphology is driven predominantly by FeH such that it is exclusively red irrespective of age, while in more metal-poor clusters the correspondence with age is less clear as only very old systems are observed with FeH. Note that while there is some evidence that additional parameters – such as the central density of a cluster, or its helium abundance – may also affect HB morphology, in general these appear to be considerably less influential than both FeH and age (e.g., Dotter et al., 2010).
At FeH, our two M31 clusters fall directly in the region where the HB is most strongly sensitive to cluster age. Their very red HB morphologies indicate that they are likely to be at least Gyr younger than the oldest Galactic globulars. To demonstrate this explicitly we derive the parameters and for both objects. The latter metric is straightforward – all HB stars are red so the HB-type converges to . Although we do not explicitly know the position of the instability strip on the CMD, the HB-type of Pal 4 is also (e.g., Mackey & van den Bergh, 2005) and the lower panels of Figure 6 show that all HB stars in our two M31 clusters are redder than the bluest stars on the Pal 4 HB.
To calculate for a given cluster, we drew a box around the HB and calculated the median colour of the stars within it. Note that because we observed only a small number of HB stars () in each system, the median colour is somewhat sensitive, at a level of roughly mag, to the precise boundaries of the isolating box. In principle we should have followed a similar procedure to determine the median colour of the RGB at the HB level; however we possessed too few RGB stars for this calculation to be reliable. Instead, we adopted the colour of the best-fitting (shifted) Pal 4 fiducial at the HB level, and conservatively assumed a total uncertainty of mag on the difference between this quantity and the median colour of the HB. These two measurements gave us the quantity , which we converted to using the transformation procedure outlined by Martin et al. (2006) (see also Ibata et al., 2007; Huxor et al., 2008). For PA-7 we measured and for PA-8 we found . Both values are smaller than that seen for Pal 4, (Dotter et al., 2010), consistent with the lower panels in Figure 6.
Plotting the two HB metrics on Figure 7 confirms that PA-7 and PA-8 lie in a region inhabited only by Galactic globular clusters with ages at least Gyr younger than those for the oldest members of the Milky Way system.
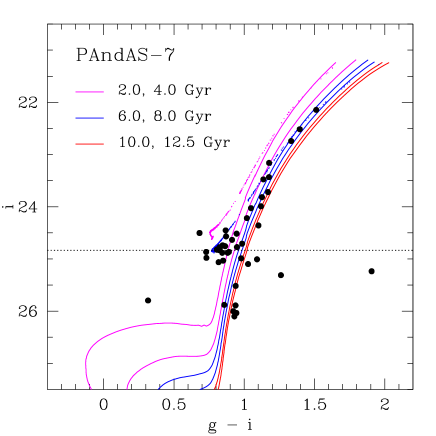
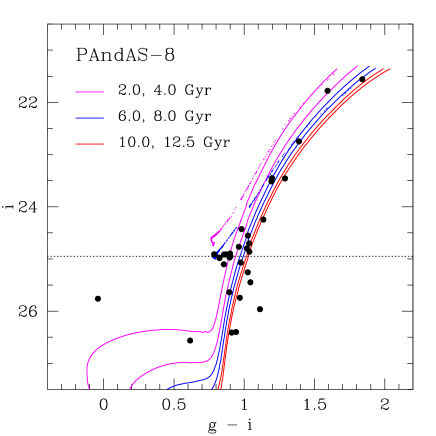
While this argument provides an upper bound to the ages of PA-7 and PA-8, it says nothing about how young these objects could be. To investigate this we fit Dartmouth isochrones and synthetic horizontal branches (Dotter et al., 2008b) of different ages to our CMDs. We assume FeH and an -element abundance equivalent to that observed for Palomar 4 – i.e., Fe (Koch & Côté, 2010). Note that our results are rather insensitive to the precise value adopted for the latter parameter.
Based on the level of the isochrone sub-giant branches, our faint detection limits of formally correspond to a minimum age of Gyr for PA-7 and PA-8. However, the implied distance moduli and foreground reddening levels necessary to correctly align such young isochrones on the cluster CMDs suggest that their ages are, in all probability, significantly greater than this. Figure 8 explicitly demonstrates this result. We plot isochrones ranging in age from Gyr to Gyr, shifted according to the best-fit distance moduli and foreground extinction values derived above from aligning the Palomar 4 fiducial. Because the colour of the RGB at the HB level is mildly sensitive to age in the sense that younger clusters have somewhat bluer RGB positions, applying these shifts does not lead to the youngest isochrones (or indeed their corresponding HB models) being well aligned; significantly larger values of and would be necessary to correct this. In numerical terms, aligning the Gyr isochrone on the PA-7 CMD implies and , and for PA-8 and . These foreground reddening levels are significantly greater than those predicted by the Schlegel et al. (1998) maps; note, however, that such a discrepancy is not out of the question (see e.g., Mackey et al., 2010b). More problematic would be the coincidence of this discrepancy with the unusually large implied distance moduli, which would place the clusters, respectively, and kpc behind the central disk of M31. Arguably a more satisfactory resolution is achieved by adopting an age in the range Gyr, in which case both and are much more consistent with expected values.
Isochrones with age Gyr can be aligned nicely with the CMDs if, in both cases, is about mag smaller and about mag smaller than our previous best-fit values. These are certainly within the bounds of acceptability; however as discussed previously the observed HB morphologies of our two M31 clusters exclude such an old age (Figure 7).
4 Discussion
The measurements presented here for PA-7 and PA-8 represent a new step in improving our understanding of the assembly of the outer halos and globular cluster systems of M31 and the Milky Way. As discussed in Section 3.1, the velocities of these objects are sufficiently similar to each other, and, given their large projected galactocentric radii, sufficiently different from the M31 systemic velocity, that it is very likely that they are not independent clusters but rather physically associated with the underlying South-West Cloud (although with the caveat that to establish the link directly will require velocities for stellar members of this overdensity). Collins et al. (2009) have previously shown that the extended M31 cluster HEC12 (also sometimes called EC4) shares a common velocity with the underlying halo feature known as Stream C. Apart from this, our measurements for PA-7 and PA-8 represent the strongest confirmation to date that some remote M31 halo globular clusters are members of stellar substructures – despite this commonly being assumed to be the case as a result of the statistically significant correlation between the spatial positions of many such objects and a number of the field halo substructures (Mackey et al., 2010a).
In this context the resolved properties of PA-7 and PA-8 take on added significance. We have shown that both have FeH, and both possess a strikingly red horizontal branch morphology for this metallicity that implies their ages must be at least Gyr younger than the oldest Galactic globular clusters. With such characteristics PA-7 and PA-8 would be unambiguously classified as members of the “young halo” subsystem in the Milky Way. Perina et al. (2012) have recently demonstrated that many halo globular clusters in M31 exhibit an even stronger second parameter effect than do the young halo clusters in the Milky Way. They attribute this to the M31 objects having formed Gyr later than their Milky Way counterparts, which is entirely consistent with our conclusions for PA-7 and PA-8.
As discussed in the introduction to this paper, there is a wealth of circumstantial evidence that the young halo population of globular clusters has been accreted into the outer Galaxy from now-defunct satellite systems; however, direct observations of this process in action are limited to a handful of members and ex-members of the Sagittarius dwarf. Our measurements provide new, independent evidence for close analogues of Galactic young halo clusters being accreted into the halo of a large spiral galaxy, in a manner entirely consistent with our understanding of the origin of the outer parts of the Milky Way globular cluster system.
The complementary viewpoint is also interesting. If we accept a priori that the available evidence renders the accretion picture largely correct for the Milky Way (despite very few clusters having been directly associated with stellar streams), then our observations of PA-7 and PA-8 are significant in that they explicitly demonstrate that objects with very similar, if not identical, properties to the accreted members of the Galactic system are also being accreted into M31. In fact, combined with the results of Mackey et al. (2010a) and Perina et al. (2012), our results suggest that this process has occurred on a grand scale in M31. This would add credence to the idea that such processes play a key role in determining the composition of globular cluster systems in large spiral galaxies in general. It is of considerable interest to extend our study to include resolved observations of a more statistically robust number of globular clusters lying on (and off) a wide variety of M31 substructures in order to test how far the similarities with the outer Galactic globular cluster system stretch.
A number of authors (e.g., Marín-Franch et al., 2009; Forbes & Bridges, 2010; Dotter et al., 2010, 2011) have demonstrated that the age-metallicity relation (AMR) for Galactic globular clusters exhibits two distinct loci – one at almost constant old age ( Gyr) and a second branching to younger ages at FeH. The younger branch is composed mainly of young halo clusters including several of those associated with the Sagittarius dwarf. It is interesting to consider PA-7 and PA-8 in this setting. Our measured FeH places these two objects just above the branch-point on the Galactic globular cluster AMR. At this metallicity, Galactic globular clusters are seen with ages up to Gyr younger than the oldest members of the system (see e.g., Figure 7). As discussed in Section 3.2, we formally constrain the ages of PA-7 and PA-8 to lie in the range Gyr; however in all likelihood they have ages older than Gyr. Thus it is quite possible that these two objects fit well with the younger branch of the Galactic globular cluster AMR, in which case their galaxy of origin – the progenitor of the South-West Cloud – should have had a cluster enrichment history similar to those satellite galaxies which have deposited their members in the outer Milky Way.
On the other hand, it is also possible that PA-7 and PA-8 have younger ages than any known Galactic globular cluster at their metallicity, in which case the implied cluster enrichment history of the SW Cloud progenitor would be comparatively rather slow, perhaps akin to that seen in the SMC. Note that a handful of globular clusters with ages as young as Gyr are seen in the Milky Way (e.g., Palomar 1 and 12, and Terzan 7); however these objects are all considerably more metal-rich than PA-7 and PA-8, with FeH. At least two (Pal 12 and Ter 7) are associated with the Sagittarius dwarf. To more accurately constrain the ages of PA-7 and PA-8, and thus learn something about the cluster AMR of their host galaxy, would require observations approaching their main-sequence turn-offs on the CMD – which at present can only be achieved with HST. Failing this, multicolour broadband integrated photometry could be used to place less stringent constraints on the ages of these two objects.
5 Summary & Conclusions
In this paper we have presented spectroscopy and colour-magnitude diagrams for two newly-discovered globular clusters in the remote halo of M31. These two objects, PA-7 and PA-8, project onto a field substructure known as the South-West Cloud, leading previous authors (e.g., Mackey et al., 2010a) to suggest that they have probably been accreted into the M31 system. We measure radial velocities of km s-1 for PA-7 and km s-1 for PA-8. These are rather similar to each other, especially given their moderately large separation from the M31 systemic velocity. Based on the known velocity dispersion of metal-poor stellar populations in the outer parts of the M31 halo, we used a simple Monte Carlo model to show that observing velocities similar to those for PA-7 and PA-8 is rather unlikely if these objects are completely independent, with a probability of . This result reinforces the link between PA-7, PA-8 and the SW Cloud and provides strong evidence that these clusters have indeed been accreted into the M31 halo.
Our colour-magnitude diagrams indicate that both PA-7 and PA-8 have metallicities FeH. A reference fiducial for the remote Galactic globular cluster Palomar 4 provides an excellent fit to the red giant branches in both clusters. From the horizontal and vertical shifts necessary to correctly align the Pal 4 sequence we derive foreground extinctions consistent with those predicted by the reddening maps of Schlegel et al. (1998) and distance moduli commensurate with the canonical M31 distance. PA-8 is up to mag ( kpc) more distant than PA-7 at marginal significance; if this observation is correct then it implies a moderate line-of-sight depth to the SW Cloud that could, in future, be used to help constrain the geometry of the orbit of its progenitor galaxy.
The most striking aspect of the PA-7 and PA-8 colour-magnitude diagrams is the extremely short, red horizontal branch morphology exhibited by both clusters. In the Galactic halo, clusters with similar FeH and HB morphology are exclusively Gyr younger than the oldest members of the system. This implies that PA-7 and PA-8 are very likely to have similarly young ages. Formally, our lower age limit for both clusters is Gyr; however we provide circumstantial arguments that they are probably Gyr in age. Our observations provide strong evidence for young globular clusters being accreted into the halo of a large spiral galaxy, in a manner entirely consistent with our picture for the assembly of the outer Milky Way globular cluster system. These results further add credence to the idea that such processes play a central role in determining the composition of globular cluster systems in large spiral galaxies in general.
Acknowledgments
We would like to thank Aaron Dotter for his help in constructing Figure 7. We appreciate suggestions from the referee which helped improve the manuscript. ADM is grateful for support by an Australian Research Fellowship (Grant DP1093431) from the Australian Research Council. AMNF, ADM, and APH acknowledge support by a Marie Curie Excellence Grant from the European Commission under contract MCEXT-CT-2005-025869 during which this work was initiated. GFL thanks the Australian Research Council for support through his Future Fellowship (FT100100268) and Discovery Project (DP110100678).
This paper is based on observations obtained at the Gemini Observatory, which is operated by the Association of Universities for Research in Astronomy, Inc., under a cooperative agreement with the NSF on behalf of the Gemini partnership: the National Science Foundation (United States), the Science and Technology Facilities Council (United Kingdom), the National Research Council (Canada), CONICYT (Chile), the Australian Research Council (Australia), Ministério da Ciência e Tecnologia (Brazil) and SECYT (Argentina). These observations were obtained under programs GN-2008B-Q-22, GN-2010B-Q-19, and GN-2011B-Q-61.
References
- Alves-Brito et al. (2009) Alves-Brito A., Forbes D.A., Mendel J.T., Hau G.K.T., Murphy M.T., 2009, MNRAS, 395, L34
- An et al. (2008) An D., et al., 2008, ApJS, 179, 326
- Armandroff et al. (1992) Armandroff T.E., Da Costa G.S., Zinn R., 1992, AJ, 104, 164
- Bellazzini et al. (2003) Bellazzini M., Ferraro F.R., Ibata R.A., 2003, AJ, 125, 188
- Chapman et al. (2006) Chapman S.C., Ibata R., Lewis G.F., Ferguson A.M.N., Irwin M., McConnachie A., Tanvir N., 2006, ApJ, 653, 255
- Clem et al. (2008) Clem J.L., Vanden Berg D.A., Stetson P.B., 2008, AJ, 135, 682
- Cohen (2004) Cohen J.G., 2004, AJ, 127, 1545
- Collins et al. (2009) Collins M.L.M., et al., 2009, MNRAS, 396, 1619
- Da Costa & Armandroff (1995) Da Costa G.S., Armandroff T.E., 1995, AJ, 109, 2533
- Dotter et al. (2008a) Dotter A., Sarajedini A., Yang S., 2008a, AJ, 136, 1407
- Dotter et al. (2008b) Dotter A., Chaboyer B., Jevremović D., Kostov V., Baron E., Ferguson J.W., 2008b, ApJS, 178, 89
- Dotter et al. (2010) Dotter A., et al., 2010, ApJ, 708, 698
- Dotter et al. (2011) Dotter A., Sarajedini A., Anderson J., 2011, 738, 74
- Ferguson et al. (2002) Ferguson A.M.N., Irwin M.J., Ibata R.A., Lewis G.F., Tanvir N.R., 2002, AJ, 124, 1452
- Forbes & Bridges (2010) Forbes D.A., Bridges T., 2010, MNRAS, 404, 1203
- Galleti et al. (2004) Galleti S., Federici L., Bellazzini M., Fusi Pecci F., Macrina S., 2004, A&A, 416, 917
- Harris (1996) Harris W.E., 1996, AJ, 112, 1487
- Hilker (2006) Hilker M., 2006, A&A, 448, 171
- Hook et al. (2004) Hook I., Jørgensen I., Allington-Smith J.R., Davies R.L., Metcalfe N., Murowinski R.G., Crampton D., 2004, PASP, 116, 425
- Huxor et al. (2005) Huxor A.P., Tanvir N.R., Irwin M.J., Ibata R., Collett J.L., Ferguson A.M.N., Bridges T., Lewis G.F. 2005, MNRAS, 360, 1007
- Huxor et al. (2008) Huxor A.P., Tanvir N.R., Ferguson A.M.N., Irwin M.J., Ibata R.A., Bridges T., Lewis G.F., 2008, MNRAS, 385, 1989
- Huxor et al. (2011) Huxor A.P., et al., 2011, MNRAS, 414, 770
- Ibata et al. (1994) Ibata R.A., Gilmore G., Irwin M.J., 1994, Nature, 370, 194
- Ibata et al. (1995) Ibata R.A., Gilmore G., Irwin M.J., 1995, MNRAS, 277, 781
- Ibata et al. (2007) Ibata R., Martin N.F., Irwin M., Chapman S., Ferguson A.M.N., Lewis G.F., McConnachie A.W., 2007, ApJ, 671, 1591
- Keller et al. (2012) Keller S.C., Mackey A.D., Da Costa G.S., 2012, ApJ, 744, 57
- Koch & Côté (2010) Koch A., Côté P., 2010, A&A, 517, A59
- Law & Majewski (2010) Law D.R., Majewski S.R., 2010, ApJ, 718, 1128
- Lee et al. (1994) Lee Y.-W., Demarque P., Zinn R.J., 1994, ApJ, 423, 248
- Lewis et al. (2012) Lewis, G.F., et al., 2012, submitted
- Mackey & Gilmore (2004) Mackey A.D., Gilmore G.F., 2004, MNRAS, 355, 504
- Mackey & van den Bergh (2005) Mackey A.D., van den Bergh S., 2005, MNRAS, 360, 631
- Mackey et al. (2010a) Mackey A.D., et al., 2010a, ApJ, 717, L11
- Mackey et al. (2010b) Mackey A.D., et al., 2010b, MNRAS, 401, 533
- Marín-Franch et al. (2009) Marín-Franch A., et al., 2009, ApJ, 694, 1498
- Martin et al. (2006) Martin N.F., Ibata R.A., Irwin M.J., Chapman S., Lewis G.F., Ferguson A.M.N., Tanvir N., McConnachie A.W., 2006, MNRAS, 371, 1983
- Martínez-Delgado et al. (2002) Martínez-Delgado D., Zinn R., Carrera R., Gallart C., 2002, ApJ, 573, L19
- Martínez-Delgado et al. (2004) Martínez-Delgado D., Dinescu D.I., Zinn R., Tutsoff A., Côté P., Boyarchuck A., 2004, in Prada F., Martínez-Delgado D., Mahoney T.J., eds, ASP Conf. Ser. 327, Satellites and Tidal Streams. Astron. Soc. Pac., San Francisco, p. 255
- McConnachie et al. (2005) McConnachie A.W., Irwin M.J., Ferguson A.M.N., Ibata R.A., Lewis G.F., Tanvir N., 2005, MNRAS, 356, 979
- McConnachie et al. (2009) McConnachie A.W., et al., 2009, Nature, 461, 66
- McConnachie et al. (2010) McConnachie A.W., Ferguson A.M.N., Irwin M.J., Dubinski J., Widrow L.M., Dotter A., Ibata R., Lewis G.F., 2010, ApJ, 723, 1038
- Olszewski et al. (2009) Olszewski E.W., Saha A., Knezek P., Subramaniam A., de Boer T., Seitzer P., 2009, AJ, 138, 1570
- Perina et al. (2012) Perina S., Bellazzini M., Buzzoni A., Cacciari C., Federici L., Fusi Pecci F., Galleti S., 2012, A&A, 546, 31
- Richardson et al. (2011) Richardson J.C., et al., 2011, ApJ, 732, 76
- Schlegel et al. (1998) Schlegel D.J., Finkbeiner D.P., Davis M., 1998, ApJ, 500, 525
- Searle & Zinn (1978) Searle L., Zinn R., 1978, ApJ, 225, 357
- Sohn et al. (2003) Sohn Y.-J., et al., 2003, AJ, 126, 803
- Sollima et al. (2012) Sollima A., Gratton R.G., Carballo-Bello J.A., Martínez-Delgado D., Carretta E., Bragaglia A., Lucatello S., Peñarrubia J., 2012, MNRAS, in press (arXiv:1207.6263)
- Stetson (1987) Stetson P.B., 1987, PASP, 99, 191
- Stetson et al. (1999) Stetson P.B., et al., 1999, AJ, 117, 247
- Stoughton et al. (2002) Stoughton C., et al., 2002, AJ, 123, 485
- Tonry & Davis (1979) Tonry J., Davis M., 1979, AJ, 84, 1511
- Zinn (1993) Zinn R., 1993, in Smith G.H., Brodie J.P., eds, ASP Conf. Ser. 48, The Globular Cluster-Galaxy Connection. Astron. Soc. Pac., San Francisco, p. 38