1–6
Opening the 100-Year Window for Time Domain Astronomy
Abstract
astronomical data bases: catalogues, surveys; STARS: variables; galaxies: active
keywords:
\pagerange1–61 Introduction
As was clear from the 2010 US Astronomy and Astrophysics Decadal Survey, which ranked LSST as the highest-priority project for ground-based astronomy, Time Domain Astronomy (TDA) has emerged as a key field of current astronomy and astrophysics. The temporal domain offers new routes to astrophysical understanding of extreme phases of stellar and galaxy evolution through studies of novæ, supernovæ, gamma-ray bursts and AGN, to list only a few. Wide-field and/or temporal surveys of long duration can discover and study binaries in various phases of evolution, some with exotic stellar components such as black holes, or add to the increasingly rich harvest of exoplanets. But while these extreme events or phenomena have short time-scales (hours to months), astronomical time-scales are predominantly long, often measured in millenia or even 103-6 times longer still. Time-scales appreciably longer than the duration of a given survey require the assimilation of large samples of objects at different evolutionary (or binary) phases in order to piece together temporal histories. Now that we have the possibility to digitize archived plate collections of large and (nearly) continuous duration and totalling many images, it is possible to initiate and conduct studies in the emerging field of Historical TDA for very large samples of objects on time-scales that are at least an order of magnitude longer than was possible before. That was the prime motivation for the DASCH project (Digital Access to a Sky Century Harvard).
2 Development of DASCH and Current Status
The Harvard College Observatory plate collection is the world’s largest, containing some 450,000 direct plates. As described elsewhere in these Proceedings—see LABEL:Grindlay_&_Griffin, it has approximately uniform full-sky coverage from 1890 to 1990. The DASCH project (http://hea-www.harvard.edu/DASCH/) was initiated to digitize all the plates and make their digital images (400 Tb) and reduced photometric data available on line ([Grindlay et al. 2009, Grindlay et al. 2009]; Grindlay et al., in preparation). DASCH incorporates the world’s fastest and most astrometrically precise plate scanner ([Simcoe et al. 2006, Simcoe et al. 2006]) and a powerful astrometric and photometric reduction pipeline ([Laycock, S. et al., Laycock et al. 2010]). Over the 5-year development phase of the scanner and reduction software, both the astrometry ([Servillat et al. 2011, Servillat et al. 2011]) and the photometry (Tang et al., in preparation) were further optimized while scanning about 19,500 plates from five fields selected for having calibrated sequences and a range of stellar densities. A semi-automated plate-cleaning machine is in the final stages of development; it will clean the glass back-side of each plate more quickly than the 80 seconds that it takes for an operating sequence of loading–scanning–unloading a standard-size plate of 30 cm 25 cm (they are scanned two at a time). Full “production scanning” and processing of some 400 standard plates per day can commence later this year when two such cleaning machines are ready. Scanning of the whole collection of direct plates, together with associated photometric reduction and population of the MySQL database, will require approximately 4 years. For each resolved object the database contains positions (J2000), magnitudes, and a list of processing flags. Full processing into the database for all 400 plates scanned each day can be accomplished overnight.
3 DASCH vs. Current and Planned TDA Surveys
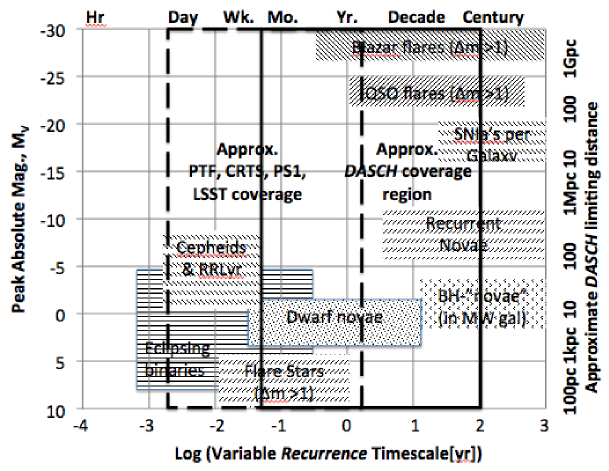
In about 2 years the northern high latitude ( 10∘) full sky from DASCH will be on-line and available for access and analysis. The 100-year temporal coverage, compared with 10 years of coverage by PTF and CRTS and the several epochs of SDSS, will enable new studies of long time-scale phenomena. Several examples are shown in Fig. 1, where variable classes are plotted by their approximate ranges of absolute magnitude (MV) against recurrence time-scale. Recurrence time-scales are chosen instead of variability time-scales because they signal better which objects can be discovered and measured. Recurrence (or occurrence) is unambiguous, whereas a variability time-scale can only be measured if there is nearly complete temporal coverage; in practice, that is only available for a continuous-viewing space mission like Kepler. The PTF and PS1 surveys have typical observing cadences (for a given sky region) of at least 1 day, though more frequent sampling is being achieved for limited fields with PTF. LSST will be comparable, whereas for DASCH the average observation cadence is about 2 weeks, though can be as short as 30 minutes on plates with multiple (offset) exposures of a given field. That sets the minimum recurrence time-scale that can be measured; the maximum is limited by the total duration of the survey. All the surveys can cover the same MV range, but of course the corresponding distance range differs by the apparent magnitude limit of each survey. We plot on the right of Fig. 1 an approximate distance scale out to which each class of variable or recurrently variable object can be detected. For DASCH we adopted an approximate limiting magnitude of mV = 15, which is appropriate for an assumed () = 1; it corresponds to the mean DASCH limiting photographic () magnitude mB 14 measured on the 19,500 plates scanned thus far.
The recurrence times for various classes are taken from the literature, and are either uncertain by the ranges shown (e.g., the recurrence time-scale range for black-hole “novæ” is based on just 3 objects) or are an estimated range given by systematic effects (such as the metallicity and and red-shift of SN Ia hosts). Recurrence-time ranges ending at the right side of the plot (e.g., for bright blazar flares) are simply lower limits. The recurrence times for large flares (m 1) from flare stars or QSOs are estimates based on variability studies against luminosity. The overall conclusion is simply that by expanding TDA surveys to time-scales that are 1 or 2 orders of magnitude longer than those reached by current or immediately projected modern surveys, a range of fundamental classes of objects can be studied as “individual” objects in well-defined (complete) samples. Those could include measuring the SN Ia rate in the Virgo cluster, or the outburst recurrence times for the full set of the 20 or so currently known black-hole transients in the Galaxy. For each, recurrence time-scales can be measured or limited in the “local” Universe and then tested for red-shift dependence using much more distant samples of differing objects in the modern TDA surveys.
4 Current DASCH Processing
4.1 Photometry
Photometric analyses developed by [Laycock, S. et al., Laycock et al. 2010], and recently further improved by Tang et al. (in preparation), yield rms uncertainties of 0.10 mag over the full range of century of data from the 9 or so series of plates that contribute to a typical light curve, despite differences in plate scale, image quality and any systematic effects. The basic approach employs SExtractor as the object detection and isophotal photometry engine for instrumental magnitude determination by using the now global Hubble Guide Star catalogue (GSC2.3) for a large sample of calibrators present on every plate, thereby allowing both global and local calibrations. Calibration curves are first derived in annular bins to account for vignetting, by fitting instrumental magnitudes against GSC2.3 magnitudes () for an initial photometric solution. That initial calibration is followed by local corrections to remove spatially-dependent plate effects (usually in the emulsion) or sky-related effects (atmospheric extinction and clouds). The GSC2.3 catalogue is not ideal since its photometric precision is only 0.2 mag and it is predominantly in a single band (photographic ). Fortunately, the all-sky APASS CCD survey (www.aavso.org/apass) described by LABEL:Henden has Johnson and as well as Sloan , and , and will improve significantly both the precision and, particularly, the colour corrections for DASCH photometry. APASS is now partly available and should be full-sky by 2013.
5 Representative Early DASCH Results
The five fields scanned in the DASCH development phase are centred on M44, 3C273, Baade’s Window, Kepler Field and the LMC. For the first three, plates were simply selected if they contained the object (or the centre of Baade’s Window) on the plate, and at least 1 cm from the plate edge, or approximately interior to “bin 9”, the outermost annular bin or the outermost 5 mm of the plate where both astrometry and photometry can have large errors. The coverage obtained from that mode of plate selection was increasingly incomplete with radial distance from the target object. For both the Kepler Field and LMC, which are each extended regions, a wider boundary of plate-centre coordinates was applied when selecting plates to ensure more complete coverage of the full object. Only the M44 and Kepler Fields have been analyzed in detail, though exploratory results have been obtained for the other 3 fields and will be reported soon: for 3C273 (Grindlay et al., in preparation) and for a classical nova discovered in Baade’s Window (Tang et al., in preparation). The M44 study led to the discovery of long-term dimming in a population of K giants ([Tang et al. 2010, Tang et al. 2010]). As a follow-up, more slowly-variable K giants were found in the Kepler Field and studied with the higher time-coverage of Kepler data (Tang et al., in preparation). The variability study of the Kepler Field also led to the discovery of a dust-accretion event in the binary star KU Cyg ([Tang et al. 2011, Tang et al. 2011]).
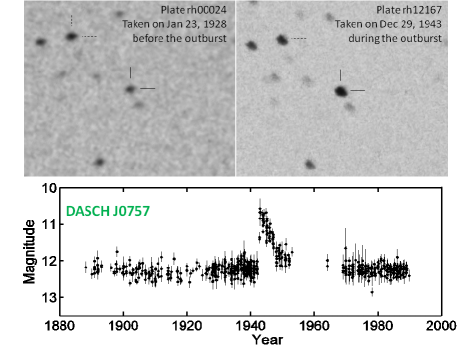
A third, and perhaps most dramatic, example from DASCH is a new type of stellar variability, also discovered in the M44 field (Tang et al. 2012), and is illustrated in Fig. 2. Observations with the telescopes at the Harvard-Smithsonian FLWO observatory in Arizona for spectroscopic classification of DASCH variables revealed that this star was an M0 III giant. Comparison with the ASAS CCD photometric survey ([Pojmanski 2002, Pojmanski 2002]) revealed it to be a semi-detached binary with a 119.2-day period and an amplitude of 0.16 mag in the band. As described in detail by Tang et al. (2012), the cool giant’s companion is a white dwarf, and we surmise that the remarkable flare in 1942 and its subsequent 10-year decline was most probably due to nuclear H-shell burning. The lack of emission lines from this symbiotic nova is new, but is consistent with the behaviour of some other old novæ and may also imply little or no ejection of the envelope mass (3 10-5 ) that is required for ignition on what is probably a 0.6- white dwarf.
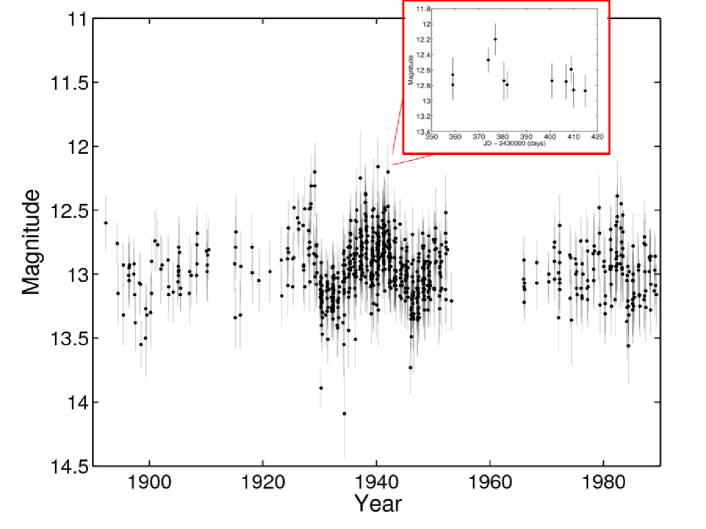
We include a brief summary of the DASCH light curve for the bright quasar/blazar 3C273, which is discussed in detail by Grindlay et al. (in preparation). Its 100-year light curve (Fig. 3) demonstrates the long-term variability of this luminous AGN. The inset shows a “flare” in 1941 with characteristic rise and fall times of about 3 days (and there are several other examples). Time-scales of 1–30 days for brightening are evident in the overall light curve, and are comparable to the optical and infra-red variability for 3C273 reported by [Courvoisier et al. 1988, Courvoisier et al. (1988)], who found that the fastest variations were of the order of 1 day but their observations were too short to measure the longer-term variations detected with DASCH. The dominant power in the DASCH variability spectrum is over longer time-scales like 0.5–2 years (such as the abrupt decline in flux from about 1927–1930), and provides constraints on the size of the optical emission region.
6 DASCH Database
The DASCH Pipeline ([Los et al. 2010, Los et al. 2010]) and database software run on a high-speed computer cluster and RAID disk system. In production mode it can process (overnight) the full Pipeline for the nominal 400 plates scanned in a day, to populate a MySQL database with photometric values and errors for each of the resolved stellar images; typically there are 50,000 on a standard plate but there are more on “A” plates. Light curves are generated very rapidly for any object by extracting from the database the magnitudes thus determined from all plates, or only those with magnitude measures meeting a set of user-selected criteria. Variability measures and tests of their validity can then be derived readily. Additional variability analysis tools are being developed, and will be made available when the full database becomes public.
The full DASCH output database of 450,000 plate images and derived
magnitudes for each resolved object (1Pb in total!) will be made
available for world access as it is completed incrementally. The
present plans are to digitize the northern sky at Galactic latitudes
10∘ first, to allow comparisons with existing surveys such
as SDSS, PTF, Pan-STARRS-1 and the CRTS. That
stage could be completed by mid-2013. Given the difference in limiting
magnitudes (up to 14–18 for DASCH against 20–22 for the modern surveys),
such comparisons will be mainly for context or extreme transients. The
southern sky above/below the Galactic plane will come next, with expected
completion in early 2015, followed by the Galactic Plane by mid-2016—or still
well before LSST. The reason for doing the Galactic Plane and Bulge last is to
allow time to develop analysis of crowded-field photometry further by invoking
point-spread function (psf) and image subtraction techniques in order to
improve the present isophotal photometry used for SExtractor. Experiments have
recently been undertaken to optimise the use of PSFEx+SExtractor for magnitude-
and position-dependent fitting of the plate psf.
Acknowledgements.
We thank the DASCH team and gratefully acknowledge support for DASCH by the HCO, the NSF (grants AST0407380 and AST0909073), and by the Cornel and Cynthia K. Sarosdy Fund for DASCH.References
- [Courvoisier et al. 1988] Courvoisier, T.J.L., et al. 1988, Nature, 335, 330
- [Grindlay et al. 2009] Grindlay, J.E., et al. 2009, ASPC, 410, 101
- [Johnson & Winn 2004] Johnson, J.A., & Winn, J. 2004, AJ, 127, 2344
- [Johnson et al. 2005] Johnson, J.A., et al. 2005, AJ, 129, 1978
- [Laycock, S. et al.] Laycock, S., et al. 2010, AJ, 140, 1062
- [Los et al. 2010] Los, E., Grindlay, J., Tang, S., Servillat, M., & Laycock, S. 2010, ASPC, 442, 269
- [Pojmanski 2002] Pojmanski, G. 2002, Acta Astronomica, 52, 397
- [Servillat et al. 2011] Servillat, M., Los, E., Grindlay, J., Tang, S., & Laycock, S. 2011, ASPC, 442, 273
- [Simcoe et al. 2006] Simcoe, R., et al. 2006, Proc. SPIE, 6312, 17
- [Tang et al. 2010] Tang, S., Grindlay, J., Los, E., & Laycock, S. 2010, ApJ, 710, L77
- [Tang et al. 2011] Tang, S., Grindlay, J., Los, E., & Servillat, M. 2011, ApJ, 738, 7
- [Tang et al. 2012] Tang, S., et al. 2012, ApJ, submitted