The nature and nurture of bars and disks
Abstract
The effects that interactions produce on galaxy disks and how they modify the subsequent formation of bars need to be distinguished to fully understand the relationship between bars and environment. To this aim we derive the bar fraction in three different environments ranging from the field to Virgo and Coma clusters, covering an unprecedentedly large range of galaxy luminosities (or, equivalently, stellar masses). We confirm that the fraction of barred galaxies strongly depends on galaxy luminosity. We also show that the difference between the bar fraction distributions as a function of galaxy luminosity (and mass) in the field and Coma cluster are statistically significant, with Virgo being an intermediate case. The fraction of barred galaxies shows a maximum of about at in clusters, whereas the peak is shifted to in the field. We interpret this result as a variation of the effect of environment on bar formation depending on galaxy luminosity. We speculate that brighter disk galaxies are stable enough against interactions to keep their cold structure, thus, the interactions are able to trigger bar formation. For fainter galaxies the interactions become strong enough to heat up the disks inhibiting bar formation and even destroying the disks. Finally, we point out that the controversy regarding whether the bar fraction depends on environment could be resolved by taking into account the different luminosity ranges probed by the galaxy samples studied so far.
1 Introduction
It is commonly accepted that galaxy bars spontaneously form due to instabilities in dynamically cold disks (Ostriker & Peebles, 1973). The growth rate of bars depends on the halo-to-disk mass ratio and the velocity dispersions of the disk and halo (Athanassoula & Sellwood, 1986) and bars grow faster in massive and cold disks. Moreover, environmental processes can regulate the life cycle of bars contributing both to their development by forcing disk instabilities and to their destruction via disk heating (Friedli, 1999).
The role of environment in triggering the formation of bars has been a matter of discussion for a long time. A variety of methods to detect bars in galaxy disks and measure the local galaxy density have been adopted, but the results on the correlation between the bar fraction and environment are controversial. Since the early work by Thompson (1981) who claimed that the bar fraction of Coma galaxies increases toward the core of the cluster, similar results were found for the Virgo and Fornax clusters (Andersen, 1996; Eskridge et al., 2000) and for intermediate redshift clusters (Barazza et al., 2009). Furthermore, some authors measured an increase of the bar fraction in galaxy pairs (Kumai et al., 1986; Elmegreen et al., 1990; Giuricin et al., 1993; Varela et al., 2004). Recently, Barway et al. (2011) have found that fainter lenticular galaxies in clusters show a higher bar fraction than their counterparts in the field, and Skibba et al. (2012), using clustering methods, have argued that barred galaxies tend to populate high density environments. In contrast, other authors reported that environment does not play a major role in bar formation. According to van den Bergh (2002), and later to Aguerri et al. (2009) and Li et al. (2009), the bar fraction strongly depends on the properties of the host galaxies but not on their environment. Also Lee et al. (2012) claimed that the bar fraction does not depend on the environment when colour and central velocity dispersion are fixed. Méndez-Abreu et al. (2010) and Nair & Abraham (2010) pointed out that galaxy mass is the main parameter driving the bar formation and observed that bars are hosted by galaxies in a tight range of masses. Martínez & Muriel (2011) found that the bar population does not significantly depend neither on group mass nor on the distance to the nearest neighbour. Giordano et al. (2011) compared two carefully selected samples representative of isolated and cluster galaxies, whereas Marinova et al. (2012) investigated the bar fraction in lenticular galaxies across different environments which span two orders of magnitude in galaxy density. Neither of them found significant differences.
Despite the fact that bars naturally appear in simulations of galaxy formation once a dynamically cold and rotationally-supported disk is in place (Athanassoula, 2005), the use of bars as tracers of disks has not been so commonly adopted (but see Barazza et al., 2009). As for bars, the influence of environment in the formation and evolution of disks has been widely investigated. Physical mechanisms taking place in galaxy clusters, such as harassment, ram pressure stripping, tidal effects and mergers, and starvation, were proposed for heavily transforming the morphology of disks or even destroying them (Boselli & Gavazzi, 2006). Therefore, since the environment strongly affects the stellar and/or gaseous component of disks, it is customary to think that environmental effects have a direct influence on the formation of bars.
In this Letter we derive the bar fraction in three different galaxy environments ranging from the field to the Virgo and Coma clusters. The unprecedentedly large range of luminosities (or, equivalently, stellar masses) covered by the different galaxy samples we investigate allows us to distinguish the effects of environment in heating galaxy disks from those triggering bar formation. Throughout the paper we assume a flat cosmology with , , and a Hubble parameter H km s-1 Mpc-1.
2 Galaxy sample
Four galaxy samples were selected in order to analyze three different galaxy environments: the field, the Virgo cluster, and the Coma cluster.
The first galaxy sample (hereafter field1 sample) covers the low galaxy density regime and was taken from Aguerri et al. (2009). They selected a volume-limited sample of galaxies available in the Sloan Digital Sky Survey Data Release 5 (SDSS-DR5, Adelman-McCarthy et al., 2007) in the redshift range . The local projected number density around each sample galaxy was computed using the distance of the galaxy to its fifth nearest neighbour galaxy (Balogh et al., 2004). About of the galaxies are located in very low-density environments ( Mpc-2), whereas the remaining reside in loose ( Mpc-2) and compact ( Mpc-2) galaxy groups. Only the galaxies in the lowest local density bin were included in the field1 sample, thus containing 2389 galaxies in the magnitude range .
In order to extend our analysis to fainter field galaxies, we selected all the galaxies in the SDSS-DR7 (Abazajian et al., 2009) within km s-1 and in the magnitude range . This is our second galaxy sample (hereafter field2 sample) and it consists of 352 galaxies. They are a subsample of the isolated galaxies studied in Sánchez-Janssen et al. (2010) and represent a volume-limited sample complete out to .
The third galaxy sample (hereafter Virgo sample) is composed of galaxies belonging to the Virgo cluster and was taken from Zarattini et al. (in prep.). Cluster members were selected to be extended sources in the SDSS-DR7 with , within one virial radius from the position of M87 (Mamon et al., 2004), and with recession velocities available within km s-1 with respect to the redshift of Virgo cluster. This velocity range corresponds to a cut on the velocity distribution of the Virgo cluster galaxies (Binggeli et al., 1987). For galaxies without spectroscopy, the cluster members were selected to have a color less than 0.2 mag above the value of the red sequence fit (Méndez-Abreu et al., 2010). Spurious background objects were rejected by a visual inspection of their morphology following the prescriptions of Michard & Andreon (2008). The resulting Virgo sample is composed of 588 galaxies in the magnitude range .
The fourth galaxy sample (hereafter Coma sample) includes galaxies belonging to the Coma cluster and were selected by Méndez-Abreu et al. (2010). They are extended sources in SDSS-DR6 (Adelman-McCarthy et al., 2008) with and within a -arcmin radius from the position of every pointing of the Hubble Space Telescope Advanced Camera for Surveys (HST-ACS) Coma Cluster Treasury Survey (Carter et al., 2008). All the galaxies with spectroscopy have a recession velocity within km s-1 with respect to the Coma cluster. This corresponds to a cut on the velocity distribution of the Coma cluster galaxies (Colless & Dunn, 1996). As for the Virgo members, also the Coma photometric members were selected to have a color less than 0.2 mag above the value of the red sequence fit and their morphology was inspected to reject background objects. The Coma sample consists of 169 galaxies with and located mainly in the cluster center.
In an effort to homogenize the dataset, the axial ratios, and apparent magnitudes of all the galaxies in the four samples were retrieved from the latest available SDSS data release (SDSS III; Aihara et al. 2011). For our analysis we considered only the galaxies with ( and being the semimajor and semiminor axis lengths of the galaxies) in order to deal with projection effects. It is worth mentioning that the galaxy images of field2, Virgo, and Coma samples have a similar spatial resolution. Indeed, the farthest galaxies (i.e., those in the Coma sample) were analyzed by studying the HST images. At the distance of the Coma cluster (100 Mpc), the resolution of HST-ACS () corresponds to about pc. This gives essentially the same physical resolution as SDSS observations have in the field2 or in the Virgo cluster, and it allows us to resolve bars down to sizes of pc. The field1 sample has a similar resolution for the closest galaxies but the mean resolution of the sample is kpc (Aguerri et al., 2009). However, since the field1 galaxies are the brightest (and, therefore, largest) galaxies in our sample, bars smaller than the resolution limit should be considered as nuclear bars and therefore they are not the subject of this paper.
Another caveat could be due to the fact that on average cluster galaxies are redder than in the field. To avoid a possible color bias, we computed the stellar mass from the color following Zibetti et al. (2009).
3 Identification of disks and detection of bars
We adopted the morphological classification of the galaxies in the SSDS-DR7 spectroscopic sample given by Huertas-Company et al. (2011). They divided the galaxies in four morphological classes (E, S0, Sab, Scd) based on the automated method of Huertas-Company et al. (2008) using learning machines to analyze the concentration and asymmetry parameters. The main new property of such a classification method is that a probability of being in each of the four morphological classes is associated to each galaxy instead of assigning it to a single class. We classified as a disk galaxy any galaxy with a probability of less than of being an elliptical. Due to the incompleteness of the SDSS spectroscopic sample and since several of our sample galaxies do not have any spectroscopic information, we remained with 1604, 336, 228, and 44 disk galaxies in the field1, field2, Virgo, and Coma sample, respectively.
Following our previous works (Aguerri et al., 2009; Méndez-Abreu et al., 2010), we detected the presence of bars in the different samples by visually inspecting the galaxy images. We classified all the galaxies into strong barred, weakly barred, and unbarred. The classification of each sample was always performed by two of us. A caveat regarding these criteria is that our distinction between strong and weak bars is not directly related to the contribution of the bar to the total galaxy potential, but rather refers to a secure or possible detection of a bar, respectively. Therefore, the fraction of weak bars could be understood as an estimate of the uncertainty on the bar fraction.
| Bar Fraction Distribution | Statistical Parameter | Galaxy Property | Field Sample | Virgo Sample | Coma Sample |
|---|---|---|---|---|---|
| (1) | (2) | (3) | (4) | (5) | (6) |
| Luminosity | |||||
| Mean | Mass | ||||
| Overall | Luminosity | ||||
| Peak | Mass | ||||
| Luminosity | |||||
| Mean | Mass | ||||
| Ordinary | Luminosity | ||||
| Peak | Mass |
4 Bar fraction across different environments
For each galaxy sample we derived the ordinary bar fraction (calculated only for the disk galaxies) and the overall bar fraction (calculated for all the galaxies independently of their Hubble type). Since bars can only be triggered in disks, combines the luminosity distribution of disk galaxies with their probability of having a bar overcoming the problem of the identification of disk galaxies. This is always a major concern in morphological classifications dealing with the measurement of bar fraction. allows us to probe a larger range of luminosities than . Figure 1 shows and as functions of the -band absolute magnitude and mass of the galaxies in our four samples. To avoid issues related to the bin size, we applied a moving-average (boxcar) smoothing over the histograms using box widths of 1 mag and 0.5 dex and steps of 0.5 mag and 0.25 dex in magnitude and mass, respectively. The lower and upper boundaries of the hatched areas correspond to the bar fraction calculated by considering only the strong (i.e., secure) bars and both the strong and weak (i.e., secure and uncertain) bars, respectively and including their statistical uncertainties. The latter were computed by estimating the confidence intervals on binomial population proportions following the prescriptions by Cameron (2011). The values of and for the samples of bright (field1) and faint field galaxies (field2) are in good agreement. Therefore, for studying the bar fraction distribution we merged the two samples into a joint sample of field galaxies (hereafter field sample) with magnitudes in the range (or ).
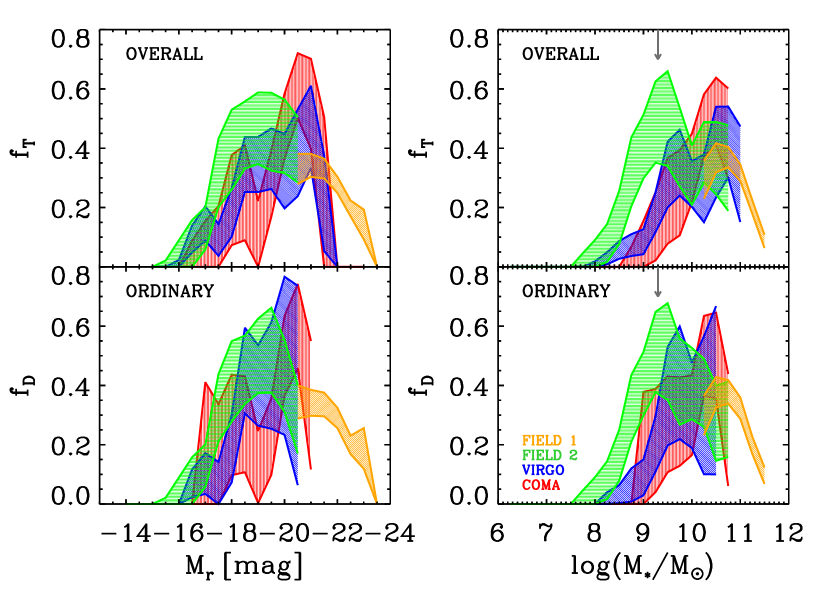
We calculated the weighted mean, peak value, and corresponding errors in magnitude (and mass) of the bar fraction distributions of the samples by performing a series of 1000 Monte Carlo simulations taking into account the confidence intervals (Table 1). We found that the bar fraction strongly depends on the galaxy luminosity (or mass), as previously pointed out by Méndez-Abreu et al. (2010, see also ). In addition, measuring and in different galaxy environments allows us to show that the bar fraction distribution is different for galaxies living in the field or in clusters. According to the values given in Table 1, this difference is statistically significant ( confidence level) for the field and Coma samples, with Virgo sample being an intermediate case.
The bar fraction of field galaxies peaks at (or ), whereas the largest fraction of barred galaxies in clusters is observed at (or ). In both of them the maximum and are in the range to . Moreover, there is marginal evidence in our cluster samples for two peaks in the overall bar fraction at and , respectively. This supports the claims of Nair & Abraham (2010) for a bimodal distribution of the bar fraction as a function of the luminosity (or mass).
For (or ), the bar fraction of the field galaxies is systematically larger than those of Virgo and Coma galaxies. We speculate about a hint that the bar fraction of the fainter galaxies in Virgo is also larger than that of Coma. On the contrary, the overall bar fraction is larger in cluster than in the field for (or ). The bins of brighter (or more massive) galaxies of the cluster samples ( or ) suffer from incompleteness. This prevents a reliable comparison for both the ordinary and overall bar fractions with the field galaxies.
5 Discussion and conclusions
In order to study the influence of environment on bar formation, we derived the fraction of barred galaxies over a large range of galaxy luminosities (or, equivalently, stellar masses) in the two nearby benchmark clusters Virgo and Coma and compared it to that of a sample of field galaxies. Both the distributions of ordinary bar fraction and overall bar fraction were measured. The difference of the bar fraction distributions as a function of galaxy luminosity (and mass) in the field and Coma cluster is found to be statistically significant ( confidence level), with the Virgo cluster being an intermediate case.
Since bars live in disks, these findings allow us to distinguish between the environmental processes inhibiting bar formation (heating) or even destroying the host disk from the processes triggering the disk instabilities which are responsible for bar formation.
We interpret the decrease of and with decreasing galaxy luminosity observed for fainter ( or, equivalently, less massive galaxies () as due to the increase of the disk thickness. Indeed, Sánchez-Janssen et al. (2010) have recently found that the minimum of the disk thickness distribution occurs at a characteristic mass (corresponding to ) below which low-mass galaxies start to be systematically thicker making it difficult to develop a bar. We suggest that the values of and in the field are systematically larger than those in Virgo and Coma because the low-mass galaxy disks in clusters are more easily heated, or destroyed, by galaxy interactions and can not develop a bar. In the low luminosity regime nurture and nature are acting on galaxy disks in cluster and field, respectively.
Since the values of and are larger for cluster galaxies with (or ), we conclude that brighter disks are strong enough to survive interactions and form a bar. In the high luminosity regime nurture and nature are acting on bar formation in galaxy disks of cluster and field, respectively.
From the theoretical point of view, environmental processes taking place in massive galaxy clusters do not seem to favor such an enhancement of the bar population. For instance, fast galaxy encounters are able to create bar-like features in galaxy disks depending mainly on the geometry of the encounter (Mastropietro et al., 2005; Aguerri & González-García, 2009). However, these encounters are randomly oriented and can remove large amounts of stars from the galaxy outskirts moving a galaxy from the bright to faint regime (Kormendy & Bender, 2012). Therefore, we suggest that the enhanced bar fraction observed in Virgo and Coma is not only due to processes taking place in clusters.
One possible explanation could be related to the different morphological mixing in the field and clusters. In the luminosity range we probe, the galaxy population in clusters is dominated by lenticular galaxies (Binggeli et al., 1988). Recently, Cameron et al. (2010), Masters et al. (2011), and Marinova et al. (2012) have found that the fraction of barred galaxies is higher for lenticulars than for spirals. This is contrary to the results of Laurikainen et al. (2007) and Aguerri et al. (2009) and also to the structural properties of lenticular galaxies (i.e., large bulge, thick disk, and little gas) which should inhibit the formation of bars. However, even if the higher fraction of barred galaxies in clusters was confirmed to be due to lenticulars, this would point again to environmental processes acting in triggering bar formation since the typical environmental mechanisms observed in clusters (i.e., harassment, high-speed encounters, or ram-pressure stripping) should not be able to make disk galaxies, in general, more prone to bar instabilities.
On the other hand, slow galaxy encounters have been suggested to be a very efficient mechanism in inducing the formation of bars (Noguchi, 1988). These encounters are not likely to happen in rich clusters, like Virgo and Coma, but they are more common in galaxy groups. Therefore, we tentatively suggest that bar formation could preferentially occur in small-size galaxy groups before they fall into the cluster. If this is the case, we expect to observe a large bar fraction in galaxy groups. Moreover, some of the bars we are observing in clusters should represent the population of genuine bars induced by interactions and should have different observable properties with respect to spontaneous bars as predicted by Miwa & Noguchi (1998).
To summarize, we suggest a bimodality in the role of environment on bars, since interactions can trigger or inhibit the bar formation in galaxy disks depending on their luminosity. The disks of brighter galaxies are strong enough both to maintain their cold structure and survive close interactions, which trigger the bar formation when the galaxies are probably in a pre-cluster stage. On the contrary, the disks of fainter galaxies are more fragile and hot. They can be heated or even destroyed by galaxy interactions which inhibit the formation of bars. Classification methods (e.g., visual inspection, concentration cuts, color-based cuts) used to select a disk galaxy sample are known to add biases. These are usually considered as the main source of the different findings about the influence of environment in bar formation. Our results highlight the importance of studying galaxy samples which have been carefully selected in luminosity to avoid biases when dealing with bar statistics. We argue that most of the controversial results about the relationship between environment and bar fraction could be explained in terms of the different luminosity ranges covered by the galaxy samples studied so far.
References
- Abazajian et al. (2009) Abazajian, K. N., Adelman-McCarthy, J. K., Agüeros, M. A., et al. 2009, ApJS, 182, 543
- Adelman-McCarthy et al. (2007) Adelman-McCarthy, J. K., Agüeros, M. A., Allam, S. S., et al. 2007, ApJS, 172, 634
- Adelman-McCarthy et al. (2008) Adelman-McCarthy, J. K., Agüeros, M. A., Allam, S. S., et al. 2008, ApJS, 175, 297
- Aguerri & González-García (2009) Aguerri, J. A. L., & González-García, A. C. 2009, A&A, 494, 891
- Aguerri et al. (2009) Aguerri, J. A. L., Méndez-Abreu, J., & Corsini, E. M. 2009, A&A, 495, 491
- Aihara et al. (2011) Aihara, Allende Prieto, C., An, D., et al. 2011, ApJS, 193, 29
- Andersen (1996) Andersen, V. 1996, AJ, 111, 1805
- Athanassoula (2005) Athanassoula, E. 2005, MNRAS, 358, 1477
- Athanassoula & Sellwood (1986) Athanassoula, E., & Sellwood, J. A. 1986, MNRAS, 221, 213
- Balogh et al. (2004) Balogh, M., Eke, V., Miller, C., et al. 2004, MNRAS, 348, 1355
- Barazza et al. (2009) Barazza, F. D., Jablonka, P., Desai, V., et al. 2009, A&A, 497, 713
- Barway et al. (2011) Barway, S., Wadadekar, Y., & Kembhavi, A. K. 2011, MNRAS, 410, L18
- Binggeli et al. (1988) Binggeli, B., Sandage, A., & Tammann, G. A. 1988, ARA&A, 26, 509
- Binggeli et al. (1987) Binggeli, B., Tammann, G. A., & Sandage, A. 1987, AJ, 94, 251
- Boselli & Gavazzi (2006) Boselli, A., & Gavazzi, G. 2006, PASP, 118, 517
- Cameron (2011) Cameron, E. 2011, PASA, 28, 128
- Cameron et al. (2010) Cameron, E., Carollo, C. M., Oesch, P., et al. 2010, MNRAS, 409, 346
- Carter et al. (2008) Carter, D., Goudfrooij, P., Mobasher, B., et al. 2008, ApJS, 176, 424
- Colless & Dunn (1996) Colless, M., & Dunn, A. M. 1996, ApJ, 458, 435
- Elmegreen et al. (1990) Elmegreen, D. M., Elmegreen, B. G., & Bellin, A. D. 1990, ApJ, 364, 415
- Eskridge et al. (2000) Eskridge, P. B., Frogel, J. A., Pogge, R. W., et al. 2000, AJ, 119, 536
- Friedli (1999) Friedli, D. 1999, in ASP Conf. Ser. 187, The Evolution of Galaxies on Cosmological Timescales, ed. J. E. Beckman & T. J. Mahoney (San Francisco, CA: ASP), 88
- Giordano et al. (2011) Giordano, L., Tran, K.-V. H., Moore, B., & Saintonge, A. 2011, arXiv:1111.1532
- Giuricin et al. (1993) Giuricin, G., Mardirossian, F., Mezzetti, M., & Monaco, P. 1993, ApJ, 407, 22
- Huertas-Company et al. (2011) Huertas-Company, M., Aguerri, J. A. L., Bernardi, M., Mei, S., & Sánchez Almeida, J. 2011, A&A, 525, A157
- Huertas-Company et al. (2008) Huertas-Company, M., Rouan, D., Tasca, L., Soucail, G., & Le Fèvre, O. 2008, A&A, 478, 971
- Kormendy & Bender (2012) Kormendy, J., & Bender, R. 2012, ApJS, 198, 2
- Kumai et al. (1986) Kumai, Y., Taniguchi, Y., & Ishii, H. 1986, MNRAS, 223, 139
- Laurikainen et al. (2007) Laurikainen, E., Salo, H., Buta, R., & Knapen, J. H. 2007, MNRAS, 381, 401
- Lee et al. (2012) Lee, G.-H., Park, C., Lee, M. G., & Choi, Y.-Y. 2012, ApJ, 745, 125
- Li et al. (2009) Li, C., Gadotti, D. A., Mao, S., & Kauffmann, G. 2009, MNRAS, 397, 726
- Mamon et al. (2004) Mamon, G. A., Sanchis, T., Salvador-Solé, E., & Solanes, J. M. 2004, A&A, 414, 445
- Marinova et al. (2012) Marinova, I., Jogee, S., Weinzirl, T., et al. 2012, ApJ, 746, 136
- Martínez & Muriel (2011) Martínez, H. J., & Muriel, H. 2011, MNRAS, 418, L148
- Masters et al. (2011) Masters, K. L., Nichol, R. C., Hoyle, B., et al. 2011, MNRAS, 411, 2026
- Mastropietro et al. (2005) Mastropietro, C., Moore, B., Mayer, L., et al. 2005, MNRAS, 364, 607
- Méndez-Abreu et al. (2010) Méndez-Abreu, J., Sánchez-Janssen, R., & Aguerri, J. A. L. 2010, ApJ, 711, L61
- Michard & Andreon (2008) Michard, R., & Andreon, S. 2008, A&A, 490, 923
- Miwa & Noguchi (1998) Miwa, T., & Noguchi, M. 1998, ApJ, 499, 149
- Nair & Abraham (2010) Nair, P. B., & Abraham, R. G. 2010, ApJ, 714, L260
- Noguchi (1988) Noguchi, M. 1988, A&A, 203, 259
- Ostriker & Peebles (1973) Ostriker, J. P., & Peebles, P. J. E. 1973, ApJ, 186, 467
- Sánchez-Janssen et al. (2010) Sánchez-Janssen, R., Méndez-Abreu, J., & Aguerri, J. A. L. 2010, MNRAS, 406, L65
- Skibba et al. (2012) Skibba, R. A., Masters, K. L., Nichol, R. C., et al. 2012, MNRAS, 423, 1485
- Thompson (1981) Thompson, L. A. 1981, ApJ, 244, L43
- van den Bergh (2002) van den Bergh, S. 2002, AJ, 124, 782
- Varela et al. (2004) Varela, J., Moles, M., Márquez, I., et al. 2004, A&A, 420, 873
- Zibetti et al. (2009) Zibetti, S., Charlot, S., & Rix, H.-W. 2009, MNRAS, 400, 1181