Comment on “Evidence of Non-Mean-Field-Like Low-Temperature
Behavior in the Edwards-Anderson Spin-Glass Model”
Ref. yucesoy:12 compares the low-temperature
phase of the Edwards-Anderson model (EA) to
the Sherrington-Kirkpatrick model (SK), studying
the overlap distributions and concluding
that the two models behave differently. A similar
analysis using state-of-the-art, larger data sets for EA
(generated with Janus janus:12b in
janus:10 ) and for SK (from aspelmeier:08 )
leads to a very clear interpretation of the results of
yucesoy:12 , showing that EA behaves as predicted by
the replica symmetry breaking (RSB) theory.
Ref. yucesoy:12 studies , probability of finding in a peak greater than for . In a RSB system, . Fig. 5 of yucesoy:12 shows that, at fixed and at the same , grows for SK, but seems to reach a plateau for EA. In the inset of Fig. 1 we show that, considering larger systems ( as opposed to of yucesoy:12 ), clearly grows with also for EA. We use the same value of as in yucesoy:12 and . Even this simple analysis is sufficient, when using state-of-the-art lattice sizes, to show that has the same qualitative behavior in both models.
Still, the choice of comparing data for different models at the same and does not have a strong basis. Indeed, according to the mean-field picture, the fluctuations of the are ruled by the shape of the averaged parisi:93 , so it is more appropriate to select such that is similar for EA and SK. Now, it is universally accepted that the peak at in grows with more slowly for EA, so the simplest assumption that all the individual peaks for scale at the same rate would already explain the results reported in yucesoy:12 .
According to RSB theory, in the large- limit . Let us assume that for large but finite the weight distribution is unchanged, but the delta functions are smoothed to a finite height janus:11 . The self-averaging peak at will also be smoothed, so we can estimate . is the probability of finding a peak with weight , which, for small , is , where parisi:93 .
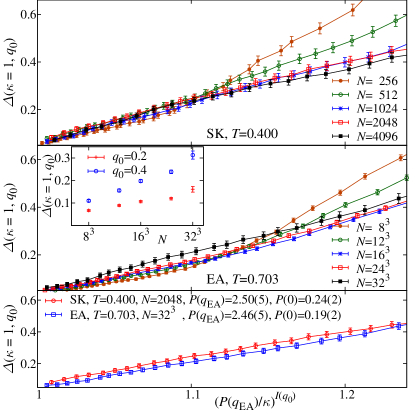
We show at for SK (top) and at for EA (middle), where the temperatures are such that are very similar (for the largest systems, ranges from to ). The curves show universal scaling for large . The bottom panel compares for SK and EA using similar effective sizes.
In short, the simple assumption that peaks for all values of scale at the same rate is consistent with the numerical data and explains the slower growth of with for EA. Therefore, contrary to the claims in yucesoy:12 , we find no quantitative difference between EA and SK, as long as one is careful when comparing non-universal quantities and uses state-of-the-art system sizes.
We have been supported through research contracts nos. 247328 (ERC); FIS2012-35719-C02-01 and FIS2010-16587 (MICINN); and GR10158 (Junta de Extremadura). We thank the Janus Collaboration for granting us use of the EA data.
A. Billoire1, L.A. Fernandez2, A. Maiorano3,
E. Marinari3, V. Martin-Mayor2, G. Parisi3,
F. Ricci-Tersenghi3, J.J. Ruiz-Lorenzo4, D. Yllanes3.
1IPhT, CEA Saclay, 91191 Gif-sur-Yvette, France;
2Dep. Física Teórica I, UCM, 28040 Madrid, Spain;
3Dip. Fisica, La Sapienza Università di Roma, 00185 Roma, Italy;
4Dep. Física, Univ. Extremadura, 06071 Badajoz, Spain
References
- (1) B. Yucesoy, H.G. Katzgraber, and J. Machta, Phys. Rev. Lett. 109, 177204 (2012) [preprint arXiv:1206.0783].
- (2) M. Baity-Jesi et al., Eur. Phys. J. Special Topics 210, 33 (2012) [preprint arXiv:1204.4134].
- (3) R.A. Baños et al., J. Stat. Mech. (2010) P06026 [preprint arXiv:1003.2569].
- (4) T. Aspelmeier, A. Billoire, E. Marinari, and M.A. Moore, J. Phys. A 41, 324008 (2008) [preprint arXiv:0711.3445].
- (5) G. Parisi, J. Stat. Phys. 72, 857 (1993).
- (6) R. A. Baños et al., Phys. Rev. B 84, 174209 (2011) [preprint arXiv:1107.5772].