Also at ]Istituto di Fisica Applicata ”Nello Carrara”, Consiglio Nazionale delle Ricerche, 50019 Sesto Fiorentino (FI), Italy
Large K-exciton Dynamics in GaN Epilayers: the non thermal and thermal regime
Abstract
We present a detailed investigation concerning the exciton dynamics in GaN epilayers grown on -plane sapphire substrates, focussing on the exciton formation and the transition from the non-thermal to the thermal regime. The time-resolved kinetics of LO-phonon replicas is used to address the energy relaxation in the excitonic band. From ps time-resolved spectra we bring evidence for a long lasting non-thermal excitonic distribution which accounts for the first 50 ps. Such a behavior is confirmed in different experimental conditions, both when non-resonant and resonant excitation are used. At low excitation power density the exciton formation and their subsequent thermalization is dominated by impurity scattering rather than by acoustic phonon scattering. The estimate of the average energy of the excitons as a function of delay after the excitation pulse provides information on the relaxation time, which describes the evolution of the exciton population to the thermal regime.
pacs:
78.30.Fs,78.55.Cr,78.47.jd,71.35.CcI Introduction
In direct band gap semiconductors the presence of excitonic resonances in optical spectra is considered as a clear marker to assess the sample quality. In the paradigmatic GaAs based systems, excitons are usually probed by means of photoluminescence (PL) experiments and their dynamics is investigated in a restricted wave vector (k) interval near the point (close to k = 0) as a consequence of the radiative recombination process which requires, in the photon emission, both energy and momentum conservation. Therefore, when an excess energy is used to excite the sample, the risetime of the PL signal at the exciton energy includes all the information concerning exciton formation and their relaxation towards the k0 radiative states, making difficult to extract quantitative information on each process. Even when resonant excitation is used the information on the k0 excitons can only be obtained by a careful modeling of the exciton dynamics.Vinattieri et al. (1994) For semiconductors where excitons strongly interact with the lattice, phonon replicas (PR) of the k = 0 excitonic band ( the so called zero-phonon line (ZPL)) are present in the PL spectra. Two possible situations can occur depending on the exciton localization/delocalization process in the material. In disordered/defective materials - where most of the recombinations come from extrinsic contributions - excitons are strongly localized. The Huang-Rhys (H-R) model is then commonly used to describe the replica characteristics and to extract the H-R coefficient, which quantifies the exciton interaction with the lattice. This has been extensively done in III-nitrides both in epilayers and quantum confined heterostructures.Leroux et al. (1999); Kalliakos et al. (2002a, b) In this case the phonon-assisted transitions ”replicate” the ZPL shape and contain the same information on the exciton localization dynamics. Depending on the localization degree a thermal regime can eventually be reached, which requires tens or hundreds of picoseconds.
On the other hand, in samples where exciton localization is weak, the free exciton (FE) thermalization issue is relevant and from the study of the phonon-replica emission we can expect extracting useful information on the exciton distribution over an extended k-range. Moreover, even if the ZPL shows bound exciton emission (in non-intentionally doped (nid) GaN epilayers excitons are mainly bound to donor states), the PR bands mostly originate from intrinsic excitonic states, making negligible the contribution of the extrinsic band. The PR bands contain information on the whole (k = 0 and k0) exciton population, since the momentum conservation rule is assured by the presence of one or more phonons. In particular longitudinal optical (LO) phonons, of energy , are very effective in determining intense PR-PL bands, which are denominated LO band depending on the number of LO phonons involved in the emission process. In fact it has been shown that the shape of the 2LO PR of the FE band is proportional to the FE population, while the 1LO PR of the FE band reflects the FE population times the exciton kinetic energy.Segall and Mahan (1968) Therefore phonon replicas have been investigated in different semiconductors to assess both the exciton-phonon interaction and the FE dynamics at large k, which is of interest not only for fundamental physics but also for applications.Klingshirn (2007) In particular, the study of the phonon-assisted radiative recombinations provides significant information on the exciton dynamics in II-VI and III-V nitride semiconductors, which show pronounced phonon assisted emission.Gil (2002) In III-V nitride structures, most of the reports on PR refer to the steady-state regime.Kovalev et al. (1996); Buyanova et al. (1997) We recently showedCavigli et al. (2010) that a close comparison with existing modelsSegall and Mahan (1968) for the PR emission in GaN epilayers is relevant provided a free exciton thermalized distribution is achieved and taking into account the complex nature of the exciton band in GaN. In this way a full reconstruction of the exciton density of states is made possible and the experimental PR energy shift, lineshape and intensity are nicely reproduced by this model. The k = 0 exciton dynamics has been extensively investigated both at the fs and ps time scale. Typically a 150 ps radiative recombination time and fast dephasing times (equal to 1-2 ps in high quality samples at low excitation density) are found for the A and B excitons.Monemar et al. (2010); Hazu et al. (2002); Ishiguro et al. (2009) Nevertheless, despite the fact that in the 1-100 ps range the exciton dynamics is dominated by large-k excitons, the PR recombination kinetics has been scarcely investigated mainly focussing on the quasi-thermal regime.Hägele et al. (1999) But even if the exciton-acoustic phonon interaction is quite strong, the thermal regime is reached after a finite time. This implies the presence of a non-thermal regime, which has not been experimentally investigated yet. Only theoretical results concerning the exciton formation and the approach to thermal equilibrium are reported in literature.Kuhm et al. (2011); Kokolakis et al. (2003); Ridley (1988) In this study we aim at filling this gap and therefore we explore both the non-thermal and the thermal regime. From picosecond time-resolved experiments performed on nid GaN epilayers grown on c-plane sapphire substrates, we show that the achievement of a hot thermal distribution of excitons requires a few tens of ps, depending on the excitation energy, the lattice temperature and the excitation power density. The heating process is also studied by resonantly exciting the k = 0 FE (XA exciton). As a consequence of the different wavevector intervals explored by the PR and the ZPL emission, we provide insights on the exciton dynamics in an extended region near the -point of the first Brillouin zone.
II Experimental
The investigated samples are a 11 m thick nid wurtzite GaN epilayer grown by hybrid vapor phase epitaxy (HVPE) on a -plane sapphire substrateMartin et al. (2006) (sample A) and a 3 m thick nid wurtzite GaN epilayer grown by metal organic vapor phase epitaxy (MOCVD) on a -plane sapphire substrate (sample B). The threading dislocation density is as low as cm-2 in the HVPE sample and lower than cm-2 in the MOVPE epilayer with a not intentional -type doping cm-3. Measurements were performed with the sample placed in a closed-cycle cryostat varying the temperature from 10 to 50 K for time-resolved experiments. Reflectivity measurements at normal incidence were carried out using a CW Xe lamp. Time-integrated photoluminescence (TI-PL) measurements were performed under non-resonant excitation by a frequency-doubled ps dye laser at 300 nm, and the collected light was detected by a cooled silicon charge coupled device camera after dispersion through a 50 cm flat-field spectrometer with a spectral resolution of 1 meV. Time-resolved photoluminescence (TR-PL) measurements were performed using a frequency-doubled mode-locked Ti:sapphire laser pumped by a continuous wave Ar+ laser providing 1.2 ps pulses at a repetition rate of 81 MHz. The PL was dispersed through a 30 cm flat-fi eld monochromator and detected by a streak camera apparatus with a 3 ps time resolution.
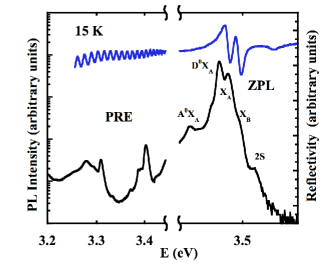
In Fig. 1 typical TI-PL spectra taken at K for the ZPL and the PR region are shown for sample A. Similar spectra for sample B are shown in Ref. Cavigli et al., 2010. The main spectral features observed in the ZPL region at 10 K are related to the neutral donor-bound exciton recombination (D0XA) and to the XA and XB exciton radiative recombinations. The emission from the 2S state of XA excitons is also detected at higher energy. The reflectivity spectrum (blue line in Fig. 1) shows clear excitonic resonances confirming the labeling of the PL structures. In this case the XC excitonic resonance is detected at 3.52 eV. In the PR region the reflectivity spectrum shows only interference fringes related to the epilayer thickness. From the comparison of Fig. 1 and the spectra reported in Ref. Cavigli et al., 2010 it turns out that samples A and B show very similar features and pronounced excitonic resonances. The measured Stokes shift for the XA exciton, detected at 15 K, is also very similar and is lower than 1.5 meV in both samples indicating a weak exciton localization at low . The difference observed in the exciton energies, as extracted from the reflectivity spectra, comes from the different residual biaxial strains of the two epilayers and agrees with data and calculation already published.Shan et al. (1996); Gil and Briot (1997) For a detailed discussion on the TI-PL spectra we refer the readers to Ref. Cavigli et al., 2010. We only mention that the TI-PL lineshape almost coincides with the long delay TR-PL lineshape and that it well agrees with the thermal model of Segall-MahanSegall and Mahan (1968) when the discrepancy commonly reported for the temperature behavior of the phonon-replicas is described by accounting for the complexity of the GaN excitonic band.Cavigli et al. (2010) Here we will focus on the time-resolved spectra to investigate the typical time scale for reaching a quasi-thermal distribution for which the model of Ref. Segall and Mahan, 1968 can be applied. Since the experimental results turn out to be very similar for samples A and B , most of the data we will show will refer to sample A.
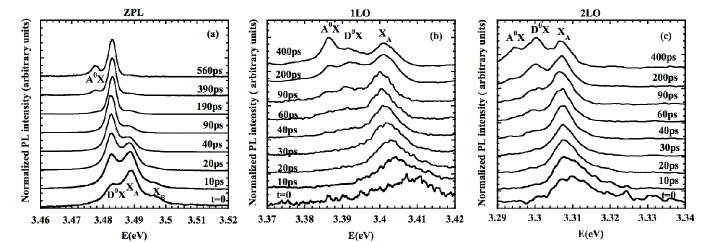
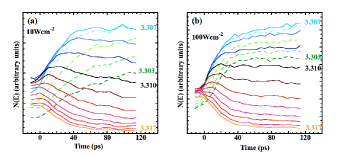
In Fig. 2, typical TR-spectra are shown for (a) the ZPL, (b) the first LO phonon replica (1LO) and (c) the second LO phonon replica (2LO) acquired when exciting the sample with 3.55 eV photons (i.e., photons with an excess energy of nearly 60 and 35 meV with respect to the bottom of the exciton and free carrier band, respectively, which is however still lower than the energy meV of the dominant LO phonon). Here, and in the following, the zero time corresponds to the maximum of the excitation pulse as measured from the Rayleigh or Raman scattered light. It appears that for the ZPL most of the dynamics involving free exciton states, both A and B ones, occurs during the first 40 ps following the excitation. The modifications seen at later times in the ZPL lineshape come from the increasing contribution of the donor- and acceptor- bound exciton states. Concerning the time evolution of the replica bands we will first focus on the 2LO-phonon band whose shape and intensity is directly proportional to the exciton population along the k-states.Segall and Mahan (1968) At early times, the emission is blue-shifted and broadened with respect to that measured at delays longer than 100 ps. Besides, for delays longer than 40 ps, the spectrum gets narrower and shifts to the energy position expected for a thermal exciton population.
The complexity of the exciton dynamics, which involves a non-thermal and a quasi-thermal regime at the picosecond time scale, is suggested by the different time evolutions of the spectral components of the 2LO-phonon band reported in Fig. 3(a) and Fig. 3(b), respectively. As a general trend, the rise and fall time get shorter with increasing energy of the recombining state. The risetime of the high energy states (where only FE are present), at the limit of our experimental time resolution, indicates an exciton-formation time 10 ps followed by a PL decay occurring on a 100 ps time scale, which originates from both the population thermalization and decay. At early times the high energy side of the phonon replica is faster than the XA emission and we recover a common exponential decay at longer delays, indicating the establishment of the thermal regime. The lower energy states exhibit a slower rise and decay as a consequence of the population dynamics and/or the exciton cooling.
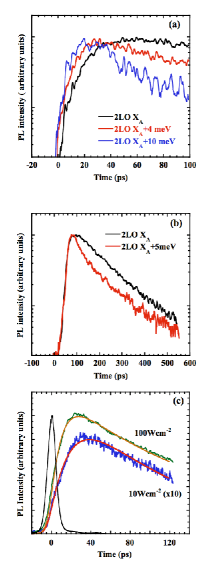
In Fig. 3(c), we show the time evolution of the spectrally integrated free exciton emission of the 2LO-phonon band, excited with an excess energy of 60 meV for two different power densities (10 Wcm-2 and 100 Wcm-2) normalized to the excitation power density. The fit with an exponential rise and decay is reported on the experimental data and, for clarity, the experimental time response is also shown. In this case the rise and decay times reflect the time evolution of the total exciton population free from thermalization effects. In the following we will refer to the rise-time of the spectrally integrated PL as to the ”exciton-formation time”. Figure 3 (c) clearly shows a decrease in the exciton formation time (and a 20% superlinearity) when increasing the excitation power density from 10 to 100 Wcm-2. In addition the exciton formation time only sligthly depends on the excitation energy as supported by the decrease from 13 to 9 ps when reducing the excitation excess energy below the free carrier absorption edge (from 60 to 20 meV with respect to the bottom of the exciton band). This suggests, as we will discuss later, that we mostly create electron-hole (e-h) correlated pairs rather than free carriers, even when we excite the samples a few tens of meV above the free carrier continuum.
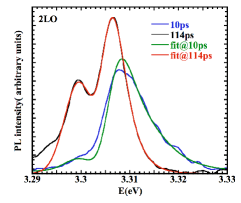
Let us now move to the study of the exciton relaxation process. In Fig. 4 we show the comparison between the 2LO phonon replica time-resolved spectra taken at ps and ps delay time after the excitation pulse. It is worth pointing out that the overall exciton dynamics is almost independent from the excess energy of the exciting photons (not shown here); therefore in the following the experimental data will refer to the excitation energy of 3.55 eV. The exciton relaxation dynamics has been commonly interpreted as a cooling process assuming that an exciton thermal distribution can be reached within a few picosecondsHägele et al. (1999); Shah (1996) and then that we can reproduce the PL lineshape with a Boltzmann distribution with a temperature dependent on the delay time. In fact, in agreement with previous reports,Hägele et al. (1999) we find that, within the experimental sensitivity, the high energy tail of the emission is mostly exponential even at very short delay times. However, we can perform a more accurate analysis by using the fact that the lineshape of the 2LO phonon band is directly related to the population along the exciton band by
| (1) |
where is the exciton kinetic energy, , represents the exciton density of states and is the exciton distribution function at time . Generally speaking, can even be a non-thermal distribution and, in fact, reasonable fits to the time-resolved 2LO-phonon emission spectra with Boltzmann functions for are obtained only at long delays. In Fig. 4, we compare the time-resolved 2LO-phonon spectra with the corresponding fits using a Boltzmann-like distribution. The spectrum at a delay time of 114 ps is nicely reproduced by given in Ref. Cavigli et al., 2010 and = 1.97 meV, being the temperature of the lattice. The best fit to the data at a delay time of 10 ps requires a hotter thermal distribution ( = 3.77 meV). However the quality of the fit is quite poor. In particular the states near the peak energy reveal a lack of population with respect to the thermal condition, suggesting a non-thermal exciton distribution. In order to quantitatively discuss the exciton thermalization we, first of all, normalize each time-resolved spectrum of the 2LO-phonon PL band with its spectrally integrated intensity. This operation eliminates the exciton formation and recombination from the lineshape analysis, which, to a first approximation, only affects the total number of excitons. The resulting normalized spectra is then proportional to the normalized exciton population . The next step is to bypass the problem of modelling . To this aim, considering the ratio between the normalized spectra, we have experimental data that do not depend on the actual . In fact, according to the experimental data, we can assume a thermal distribution at the lattice temperature for ps ( hereafter ). Then from Eq.1 the 2LO-phonon normalized emission band at is given by:
| (2) |
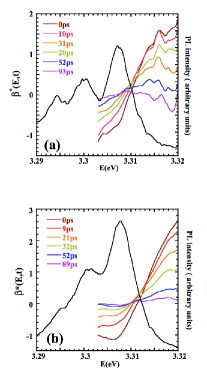
and therefore from we can extract the exciton distribution even if the density of states is unknown. In Figs. 5(a) and 5(b) we report the time evolution of the normalized spectra at fixed energies for two different excitation power densities (10, 100 Wcm-2). The quantity decreases with time for large values, while it increases for small values. These trends are obviously associated with the transfer of population towards the bottom of the excitonic band. We also observe that the state of energy around 3.310 eV, nearly corresponding to an excess of energy above the bottom of the exciton band, rapidly reaches the equilibrium value at temperature , i.e., a constant value of the population. A faster thermalization is observed at higher excitation power density, as expected if we take into account exciton-exciton interaction. In order to get more direct information on the exciton distribution we define the quantity :
| (3) |
turns out to be an indicator of the degree of thermalization of the excitons and it is independent on the actual density of states. Whenever the hot exciton picture applies, i.e., when the exciton distribution is a quasi-thermal distribution with a time-dependent temperature , we get
| (4) |
In the hot exciton limit we therefore expect to get a straight line when plotting as a function of energy with a slope given by . Any deviation from a linear dependence vs. is therefore a signature for a non-thermal regime. In Fig. 6 (a), is reported for different delay times, in the 2LO-phonon spectral region, as extracted from TR spectra. The nominal lattice temperature is equal to 10 K and the sample is excited with an excess energy of meV with respect to with a power density of 10 W cm-2. For clarity we report the value of only in the spectral region of the free exciton emission with the low energy side cutoff corresponding to the onset of the 2LO-phonon D0XA emission. In this figure, the energy is identified with the photon emission energy and not only the kinetic energy term. We also show the time-integrated PL spectrum of the 2LO-phonon replica corresponding to the full thermal regime. Strong deviations from a linear trend of are observed at the early stage of the exciton dynamics ( ps). In particular a decrease in the exciton population for small kinetic energies with respect to a thermal distribution is found. In addition, we also observe a flattening of on the high energy side (corresponding to the tail of the PL band), which could be a further indication for a non-thermal distribution. However, this part of the spectra is affected by a relevant background whose subtraction is delicate making reliable conclusions rather hazardous. It turns out that the distribution function behaves like a Boltzmann function only at longer delays ( ps) and shows a linear dependence over the whole energy range covered by the 2LO-phonon band with a decreasing slope in agreement with a cooling of the exciton population. Finally becomes constant and vanishes, as expected, when the distribution reaches the lattice temperature. Referring to Fig. 6(a), the deviation of from the linear behavior observed for ps indicates the lack of excitonic population not only with respect to the thermal regime at but also with respect to a hot exciton distribution. Therefore our findings clearly evidence the presence of a non-thermal distribution of the exciton population at short delay times. It comes out that the cooling picture of a hot exciton distribution does not apply if we refer to the whole excitonic band. Moreover, the lack of population at the XA energy with respect to the hot thermal distribution cannot be ascribed to a localization mechanism. In fact, the absence of any significant localization of the excitons is proven by the comparison of reflectivity and PL spectra for the ZPL (Fig. 1) where it turns out that the Stokes shift at 10 K is meV, a value not large enough to explain the experimental results displayed in Fig. 6(a). In Fig. 6(b), similar spectra are reported for an excitation power density of 100 Wcm-2. No major change is found except that the quasi-thermal regime is reached for slightly shorter times with respect to the low excitation condition, as already shown in Fig. 5. Up to 50 K the non-thermal regime can still be detected during the first 30 ps and similar results for are observed when we change the photon excitation energy for an excess energy lying in the 6 to 60 meV range.
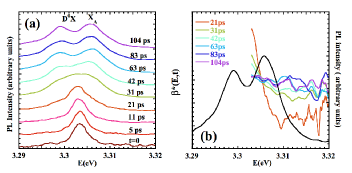
A specular behavior is instead observed when we resonantly excite the k=0 XA exciton and we study the heating of the corresponding exciton distribution. In Fig. 7(a) TR spectra are shown for different delay times after the resonant excitation at E = 3.303 eV slightly below the XA exciton. Apart from the initial Raman signal detected for the first 10 ps, that dominates the emission spectra at the early stage, the exciton line and also that of the D0XA emission are visible at ps. In Fig. 7(b), we report for ps when the Raman signal can be neglected and we can discuss the evolution of the exciton distribution without spurious emission. Due to this cut occurring at the early stage in the time evolution of the excitons it is not possible to have a definitive proof of their non-thermal distribution under this excitation condition. Still shows a slope opposite to that reported for non-resonant excitation, denoting a cold exciton distribution. During the thermalization process we observe an exciton heating with a population transfer between low and high energy states until the equilibrium distribution at temperature is reached. Quite remarkably we find that the time scale for reaching the equilibrium distribution is almost the same for the cooling and heating of the exciton population. Finally it is worth noting that, when comparing the PL spectra shown in Figs. 6 and 7 a saturation of the acceptor emission is observed (Fig. 6) when increasing the excitation power density while it is its absence which is observed when exciting the sample resonantly (Fig. 7).
III Discussion
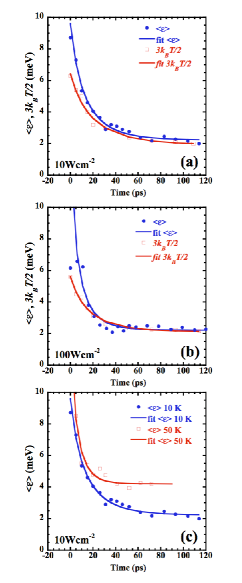
The analysis of the 2LO PR-PL lineshape, without any supplementary modeling of the exciton density of states, already gives important information on the excitonic distribution function. However, to quantitatively study the thermalization process, we have to analyze and compare the time evolution of the mean energy and that of the effective temperature of the exciton distribution. can be directly obtained from the experimental data by considering the ratio between the spectrally integrated 1LO-phonon emission and the 2LO-phonon band,Ulbrich (1973) while , according to the usual approach,Hägele et al. (1999) is given by an exponential fit of the high energy tail of the 2LO-phonon PL spectra. Obviously for a thermal exciton distribution and a standard excitonic density of states we expect to have . The two data sets, and , are reported in Figs. 8(a) and 8(b) for two excitation power densities. We observe that in the early stage is larger than , thus denoting a non-thermal distribution of the excitons. At long delay time and reach the same asymptotic values, as expected for an excitonic thermal distribution. In Fig. 8(c) the value of is reported for two different lattice temperatures and 50 K. At K we see that the exciton cooling is significantly faster than that at K. In Figs. 8(a)-8(c) the continuous lines are best fits to the experimental data obtained with the expression for the time-dependent mean energy (or ):
| (5) |
with
| (6) |
where and are the equilibrium and initial (i.e. at ) mean energy . The thermalization time constant is determined by the exciton-acoustic phonon interaction due to the deformation potentialUlbrich (1973); Hägele et al. (1999) and does not depend on the lattice temperature . This expression has been very often derived assuming a thermalized distribution, therefore referring to the temperature. Nevertheless it holds independently from this assumption.Ridley (1988) The values determined for the time constant of and are respectively ps and ps at 10 Wcm-2 and ps and ps at 100 Wcm-2; for K we get ps.
As expected the cooling process becomes faster when rising either the excitation power density or the temperature. In addition the data fitting points out a strong discrepancy between and , strenghtening the non-thermal distribution character of the excitonic gas.
We can now compare the energy relaxation time with the values predicted by theories. From ps (32 ps), by means of the expression reported in Ref. Ulbrich, 1973, we get an effective deformation potential (DP) constant E eV ( eV) to be compared with the value E eV reported in Ref. Hägele et al., 1999 and EeV usually found both theoretically and experimentally (e.g. see Ref. Ishii et al., 2010). Provided the value we find is nearly twice the ”standard” one, and that the latter would lead to a thermalization time of about 100 ps, we should consider other scattering mechanisms in addition to that of the deformation potential. A contribution to the exciton thermalization from exciton-exciton scattering is evidentiated by the acceleration of the dynamics when rising the excitation power density from 10 to 100 Wcm-2, i.e the exciton density from cm-3 to cm-3. In fact the role of the inelastic exciton-exciton collision in the population redistribution in GaN has been reported by several autors.Bidnyk et al. (1999); Tanaka et al. (2006) An evaluation of the exciton-exciton scattering rate can be obtained by the dephasing time. Indeed, according to the results of Pau et al. (see Ref. Pau et al., 1997) this contribution to the linewidth depends on the exciton density NX as , where aB is the exciton Bohr radius, the exciton binding energy and a dimensionless efficiency factor which for GaN is between 5 and 7. With a nm and meV, as found from an hydrogenoid model, we get a dephasing time in the range 20 to 40 ps for N cm-3. We get instead a value of 2 to 4 ps for N cm-3, which is an order of magnitude too short to account for the experimental results. From our data, it turns out that, in the thermalization process, the inelastic exciton-exciton scattering contributes but with an efficiency ten times lower than in the dephasing process, where collisions are prevailing without any change in the energy of the single exciton. It is also worth pointing out that the exciton-free carrier scattering process can in principle also contribute to the exciton relaxation but, from time-resolved spectra, the number of free carriers seems negligible with respect to that of the excitons. Therefore other mechanisms have to be considered and in particular the piezoelectric interaction (PZ) with the acoustic phonons as well as the impurity (defects) inelastic (D0XA) scattering. The role of the PZ interaction in the exciton thermalization process in GaN epilayers has been extensively investigated by Kokolakis et al. (see Ref. Kokolakis et al., 2003)and it has been found nearly equal to that of the DP interaction for low residual doping. Due to screening effects it becomes negligible for a cm-3 impurity content. Provided that the PZ mechanism does not give a good fit to the experimental data we consider its contribution to the thermalization as being marginal. When considering the scattering from neutral donors the impact rate is roughly given by ,Wang et al. (2009); Steiner et al. (1986) where ND is the neutral donor concentration and v is exciton group velocity, being and m the exciton kinetic energy and mass. Then, for example, with meV and N cm-3 we get a very short collision time fs. Therefore, even if most of the collisions are of elastic nature and that they only contribute to the exciton dephasing process,Wang et al. (2009) we can expect a relevant contribution to the exciton thermalization from the inelastic processes as already found in GaAsSteiner et al. (1986) and InP.Benzaquen et al. (1999) This mechanism is also in agreement with the observed behavior when changing the lattice temperature provided the scattering rate only depends on the exciton energy and not on . Thus, as observed in Fig. 8(c), the initial energy relaxation towards the exciton thermalization is independent of . Since the exciton initial excess energy is identical for and 50 K, the acceleration observed in Fig. 8(c) is only becoming apparent as a consequence of the higher final energy of the excitons at 50 K. This does not hold for the DP (PZ) interaction. In fact the fit of the experimental data of Fig. 8(c) with Eq. 5 requires a decrease in the time constant related to the DP (PZ) interaction, when rising the temperature, in disagreement with its expression, which is independent of .Ulbrich (1973); Hägele et al. (1999)
The previous discussion deals with the time evolution of a hot exciton population that has reached a finite and constant value and evolves towards the thermal equilibrium with the lattice. Let us now briefly comment on the early stage of the exciton dynamics when the states near the bottom of the excitonic band become populated, i.e., the exciton formation stage, which in our measurements corresponds to the time interval between the arrival of the excitation pulse and the observation of the maximum of the spectrally integrated PL of the 2LO-phonon replica(Fig. 3 (c)). The corresponding PL rise time turns out to be ps, nearly independent on the energy of the excitation photon, which is only slightly shortened when rising the excitation power density. When exciting the sample meV above the XA state, i.e 35 meV above the free carrier continuum, we create both free carriers and correlated e-h pairs. Free carriers relax in energy and form excitons via a bimolecular (BM) mechanism with a coefficient ps-1 cm3.Pau et al. (1998) Correlated e-h pairs reach the bottom of the exciton band losing their excess energy by means of inelastic interactions with acoustic phonons, impurities and defects. At the excitation power densities used in our experiment the bimolecular generation only contributes at the highest power density (100 Wcm-2), i.e. carrier/cm3),providing an exciton formation time of 12 ps, not far away from the observed rise time of the 2LO-phonon replica. In addition the slight superlinearity shown in Fig. 3(c) well agrees with the BM mechanism. In our experiment at 10 Wcm-2 the exciton formation time is only sligthly longer and is still in the range of 10 ps. Then it turns out to be shorter than the time needed to reach the bottom of the exciton band when an energy loss of 30-40 meV by emitting acoustic phonons is considered. Moreover the BM generation would provide a risetime of ps.Compagnone et al. (2002) Therefore, also for the exciton formation, inelastic collisions with neutral donors appear as the most likely process for a fast exciton formation, or more precisely, for a fast relaxation of correlated e-h pairs towards the bottom of the exciton band. One inelastic collision, giving rise to the donor ionization, is sufficient to produce a 20-30 meV loss in the exciton energy, thus providing a fast transfer from the high to the low energy exciton states. The fast rise in the ZPL signal, equal to that reported for the 2LO-phonon PL in Fig. 2 at low excitation power density is mainly due to exciton-impurity scattering, which avoids the bottleneck resulting from the reduced efficiency for the exciton-acoustic phonon scattering.
IV Conclusions
From a careful analysis of low temperature time-resolved spectra of the phonon replica emission in GaN epilayers we have evidenced the transition from the non-thermal to the thermal regime of the exciton population. Our experimental results provide clear signatures that the processes leading to the exciton formation and thermalization are relatively slow when the exciton density is lower than cm-3. The establishment of a thermal Maxwell-Boltzman distribution for the exciton population is observed after ps,mainly as a consequence of inelastic collisions with impurities rather than with acoustic phonons. From the comparison with models and predictions for the deformation potential, piezoelectric interaction and impurity scattering we show that neutral donor scattering can account for the exciton formation and relaxation. Only thanks to the residual doping, the bottleneck regime for the radiative excitons at k = 0 is avoided. Nevertheless, for an exciton density cm-3 , the exciton-exciton collisions become relevant in the exciton formation and thermalization, contributing to the cooling via inelastic processes.
Acknowledgements.
The research was partially supported by the Italian Ministry of University and Research PRIN GaN optoelectronic devices for future applications: solid-state lighting, biomedical instrumentation and data storage, 20095NMPW7.References
- Vinattieri et al. (1994) A. Vinattieri, J. Shah, T. C. Damen, D. S. Kim, L. N. Pfeiffer, M. Z. Maialle, and L. J. Sham, Phys. Rev. B 50, 10868 (1994).
- Leroux et al. (1999) M. Leroux, N. Grandjean, B. Beaumont, G. Nataf, F. Semond, J. Massies, and P. Gibart, J. Appl. Phys. 86, 3721 (1999).
- Kalliakos et al. (2002a) S. Kalliakos, P. Lefebvre, X. Zhang, T. Taliercio, B. Gil, N. Grandjean, B. Damilano, and J. Massies, phys. stat. sol. (a) 190, 149 (2002a).
- Kalliakos et al. (2002b) S. Kalliakos, X. B. Zhang, T. Taliercio, P. Lefebvre, B. Gil, N. Grandjean, B. Damilano, and J. Massies, Appl. Phys. Lett. 80, 428 (2002b).
- Segall and Mahan (1968) B. Segall and G. D. Mahan, Phys. Rev. 171, 935 (1968).
- Klingshirn (2007) C. F. Klingshirn, Semiconductor Optics, 3rd ed. (Springer-Verlag, 2007).
- Gil (2002) B. Gil, Low-dimensional nitride semiconductors (Oxford University Press, New York, 2002).
- Kovalev et al. (1996) D. Kovalev, B. Averboukh, D. Volm, B. K. Meyer, H. Amano, and I. Akasaki, Phys. Rev. B 54, 2518 (1996).
- Buyanova et al. (1997) I. A. Buyanova, J. P. Bergman, B. Monemar, H. Amano, and I. Akasaki, Mater. Sci. Eng., B 50, 130 (1997).
- Cavigli et al. (2010) L. Cavigli, R. Gabrieli, M. Gurioli, F. Bogani, E. Feltin, J.-F. Carlin, R. Butté, N. Grandjean, and A. Vinattieri, Phys. Rev. B 82, 115208 (2010).
- Monemar et al. (2010) B. Monemar, P. P. Paskov, J. P. Bergman, G. Pozina, A. A. Toropov, T. V. Shubina, T. Malinauskas, and A. Usui, Phys. Rev. B 82, 235202 (2010).
- Hazu et al. (2002) K. Hazu, A. Shikanai, T. Sota, K. Suzuki, S. Adachi, S. F. Chichibu, and T. Mukai, Phys. Rev. B 65, 195202 (2002).
- Ishiguro et al. (2009) T. Ishiguro, Y. Toda, S. Adachi, and S. F. Chichibu, physica status solidi (c) 6, S719 (2009).
- Hägele et al. (1999) D. Hägele, R. Zimmermann, M. Oestreich, M. R. Hofmann, W. W. Rühle, B. K. Meyer, H. Amano, and I. Akasaki, Phys. Rev. B 59, R7797 (1999).
- Kuhm et al. (2011) K. Kuhm, L. Rota, and R. A. Taylor, physica status solidi (a) 208, 1159 (2011).
- Kokolakis et al. (2003) G. Kokolakis, F. Compagnone, A. Di Carlo, and P. Lugli, physica status solidi (a) 195, 618 (2003).
- Ridley (1988) B. Ridley, Quantum Processes in Semiconductors (Oxford University Press, 1988).
- Martin et al. (2006) D. Martin, J. Napierala, M. Ilegems, R. Butté, and N. Grandjean, Applied Physics Letters 88, 241914 (2006).
- Shan et al. (1996) W. Shan, R. J. Hauenstein, A. J. Fischer, J. J. Song, W. G. Perry, M. D. Bremser, R. F. Davis, and B. Goldenberg, Phys. Rev. B 54, 13460 (1996).
- Gil and Briot (1997) B. Gil and O. Briot, Phys. Rev. B 55, 2530 (1997).
- Shah (1996) J. Shah, Ultrafast Spectroscopy of Semiconductors and Semiconductors Nanostructures , Springer Series in Solid-State Sciences 115 (Springer, 1996).
- Ulbrich (1973) R. Ulbrich, Phys. Rev. B 8, 5719 (1973).
- Ishii et al. (2010) R. Ishii, A. Kaneta, M. Funato, Y. Kawakami, and A. A. Yamaguchi, Phys. Rev. B 81, 155202 (2010).
- Bidnyk et al. (1999) S. Bidnyk, T. J. Schmidt, B. D. Little, and J. J. Song, Applied Physics Letters 74, 1 (1999).
- Tanaka et al. (2006) H. Tanaka, M. Ando, T. Uemura, and M. Nakayama, physica status solidi (c) 3, 3512 (2006).
- Pau et al. (1997) S. Pau, J. Kuhl, F. Scholz, V. Haerle, M. A. Khan, and C. J. Sun, Phys. Rev. B 56, R12718 (1997).
- Wang et al. (2009) Y. J. Wang, R. X. Wang, G. Q. Li, and S. J. Xu, Journal of Applied Physics 106, 013514 (2009).
- Steiner et al. (1986) T. Steiner, M. L. W. Thewalt, E. S. Koteles, and J. P. Salerno, Phys. Rev. B 34, 1006 (1986).
- Benzaquen et al. (1999) R. Benzaquen, R. Leonelli, and S. Charbonneau, Phys. Rev. B 59, 1973 (1999).
- Pau et al. (1998) S. Pau, J. Kuhl, M. A. Khan, and C. J. Sun, Phys. Rev. B 58, 12916 (1998).
- Compagnone et al. (2002) F. Compagnone, G. Kokolakis, A. Di Carlo, and P. Lugli, physica status solidi (a) 190, 141 (2002).