1–8
Molecular Clouds: Internal Properties,
Turbulence, Star Formation and Feedback
Abstract
All stars are born in molecular clouds, and most in giant molecular clouds (GMCs), which thus set the star formation activity of galaxies. We first review their observed properties, including measures of mass surface density, , and thus mass, . We discuss cloud dynamics, concluding most GMCs are gravitationally bound. Star formation is highly clustered within GMCs, but overall is very inefficient. We compare properties of star-forming clumps with those of young stellar clusters (YSCs). The high central densities of YSCs may result via dynamical evolution of already-formed stars during and after star cluster formation. We discuss theoretical models of GMC evolution, especially addressing how turbulence is maintained, and emphasizing the importance of GMC collisions. We describe how feedback limits total star formation efficiency, , in clumps. A turbulent and clumpy medium allows higher , permitting formation of bound clusters even when escape speeds are less than the ionized gas sound speed.
keywords:
ISM: clouds, ISM: kinematics and dynamics, stars: formation1 Observed Properties of Molecular Clouds
Stars form from molecular gas, which, in the Milky Way, is mostly in GMCs, defined to have (Williams et al. 2000). Within GMCs are overdense clumps that may later form star clusters and cores that may form single stars or binaries. GMCs are normally identified by 12CO(1-0) emission (e.g. Solomon et al. 1987 [S87]) as discrete features in space. They have a small volume fraction of the Galactic disk, but a significant mass fraction, , of gas inside the solar circle (Wolfire et al. 2003).
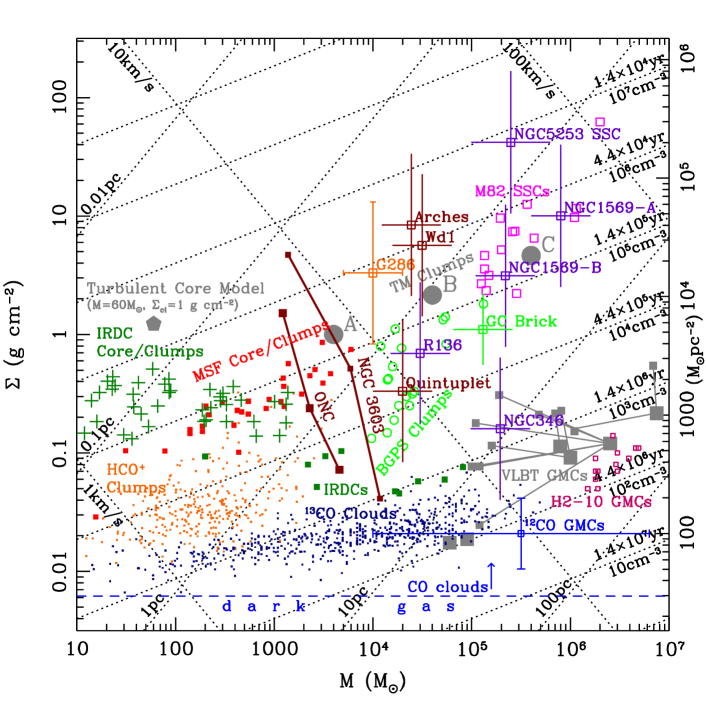
CO is dissociated by FUV photons, so CO-defined GMCs have a protective layer of molecular “dark gas” (Grenier et al. 2005). For the local FUV field, dust in two layers on each side of the cloud provide mag (van Dishoeck & Black 1988), i.e. or (we adopt , so mass per H, ). Figure 1, a diagram of vs. for molecular clouds and star clusters, indicates this level. GMCs have larger mean (or ) (§1.3). Nevertheless, significant fractions, , of total GMC molecular masses are predicted to be in the dark gas phase (Wolfire et al. 2010). The porous nature of GMCs increases FUV penetration and a large fraction, perhaps as high as 90%, of molecular gas can be considered to be part of Photodissociation Regions, where the FUV radiation field influences ionization, heating and chemistry (Hollenbach & Tielens 1999). The predicted equilibrium temperatures in the high extinction clumps within GMCs are K, corresponding to sound speeds of .
1.1 Methods to Measure Mass Surface Density, , of Molecular Clouds
(1) From 12CO via the “X-factor”: . Dame et al. (2001) estimate by first finding the ratio of FIR dust emission to total (HI-derived) column density, , around local, high latitude GMCs. This is used together with observed at the GMC, to predict the total at its location. The observed contribution from atomic gas is subtracted and the remainder compared to . Similar results are found using observed -ray emission (produced by cosmic rays interactions) to estimate total towards GMCs (e.g. Strong & Mattox 1996; Ackermann et al. 2011), which are then compared to HI and CO observations of these locations. Note, these methods allow detection of dark gas. Leroy et al. (2011) used the FIR emission method to measure in 5 nearby galaxies, finding it increased by a factor of in the lowest metallicity systems, NGC 6822 & SMC — interpreted as being due to the increasing dominance of dark gas in these relatively dust-free environments.
(2) From 13CO(1-0), typically assuming its excitation temperature, is the same as that derived from 12CO(1-0) (assumed to be optically thick). If the 13CO is subthermally excited, then will be underestimated. Note, Pineda et al. (2008) find that 60% of even the 12CO(1-0) emission in the Perseus GMC is subthermally excited. Given an adopted , can be derived, including corrections for its optical depth. Then the total follows, given an assumed abundance of 13CO with respect to : e.g. Roman-Duval et al. (2010, RD10) assume (Langer & Penzias 1990) and (Blake et al. 1987), so . is expected to vary with Galactic radius from at kpc to at kpc (Milam et al. 2005). is uncertain and may also show factor of variations: e.g. Lacy et al. (1994) find . Hernandez & Tan (2011) adopted and so in their study of two infrared dark clouds (IRDCs). With these choices and our preferred value of , the values of and of RD10 should be scaled by a factor 0.49 (§1.3 and Fig. 1).
(3) From other molecular line tracers, e.g. , , . The rarer isotopologues of CO, being harder to detect, tend to be observed towards higher clumps and cores within GMCs. A problem in the cold, dense conditions of IRDCs is CO freeze-out onto dust grains and thus its depletion from the gas phase. Widespread (extending over several pc) line-of-sight depletion factors, , (i.e. expected gas phase abundance relative to that observed) of were seen via compared to derived via MIR extinction mapping towards an IRDC by Hernandez et al. (2011). Larger values of were reported by Fontani et al. (2012) in more localized IRDC clumps via (3-2) compared to derived via FIR/submm emission. is often bright, but has an uncertain and likely variable abundance with respect to . It has a critical density , but line trapping can lower the effective to few, similar to that of optically thin (Evans 1999). CS can also be used to trace dense gas, especially utilizing the multiple higher transitions observable from the ground (e.g. Plume et al. 1997).
(4) From FIR/mm emission, requiring knowledge of dust temperature(s), , and opacity per unit gas mass, . Assuming optically thin transfer and black body dust emission, , where and . A common choice of is that due to the moderately coagulated thin ice mantle dust model of Ossenkopf & Henning (1994, OH94), which has an opacity per unit dust mass of . A gas-to-refractory-component-dust-mass ratio of 141 is estimated by Draine (2011), while 156 was assumed in the OH94 coagulation model, so . This method probes all mass along the line of sight, and thus is also sensitive to dark molecular and atomic gas. In the Galactic plane, the method gains utility for high clumps and cores within GMCs, which dominate the total line-of-sight column density. However, accounting for the surrounding diffuse emission is still needed (Battersby et al. 2011).
(5) From NIR extinction mapping, using background stars (e.g. Lada et al. 2007; Goodman et al. 2009), probing total line-of-sight (up to mag). This method depends on dust opacity in the NIR and the gas-to-dust mass ratio, but not . It has first, and most accurately, been applied to nearby GMCs that sit at relatively high Galactic latitudes. Kainulainen et al. (2011) used this method to study clouds in the Galactic plane, relying on statistical binning of sources in resolution elements of .
(6) From MIR extinction mapping, using diffuse Galactic background emission from hot dust. Spitzer images resolve to and probe high- (; mag) IRDCs (e.g. Butler & Tan 2009 [BT09]; 2012 [BT12]; Peretto & Fuller 2009). The method depends on (BT09 use [OH94]), but not . Allowance is made for foreground emission, best measured by finding “saturated” intensities towards independent, optically thick cores (BT12). Only differences in relative to local surroundings are probed, so the method is insensitive to low- environs of IRDCs. This limitation is addressed by combining NIR & MIR extinction maps (Kainulainen & Tan 2012 [KT12]).
Once is measured, cloud mass, , is found from projected angular area and an estimate of distance, typically kinematic for Galactic clouds. In the inner Galaxy, the near/far degeneracy may be broken by looking for HI self-absorption. For IRDCs, the near kinematic distance is often assumed. Kinematic distances are uncertain due to non-circular cloud motions caused by their disk-plane velocity dispersion or streaming due to spiral arms or bars. Parallax distances to masers associated with star formation are available for some sources (see, e.g. Reid et al. 2009; Foster et al. 2012).
1.2 Virial Equilibrium of Molecular Clouds
The 1D internal velocity dispersion, , of clouds is measured from their line widths. This allows assessment of cloud kinetic energy, , and comparison to gravitational energy, , where is a factor, , that accounts for nonspherical and nonuniform density distributions (Bertoldi & McKee 1992 [BM92]). BM92 find the effects of nonsphericity are quite small, so we neglect them here. For a power-law density distribution , for , respectively. BM92 define the virial parameter as . A cloud in virial equilibrium satisfies , where ( is the surface pressure around the cloud volume, ) and ( is the magnetic field far from the cloud and the integral extends beyond the cloud surface over regions where the B-field suffers distortions).
Molecular clouds are magnetized (Crutcher 2012), with observed values being consistent with a uniform distribution of total field strengths from 0 to a maximum, for , and for . However, in general we do not have accurate estimates of total field strengths in and around a given GMC or clump, making it difficult to assess its contribution to virial balance.
For a cloud satisfying the equilibrium virial equation, , where is the volume-averaged cloud pressure. For negligible surface pressure () and magnetic support (), , i.e. . Then, a gravitationally bound cloud has . If a cloud has , is raised by a factor of 2. If , is lowered by a factor of 2.
1.3 Giant Molecular Clouds
For 12CO-defined GMCs, S87 measured . However, Heyer et al. (2009, [H09]) measured for these same structures using 13CO. As discussed by H09, the true is likely to be lower than the S87 estimate due to incomplete sampling of the original 12CO maps, but the 13CO value may be underestimated because of subthermal excitation. We indicate the properties of Galactic 12CO-defined GMCs in Fig. 1 with and a mass range from to (Williams & McKee 1997). Several outer-Galaxy GMCs and their clumps were studied by Heyer et al. (2001), who found they had . Bolatto et al. (2008) studied GMCs in nearby galaxies, finding they generally had properties similar to Galactic GMCs. However, GMCs may differ in more extreme environments: e.g. 14 GMCs observed in the dwarf starburst Henize 2-10 have (Santangelo et al. 2009 [S09]).
The 13CO-defined Galactic GMCs and clumps of RD10 (with & scaled by 0.49, [§1.1]) are also shown in Fig. 1. For clouds with , , including dark gas. For this sample, considering reported by RD10 (increased by factors 2.02 to account for the mass scaling [§1.1] and 1.28 to match the BM92 definition, for total of 2.60; note, we neglect contribution of dark gas to ) we find . Also, 89% of these 249 GMCs (with 95% of the mass) have , i.e. are gravitationally bound. Similar results are obtained for -defined GMCs, if one allows for a factor 2 increase in H09 masses (above) and for the extragalactic GMCs studied by Bolatto et al. (2008).
GMCs that are gravitationally bound and near virial equilibrium explain H09’s result of a modified line-width vs. size relation: , which follows if and . Note, this may also explain the higher normalization of the relation seen in high- clumps (e.g. Plume et al. 1997), if they are also self-gravitating.
Thus we conclude that GMCs are gravitationally bound and have configurations that are consistent with being in approximate gravitational virial equilibrium ().
1.4 Clumps and Cores
Barnes et al. (2011 [B11]) derived the properties of a complete census of 300 clumps in a region of the Galactic plane (Fig. 1). While the absolute properties of individual sources are uncertain due to the assumed abundance and , relative properties should be more accurate. The most extreme (in & ) clump in this sample is G286 (Barnes et al. 2010 [B10]), which also contains an embedded, forming cluster.
Ginsburg et al. (2012 [G12]) presented properties of a census of massive () clumps found by 1.1 mm emission in the Bolocam Galactic Plane Survey (BGPS). In Fig. 1 we have scaled their (free-free-subtracted, K) masses by a factor of 1.47 to account for our preferred choice of (OH94). Longmore et al. (2012 [L12]) reported a comparable, cold, , 2.8 pc-radius Galactic center clump, dubbed the “Brick”. It shows little evidence of star formation activity.
Cold, high- regions of GMCs reveal themselves as IRDCs and 10 such clouds are shown in Fig. 1, with masses derived from the combined NIR+MIR extinction mapping method of KT12. We also show 42 core/clumps selected from these IRDCs by BT12, (properties derived for best-fitting singular polytropic sphere model). The structure is resolved interior to these radii down to ( pc at 4 kpc). The mean value of . If account is taken of the surrounding clump envelope, then . Some of these objects, as well as others reported by Bontemps et al. (2010), appear to be consistent in their properties with massive starless cores invoked in the Turbulent Core Model of massive star formation (MSF) (McKee & Tan 2003 [MT03]).
Mueller et al. (2002 [M02]) studied dense cores and clumps, selected by water maser activity to harbor MSF. For 31 sources, they derived the density and temperature structure by 1D radiative transfer modeling of the IR/submm emission, finding (however, these results may be affected by the presence of bipolar outflow cavities, Zhang & Tan 2011). For consistency, in Fig. 1 we have multiplied the M02 values of and by a factor of 1.56, and we show their properties at a scale where .
Most lower and and clumps appear pressure confined (e.g. BM92, B11), i.e. and their internal pressure is influenced more by the ambient pressure rather than by self-gravitating weight. Note, the clumps may still satisfy the equilibrium virial equation. Higher- clumps appear to be nearer gravitational virial equilibrium (i.e. internal pressure set by self-gravity to be ). This has been found in IRDC filaments (Hernandez et al. 2012), clumps (KT12) and cores (Tan et al., in prep.). In G286, B10 report a mass infall rate , highest in the B11 sample, but still 10 times less than the rate expected under global free-fall collapse.
1.5 Star Formation: Embedded and Young Star Clusters (YSCs)
The star formation efficiency per of GMCs and clumps is puny, (Zuckerman & Evans 1974; Krumholz & Tan 2007). It is unclear whether this is due mostly to support by turbulence (Krumholz & McKee 2005) or magnetic fields, although evidence for a threshold ( mag) for star formation (Lada et al. 2010) may indicate the importance of the latter (McKee 1989). Star formation is concentrated in clumps in GMCs, where total efficiencies can be achieved, as evidenced by bound YSCs. A ratio implies cluster formation times, (Tan et al. 2006).
Embedded star clusters provide a snapshot of the star cluster formation process. YSCs may also retain memory of the physical conditions of the gas clumps from which they formed, although modified by mass segregation, cluster core collapse, expansion due to gas massloss, and tidal stripping (see Portegies-Zwart et al. 2010 [PZMG10]). In Fig. 1 we show the Orion Nebula Cluster (ONC), with density structure from Hillenbrand & Hartmann (1998) with and estimated at the core, half-mass, , and total radii. These masses are virial mass estimates, and so receive contribution from both stars and gas. Similarly, we show NGC 3603 — a significantly more massive cluster (Harayama et al. 2008). The most massive known Galactic YSC is Westerlund 1, with dynamical mass and 0.86 pc (Mengel & Tacconi-Garman 2007). Harfst et al. (2010) modeled the expected initial conditions of the Arches cluster, near the Galactic Center, to match its observed stellar density distribution 2.5 Myr later. Their preferred best-fit model has an initial mass of (IMF uncertainties introduce larger errors) and a virial radius of 0.70 pc (i.e. pc). We show this half-mass condition in Fig. 1. The Quintuplet cluster currently has about 6,000 inside a radius of 0.5 pc (Hußmann et al. 2012), but being 4 Myr old, it is more difficult to reconstruct its initial conditions: we adopt , 2 pc (Figer et al. 2006; PZMG10).
In the 30 Doradus region of the LMC, R136 has (Andersen et al. 2009) and 1.7 pc (Hunter et al. 1995), similar to the dynamical mass estimate of Hénault-Brunet et al. (2012). NGC 346 is a much lower density star cluster (or association) in the SMC, with and pc. More massive, “Super Star Clusters” (SSCs) have been found in, e.g., the dwarf irregular galaxies NGC 1569 (cluster A with , pc, Anders et al. 2004, PZMG10; and B with , pc, Larsen et al. 2008) and NGC 5253 (, pc, Turner & Beck 2004) and in M82 (McCrady & Graham 2007) (Fig. 1).
A comparison of YSCs and gas clumps in the diagram (Fig. 1) suggests relatively massive starless (or at least gas-dominated) clumps do form, albeit rarely, that may be progenitors of the most massive Galactic clusters. These can have and . Star formation appears inhibited during assembly of these massive clumps. We suspect this is due to support by magnetic fields rather than turbulence, which would quickly decay (§2). It is not yet clear if starless clumps can form to be progenitors of SSCs. Central core densities of many YSCs exceed what is seen in gas clumps and may be the result of dynamical evolution of the cluster both during the star cluster formation process (especially if ) and after star formation has ceased.
2 Theoretical Models of Molecular Clouds
GMCs and clumps exhibit density structures on a wide range of scales, all the way down to those of forming stars. They contain motions, initially imprinted from the surroundings or due to self-gravity, and later due to feedback processes, that are many times the sound speed, leading to strong shocks. They are magnetized. They have poorly-defined boundaries, merging continuously into the surrounding galactic environment. These features make theoretical and numerical modeling of molecular clouds a challenging problem.
2.1 Turbulence and GMC Evolution
GMCs velocity dispersions are . Supersonic turbulence decays in dynamical time, (Stone et al. 1998; Mac Low et al. 1998) (for , ). Maintenance of turbulence is a constraint on models of GMC formation and evolution. McKee & Ostriker (2007 [MO07]) reviewed two conceptual frameworks: (1) GMCs are dynamic, transient and largely unbound, with turbulence driven by large-scale colliding atomic flows that form the clouds (e.g. Heitsch et al. 2005; Vázquez-Semadeni et al. 2011). These models do not explain why most GMCs are bound with (§1.3). Fast flows of HI around GMCs needed to form them quickly in have not been observed. Nor is it clear if such models are globally consistent with the relatively high mass fractions of gas in GMCs, at least inside the solar circle. (2) GMCs form by large-scale gravitational instabilities and are thus gravitationally bound with . Turbulence is maintained by contraction and then, later, star formation feedback (e.g. Goldbaum et al. 2011).
Here we present a third paradigm: GMC evolution under frequent cloud collisions (Tan 2000; Tasker & Tan 2009 [TT09]; Tan & Shaske, in prep.). In a galactic disk with Toomre and significant fraction, , of ISM gas mass in gravitationally bound clouds, (centers of which appear as GMCs), clouds suffer collisions on timescale,
| (1) |
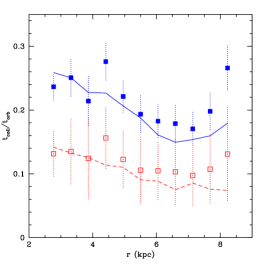
where is typical impact parameter of collisions (Gammie et al. 1991 [G91]), , is orbital speed at galactocentric radius , is number of GMCs per unit area, is GMC tidal radius of GMC at location of given and interior galactic mass , and is fraction of strong gravitational encounters that lead to collision. For and (G91), we have , where the last evaluation is for constant , i.e. . TT09 found approximate agreement with this result in their simulation of GMCs in a galactic disk. In Fig. 2a we evaluate eq. (1) for each TT09 GMC from Myr, and compare the predicted mean with that measured in the simulation. Good agreement is found for both the entire GMC sample and those with .
We balance the momentum injection rate due to cloud collisions, , with the dissipation rate within the clouds, , to predict typical GMC density and . We have , where the relative velocity , for which is the shear velocity at and is expected for typical added in quadrature with . Thus, . For turbulent dissipation we have . The turbulent energy dissipation rate has been measured in numerical simulations to be (see review by MO07), so that (in a cloud with and ). Thus the equilibrium value of for GMCs is
| (2) |
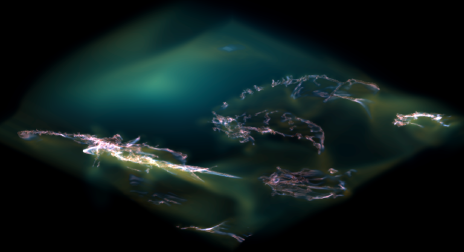
This fiducial value is similar to of the TT09 GMCs, suggesting momentum injection from collisions is maintaining their turbulence and setting their density. Several GMCs extracted from the TT09 simulation have been evolved to higher, 0.5 pc, resolution by Van Loo et al. (2012 [VLBT12]) (Fig. 2b). Dense clumps and filaments form, some reminiscent of IRDCs such as the pc-long “Nessie” filament (Jackson et al. 2010), but overall s of the GMCs remain quite constant (Fig. 1), with clouds supported by a turbulent energy cascade from larger scales, including via collisions.
Evaluating eq. (2) for Galactic conditions, where , and are somewhat smaller than in the TT09 simulation, then we obtain closer to the of observed GMCs. In addition to helping to maintaining turbulence, relatively frequent GMC collisions produce a wide spread in rotation directions (Dobbs 2008; TT09), split roughly evenly between pro and retrograde with respect to galactic rotation, as is seen in Galactic (Koda et al. 2006; Imara & Blitz 2011) and M33 (Imara et al. 2011) GMCs.
2.2 Star Cluster Formation and Feedback
How do so many O stars form together in the small volume of a massive YSC in the face of their mutual feedback of winds, ionizing photons and radiation pressure? Tan & McKee (2001 [TM01]; 2004), modeled feedback on clumps of given & , idealized as a population of cores in an intercore medium. To approximate turbulent motions, cores orbited freely in the clump potential. Stars were formed at constant rate, , with a near-Salpeter IMF, and placed at clump center. Wind, ionization and radiation pressure feedback were derived from Starburst99 models. The spherical average extent of the HII region was calculated balancing ionizing flux with recombinations, dust absorption and core shadowing. Cores exposed to ionizing flux were imploded with the magnetized radiation driven implosion models of Bertoldi & McKee (1990). Core dynamics included the photoevaporative rocket effect, as well as radiation pressure. Advection of neutral cores into the HII region and subsequent disruption maintained high ionized gas densities, thus confining the HII region. A momentum conserving stellar wind bubble swept-out the HII region center, its boundary set by balancing wind ram pressure with HII region thermal pressure. Star formation was stopped once the HII region neared the edge of the clump or after 3 Myr, at the onset of supernovae. Three example clumps were considered, A, B, C (Fig. 1), with and , resulting in , respectively. Feedback confinement and high enough to form a bound cluster occurred even when , the ionized gas sound speed.
Fall et al. (2010) presented a simpler analytic model that considers energy and momentum driven feedback on a clump with a smooth radial density profile. Numerical simulations of feedback interaction with clumpy and/or turbulent gas have been presented for: ionization by, e.g., Henney et al. (2009), Gritschneder et al. (2010), and Dale et al. (2012); for wind/supernova shocks by, e.g., Pittard et al. (2010); and for radiation pressure by, e.g., Krumholz & Thompson (2012). However, the challenge remains of combining and fully resolving all the processes thought important for star cluster formation.
Acknowledgements.
We thank P. Barnes, M. Butler, P. Caselli, S. Chatterjee, P. Crowther, F. Fontani, A. Hernandez, J. Kainulainen, S. Kong, B. Ma, C. McKee, L. Smith, E. Tasker, M. Wolfire, B. Wu & Y. Zhang for helpful discussions, and S. Skillman for the Enzo-yt visualization of Fig. 2b. JCT acknowledges support from grants NASA ATP09-0094, NASA ADAP10-0110 and NSF-CAREER AST-0645412 and REU Supplement (to SNS).References
- [] Ackermann, M. et al. 2011, ApJ, 726, 81
- [] Anders, P., de Grijs, R., Fritze-v. Alvensleben, U., & Bissantz, N. 2004, MNRAS, 347, 17
- [] Andersen, M. Zinnecker, H., Moneti, A. et al. 2009, ApJ, 707, 1347
- [] Barnes, P. J., Yonekura, Y., Fukui, Y. et al. 2011, ApJS, 196, 12 [B11]
- [] Barnes, P. J., Yonekura, Y., Ryder, S. D. et al. 2010, MNRAS, 402, 73 [B10]
- [] Battersby, C., Bally, J., Ginsburg, A. et al. 2011, A&A, 535, 128
- [] Bertoldi, F. & McKee, C. F. 1990, ApJ, 354, 529
- [] Bertoldi, F. & McKee, C. F. 1992, ApJ, 395, 140 [BM92]
- [] Blake, G. A., Sutton, E. C., Masson, C. R., & Phillips, T. G. 1987, ApJ, 315, 621
- [] Bolatto, A., Leroy, A. K., Rosolowsky, E., Walter, F. & Blitz, L. 2008, ApJ, 686, 948
- [] Bontemps, S., Motte, F., Csengeri, T. & Schneider, N. 2010, A&A, 524, 18
- [] Butler, M. J. & Tan, J. C. 2009, ApJ, 696, 484 [BT09]
- [] Butler, M. J. & Tan, J. C. 2012, ApJ, 754, 5 [BT12]
- [] Crutcher, R. M. 2012, ARA&A, 50, 29
- [] Dale, J. E., Ercolano, B., & Bonnell, I. A. 2012, MNRAS, 424, 377
- [] Dame, T. M., Hartmann, D., & Thaddeus, P. 2001, ApJ, 547, 792
- [] Dobbs, C. L. 2008, MNRAS, 391, 844
- [] Draine, B. T. 2011, Physics of the Interstellar and Intergalactic Medium, Princeton Univ. Press.
- [] Evans, N. J., II, 1999, ARA&A, 37, 311
- [] Fall, S. M., Krumholz, M. R., & Matzner, C. D. 2010, ApJ, 710, L142
- [] Figer, D. F., MacKenty, J. W., Robberto, M. 2006, ApJ, 643, 1166
- [] Fontani, F., Giannetti, A., Beltrán, M. T. et al. 2012, MNRAS, 423, 2342
- [] Foster, J. B., Stead, J. J., Benjamin, R. A., Hoare, M. G., Jackson, J. M. 2012, ApJ, 751, 157
- [] Gammie, C. F., Ostriker, J. P., & Jog, C. J. 1991, ApJ, 378, 565 [G91]
- [] Ginsburg, A., Bressert, E., Bally, J., & Battersby, C. 2012, ApJ, 758, L29 [G12]
- [] Goldbaum, N. J., Krumholz, M. R., Matzner, C. D. & McKee, C. F. 2011, ApJ, 738, 101
- [] Goodman, A. A., Pineda, J. E. & Schnee, S. L. 2009, ApJ, 692, 91
- [] Grenier, I. A., Casandjian, J.-M., & Terrier, R. 2005, Science, 307, 1292
- [] Gritschneder, M., Burkert, A., Naab, T., & Walch, S. 2010, ApJ, 723, 971
- [] Harayama, Y, Eisenhauer, F., & Martins, F. 2008, ApJ, 675, 1319
- [] Harfst, S., Portegies Zwart, S. & Stolte, A. 2010, MNRAS, 409, 628
- [] Heitsch, F., Burkert, A., Hartmann, L. W., Slyz, A. D., & Devriendt, J. 2005, ApJL, 633, L113
- [] Hénault-Brunet, V., Evans, C. J., Sana, H. et al. 2012, A&A, 546, A73
- [] Henney, W. J., Arthur, S. J., de Colle, F., & Mellema, G. 2009, MNRAS, 398, 157
- [] Hernandez, A. K., & Tan, J. C. 2011, ApJ, 730, 44
- [] Hernandez, A. K., Tan, J. C., Caselli, P. et al. 2011, ApJ, 738, 11
- [] Hernandez, A. K., Tan, J. C., Kainulainen, J. et al. 2012, ApJ, 756, L13
- [] Heyer, M. H., Carpenter, J. M., Snell, R. L. 2001, ApJ, 551, 852
- [] Heyer, M. H., Krawczyk, C., Duval, J., Jackson, J. M. 2009, ApJ, 699, 1092 [H09]
- [] Hillenbrand, L. A. & Hartmann, L. W. 1998, ApJ, 492, 540
- [] Hollenbach, D. J. & Tielens, A. G. G. M. 1999, Rev. of Modern Physics, 71, 173
- [] Hunter, D. A., Shaya, E. J., Scowen, P. et al. 1995, ApJ, 444, 758
- [] Hußmann, B., Stolte, A., Brandner, W. et al. 2012, A&A, 540, A57
- [] Imara, N., Bigiel, F. & Blitz, L. 2011, ApJ, 732, 79
- [] Imara, N. & Blitz, L. 2011, ApJ, 732, 78
- [] Jackson, J. M., Finn, S. C., Chambers, E. T., Rathborne, J. M., Simon, R. 2010, ApJ, 719, L185
- [] Kainulainen, J., Alves, J., Beuther, H., Henning, T. & Schuller, F. 2011, A&A, 536, 48
- [] Kainulainen, J., & Tan, J. C. 2012, A&A, in press (arXiv1210.8130) [KT12]
- [] Krumholz, M. R. & McKee, C. F. 2005, ApJ, 630, 250
- [] Krumholz, M. R. & Tan, J. C. 2007, ApJ, 654, 304
- [] Krumholz, M. R. & Thompson, T. A. 2012, ApJ, in press (arXiv:1203.2926)
- [] Koda, J., Sawada, T., Hasegawa, T., & Scoville, N. Z. 2006, ApJ, 638, 191
- [] Lacy, J. H., Knacke, R., Geballe, T. R., & Tokunaga, A. T. 1994, ApJ, 428, L69
- [] Lada, C. J., Alves, J. F., & Lombardi, M. 2007, Protostars and Planets V, B. Reipurth, D. Jewitt, and K. Keil (eds.), University of Arizona Press, Tucson, p.3
- [] Lada, C. J., Lombardi, M., & Alves, J. F. 2010, ApJ, 724, 687
- [] Langer, W. D., & Penzias, A. A. 1990, ApJ, 357, 477
- [] Larsen, S. S., Origlia, L., Brodi, J., & Gallagher, J. S. 2008, MNRAS, 383, 263
- [] Leroy, A. K., Bolatto, A., Gordon, K. et al. 2011, ApJ, 737, 12
- [] Longmore, S. N., Rathborne, J., Bastian, N. et al. 2012, ApJ, 746, 117 [L12]
- [] Mac Low, M.-M., Klessen, R. S., Burkert, A. & Smith, M. D. 1998, PRL, 80, 2754
- [] McCrady, N. & Graham, J. R. 2007, ApJ, 663, 844
- [] McKee, C. F. 1989, ApJ, 345, 782
- [] McKee, C. F. & Ostriker, E. C. 2007, ARA&A, 45, 565 [MO07]
- [] McKee, C. F. & Tan, J. C. 2003, ApJ, 585, 850 [MT03]
- [] Mengel, S. & Tacconi-Garman, L. E. 2007, A&A, 466, 151
- [] Milam, S. N., Savage, C., Brewster, M. A., & Ziurys, L. M. 2005, ApJ, 634, 1126
- [] Mueller, K. E., Shirley, Y. L.; Evans, N. J., II, Jacobson, H. R. 2002, ApJS, 143, 469 [M02]
- [] Ossenkopf, V. & Henning, Th. 1994, A&A, 291, 943 [OH94]
- [] Peretto, N., & Fuller, G. A. 2009, A&A, 505, 405
- [] Pineda, J. E., Caselli, P., & Goodman, A. A. 2008, ApJ, 679, 481
- [] Pittard, J. M., Hartquist, T. W., & Falle, S. A. E. G. 2010, MNRAS, 405, 821
- [] Plume, R., Jaffe, D., Evans, N., Martin-Pintado, J. & Gomez-Gonzalez, J. 1997, ApJ, 476, 730
- [] Portegies-Zwart, S. F., McMillam, S. L. W., & Gieles, M. 2010, ARA&A, 48, 431 [PZMG10]
- [] Reid, M. Menten, K. M., Zheng, X. W. et al. 2009, ApJ, 700, 137
- [] Roman-Duval, J., Jackson, J. M., Heyer, M., et al. 2010, ApJ, 723, 492 [RD10]
- [] Sabbi, E. Sirianna, M., Nota, A. et al. 2008, AJ, 135, 173
- [] Santangelo, G. Testi, L., Gregorini, L. et al. 2009, A&A, 501, 495 [S09]
- [] Solomon, P. M., Rivolo, A. R., Barrett, J., & Yahil, A. 1987, ApJ, 319, 730 [S87]
- [] Stone, J. M., Ostriker, E. C., & Gammie, C. F. 1998, ApJL, 508, L99
- [] Strong, A. W., & Mattox, J. R. 1996, A&A, 308, L21
- [] Tan, J. C. 2000, ApJ, 536, 173
- [] Tan, J. C., Krumholz, M. R. & McKee, C. F. 2006, ApJ, 641, L121
- [] Tan, J. C., & McKee, C. F. 2001, Starburst Galaxies: Near & Far, p188 (arXiv/0012005) [TM01]
- [] Tan, J. C., & McKee, C. F. 2004, The Formation and Evolution of Young Massive Clusters, ASP Conf. Ser. 322, 263 (arXiv/0403498)
- [] Tasker, E. J. & Tan, J. C. 2009, ApJ, 700, 358 [TT09]
- [] Turner, J. L. & Beck, S. C. 2004, ApJ, 602, L85
- [] van Dishoeck, E. F., & Black, J. H. 1988, ApJ, 334, 771
- [] Van Loo, S., Butler, M. J., & Tan, J. C. 2012, ApJ, submitted
- [] Vázquez-Semadeni, E., Banerjee, R, Gómez, G. C. et al. 2011, MNRAS, 414, 2511
- [] Williams, J. P., Blitz, L., Mckee, C. F. 2000, Protostars and Planets IV, Mannings, V., Boss, A.P., Russell, S. S. (eds.), Univ. of Arizona Press, Tucson, p. 97
- [] Williams, J. P. & McKee, C. F. 1997, Apj, 476, 166
- [] Wolfire, M. G., Hollenbach, D. & McKee, C. F. 2010, ApJ, 716, 1191
- [Wolfire et al.(2003)] Wolfire, M. G., McKee, C. F., Hollenbach, D., & Tielens, A. G. G. M. 2003, ApJ, 587, 278
- [] Zhang, Y. & Tan, J. C. 2011, ApJ, 733, 55
- [] Zuckerman, B. & Evans, N. J., II 1974, ApJ, 192, L149