The merger Seyfert galaxy Arp 220. Line and continuum absorption and emission
Abstract
The line and continuum spectra of the merger galaxy Arp 220 are analysed with the aim of investigating the ionizing and heating sources. We refer to radio, optical, infrared and X-ray spectra. The results show that in agreement with other merger galaxies, the optical lines are emitted from gas photoionised by the AGN and heated by the shocks in the extended NLR. The infrared lines are better explained by the emission from gas close to the starburst. The starburst dominates the infrared emission. [OI] and [CI] lines in the far-infrared are formed in the internal region of extended clouds and are therefore absorbed, while [CII] lines are emitted from the external edges of outflowing clouds. The O/H relative abundances are about solar and N/H are higher than solar by a factor 1.5, throughout the starburst region, while in the AGN extended NLR the O/H ratio is half solar. A relatively high dust-to-gas ratio is indicated by modelling the dust reprocessed radiation peak consistently with bremsstrahlung emitted from the clouds. The observed radio emission is thermal bremsstrahlung, while synchrotron radiation created by the Fermi mechanism at the shock front is absorbed.
keywords:
radiation mechanisms: general — shock waves — ISM: abundances — galaxies: Seyfert — galaxies: individual: Arp 2201 Introduction
We have been investigating the physical and chemical characteristics of some merger Seyfert galaxies on the basis of the observed spectra in the optical and infrared (IR) ranges (NGC 7212, Contini et al 2012, NGC 3393, Contini, 2012a, NGC 6240, Contini 2012b), with the aim of explaining the physical and chemical conditions of gas and dust, and looking for some records of the parent galaxy collision. We could find that collision records appear throughout the extended narrow line region (ENLR) as isolated patches of matter in abnormal conditions, such as high velocities, high densities and relatively high ionization-level lines.
An important question about mergers is whether starbursts or AGNs are the radiation sources (e.g. Gonzales-Alfonso et al 2004). We have analysed the spectra observed from the merger galaxies by models which account for the photoionizing flux from the AGN and from the starburst coupled with a shock wave hydrodynamic regime, which is suitable to the collisional characteristic of merging. We have found that generally, the optical line spectra are better reproduced by the AGN, while the IR line ratios are explained by the starburst.
The modelling of the spectra showed in particular that very young stars, such as Wolf-Rayet, are present in the centre of NGC 3393 whereas strong absorption from the Galaxy prevents to see them throughout the spectral energy distribution (SED) of the continuum. The relative abundances of the heavy elements are an important issue in mergers because they reveal whether primordial matter was trapped at the time of collision. We have found lower than solar metallicities in NGC 7212 and in NGC 3393 (except the high N/H which derives from the Wolf-Rayet wind). In NGC 6240, the C, N, O and Ar abundances relative to H appear higher than solar by a factor , because H is trapped into H2 molecules and therefore depleted from the gaseous phase. On the other hand S/H, Si/H and Fe/H show lower than solar abundances characteristic of the ISM included in the NLR during the merging process. Actually the high shock velocities exclude the hypothesis of trapping into grains due to sputtering.
In the present paper we will investigate Arp 220 (z=0.018), which is an ultraluminous infrared galaxy (ULIRG) with LIR 1012 L⊙ , at a distance of 72 Mpc (Graham et al 1990). The merger can be seen in Graham et al (1990) observations. The image at 2.2 m shows two resolved sources separated by a distance of 350 pc. The merging of two galaxies was revealed also by the disturbed morphology and the tidal tails. Graham et al discuss the distance of the nuclei and the age of the merger considering the starburst, the AGN, dust and gas. Taniguchi et al (2012) on the basis of the two tidal tails, suggest a multiple merging system for Arp 220, composed of four or more galaxies arising from a compact group of galaxies. The two compact radio peaks associated with the IR nuclei reveal that they are radio sources and not radio jets.
Molecular gas and massive young stars might contribute by 10% to the luminosity (Sturm et al. 1996) of Arp 220. A hidden AGN similar to a LINER (Rieke et al 1985) is revealed by the broad Br line (FWHM 1300 , DePoy et al. 1987). Rangwala et al. (2011) on the basis of observations by claim that the large column densities observed for molecular ions strongly favour the existence of an X-ray luminous AGN (10 s-1).
Wilson et al (2006) found more than 206 centrally concentrated clusters which can be classified into two groups : young and intermediate -age population of 10 and 300 Myr, respectively. Armus et al (1989) analysing the optical line fluxes for a sample of powerful far-infrared galaxies including Arp 220, claim that a young stellar population is present in all of them.
By modelling the spectra of Arp 220, we would like to add some information about mergers in general and Arp 220 in particular. We will carry on the investigation of the physical conditions and the abundances of the heavy elements throughout the NLR of close Seyfert galaxies which show merging, as was done for e.g. NGC 7212 and for NGC 3393 and NGC 6240 that show a double nucleus. Most observations of Arp 220 report on molecular bands, we will focus instead on the lines emitted and absorbed by the gas consistently with the continua emitted and absorbed by gas and dust. We will adopt models which account for photoionization by the AGN or by the starburst coupled to the shock hydrodynamics, which were assembled to investigate the NLR of AGN and the starburst galaxy environments (e.g. Viegas & Contini 1994 and references therein).
The nucleus of Arp 220 is heavily obscured (Smith et al 1989). The depth of the 10 m silicate band is only a lower limit. The observations of the continuum in the submillimeter have shown that the emission is optically thick even at wavelenths longer than 100 m (Emerson et al 1984). This demonstrates that extinction can reach Av=1000 mag. The mid-IR spectrum of Arp 220 indicates an active nucleus or plural active nuclei heavily obscured. In agreement with the other mergers, Arp 220 has most probably a central starburst of young stars. We will check these prediction by modelling the spectra in the different frequency ranges.
The observed optical line spectra (Veilleux et al. 1999) are not rich in number of lines, in particular, the very significant [OII]3727+3729 doublet is lacking. So we will constrain the models recalling the spectra emitted by NGC 6240, another merger galaxy at low redshift with characteristics similar to Arp 220. On the other hand, the continuum SED of Arp 220 is very well defined by a rich collection of observational data. The modelling of the line spectra must be consistent with the SED of the continuum, even if modelling the SED is less constraining (see Contini, 2012b). Previous models of Arp 220 SED were presented by Contini et al (2004) and by Contini & Contini (2007) on the basis of the data from the NED. The data were well reproduced in all the observed frequency ranges by a composite model accounting for the flux from the AGN and shocks (Contini et al 2004) and composite models of AGN and starburst and shocks (Contini & Contini 2007). Since then, the data from the NED were enriched and updated. Today, they better delineate the main physical mechanisms at the basis of the Arp 220 SED, namely bremsstrahlung from the gas, and reprocessed radiation from dust. Yet, only the line spectra will decide whether a power-law radiation from the AGN or the black-body radiation from the starburst characterises the photoionization source.
The modelling process is described in Sect. 2. The comparison of the calculated line ratios with the data appears in Sect. 3. Dust and gas continuum SEDs are presented and discussed in Sect. 4. Concluding remarks follow in Sect. 5.
2 Modelling procedure
2.1 About the observations
In the optical range we will refer to the spectrum observed by Veilleux et al. (1999). The spectroscopic data for Arp 220 are presented within the sample of IRAS 1 Jy sample of ULIRGs. They were observed by the Gold Cam Spectrograph on the Kitt Peak 2.1m telescope.
In the IR we will model the spectrum reported by Sturm et al (1996) that was obtained with the Short Wavelength Spectrometer (SWS) on board ISO. The data are constrained by the observations of 10-37 m spectra of ultraluminous infrared galaxies (ULIRGs) by Farrah et al (2007) taken using the Infrared Spectrograph on board of Spitzer. In particular, Sturm et al do not detect high excitation fine structure lines of [OIV], [NeV] and [NeVI] in Arp 220, suggesting that such lines are emitted from gas photoionised by a much harder radiation than that emitted by the starburst, or heated by a relatively strong shock. However their conclusion derives from diagnostic diagrams, namely, the [NeII] line limits are below the ranges observed by ISO in AGNs. Sturm et al claim that although a low luminosity AGN could be present, star formation are the dominant source of radiation in Arp 220. In fact IR lines are generally emitted from gas photoionised by massive star formed in a recent starburst.
Rangwala et al. (2011) detected two [CI] lines and one [NII] line ([NII]205) in emission. The ratio of [CI] line strength is 1.3 0.3, which suggests that the lines are optically thick, in agreement with the excitation temperature of 26 K derived from their temperature ratio (Stutzki et al 1997). [NII] 122 is observed in absorption. They report L([NII])/L(FIR) 1.7 10-5. Malhotra et al. (1997) wondering about the low L[NII] relative to L(FIR) claim that [NII] and [CII] come different regions, namely HII regions and photo-dissociation regions, respectively. The [CII] 158 deficiency is generally found in ULIRGs.
Luhman et al (1998) presented measurements of the [CII] 157.74 m fine-structure line in a sample of ULIRGs observed with the Long Wavelength Spectrometer (LWS) on the Infrared Space Observatory (ISO). They claim that the [C II] 158 line traces gas ionized by stellar far-ultraviolet (far-UV) photons with energies greater than 11.26 eV, the ionization potential of neutral carbon. The [CII] transition has a critical density of 3 103 and 50 for collisions with hydrogen and electrons, respectively (Flower & Launay 1977; Hayes & Nussbaumer 1984). Luhman et al. (2003) reporting the observations of the 157.74m - fine-structure line of C+ claim that it is the single brightest emission line in the spectrum of most galaxies, providing as much as 1% of the total far-infrared (FIR) luminosity (see, e.g., Stacey et al. 1991 and references therein). In Arp 220, as in most ULIRGs, the [CII] line is unusually weak. Only the [CII] 158 and OH 163 lines are clearly observed in emission. [OI] 63.2 is observed in absorption and [OI] 145.5 is not detected at all (Gonzalez-Alfonso et al. 2004).
2.2 The calculation code
The line and continuum spectra are calculated by the code suma111http://wise-obs.tau.ac.il/marcel/suma/index.htm which simulates the physical conditions of an emitting gaseous nebula under the coupled effect of photoionization from an external source and shocks. The calculations are described in detail by Viegas & Contini (1994 and references therein) and Contini et al. (2012 and references therein).
The input parameters which characterise the model are : the shock velocity , the atomic preshock density , the preshock magnetic field . They define the hydrodynamical field and are used in the calculations of the Rankine-Hugoniot equations at the shock front and downstream. These equations are combined into the compression equation which is resolved throughout each slab of the gas, in order to obtain the density profile downstream and consequently, the temperature. We adopt for all the models =10-4 gauss. In fact, a higher preshock density is compensated by a higher magnetic field which reduces compression and viceversa. We do not have enough data throughout the Arp 220 ENLR to avoid degeneration of models choosing between and effects on the density (see Contini 2009).
The input parameter that represents the radiation field is the power-law flux from the active center in number of photons cm-2 s-1 eV-1 at the Lyman limit, if the photoionization source is an active nucleus. The spectral indices are =-1.5 and =-0.7. is combined with the ionization parameter by = (/(n c ( -1)) (( - () (Contini & Aldrovandi, 1983), where is H ionization potential and is the high energy cutoff, n the density, the spectral index, and c the speed of light.
If the radiation flux is black body radiation from the stars, the input parameters are the colour temperature of the star and the ionization parameter (in number of photons per number of electrons at the nebula).
The secondary diffuse radiation emitted from the slabs of gas heated by the shocks is also calculated. The flux from the active centre, from the stars and the secondary radiation are calculated by radiation transfer throughout the slabs downstream.
The geometrical thickness of the emitting nebula , the dust-to-gas ratio , and the abundances of He, C, N, O, Ne, Mg, Si, S, A, and Fe relative to H are also accounted for. The distribution of the grain radius downstream is determined by sputtering, beginning with an initial radius of 0.5-2.5 m .
In our models the flux from an external source can reach the shock front (the inflow case, indicated by the parameter =0) or the edge of the cloud opposite to the shock front when the cloud propagates outwards from the AC or from the starburst (outflow, indicated by =1).
The fractional abundances of the ions are calculated resolving the ionization equations considering ionization by the primary flux, the secondary flux and collisional ionization in each slab downstream. The line intensity calculated in each slab depends strongly on the density, temperature, and radiation from both the sides of the cloud. The line intensities are integrated throughout the downstream region up to a distance from the shock front at which the gas has reached a relatively low temperature (T 103 K) in the case of inflow (radiation bound case) or to a distance such that all the calculated line ratios reproduce the observed ones (matter bound case). In the outflow case some iterations are necessary to obtain converging results.
The models which reproduce the observed strong lines within 20% and the weak lines by 50 % are selected from a large grid of models (see Contini 2012b). The relative sets of imput parameters are regarded as results. The approximation of calculated to observed line ratios should account for the observational errors and for the uncertainty of the physical coefficients adopted by the calculation code.
2.3 Model selection
| line | obs1 | m1pl | m2pl | m1sb | m2sb | msd |
|---|---|---|---|---|---|---|
| H | 1. | 1. | 1. | 1. | 1. | 1. |
| [OIII] 5007+ | 1.35 | 1.32 | 1.34 | 0.9 | 1.1 | 3. |
| [OI] 6300+ | 0.63 | 0.54 | 0.81 | 0.68 | 0.13 | 0.25 |
| [NII] 6584+ | 7.2 | 7.14 | 8.2 | 5.5 | 2.8 | 0.5 |
| [SII] 6716+ | 2.93 | 2.9 | 3.34 | 0.11 | 1. | 0.03 |
| H () | 3.3e-15 | 7.5e-4 | 7.3e-4 | 0.21 | 0.0024 | 0.039 |
| () | - | 300 | 400 | 300 | 400 | 1000 |
| () | - | 30 | 30 | 280 | 40 | 1000 |
| 2 | - | 2.5e8 | 2.5e8 | - | - | - |
| - | - | - | 20. | 8.e-3 | - | |
| (K) | - | - | - | 4.e4 | 4.5e4 | - |
| (cm) | - | 1.5e17 | 1.5e17 | 8.e18 | 3.e18 | 1.e17 |
| N/H | - | 1.4e-4 | 1.5e-4 | 1.5e-4 | 1.5e-4 | 9.1e-5 |
| O/H | - | 3.6e-4 | 3.6e-4 | 9.5e-4 | 9.6e-4 | 6.6e-4 |
| Si/H | - | 2.0e-6 | 2.0e-6 | 3.3e-6 | 3.3e-6 | 3.3e-5 |
| S/H | - | 1.1e-5 | 1.2e-5 | 1.6e-6 | 1.e-5 | 8.e-6 |
1 Veilleux et al (1998); 2 in photons cm-2 s-1 eV-1 at the Lyman limit
| line | obs1 | obs2 | m1pl | m2pl | m1sb | m2sb | msd |
| [MgVII] 8.87 | - | - | 0.061 | 0.068 | 0.004 | 0.012 | 0.001 |
| [ArIII] 8.99 | - | - | 0.734 | 0.634 | 0.317 | 0.131 | 0.053 |
| [FeVII] 9.5 | - | - | 0.022 | 0.025 | 0.001 | 0.004 | 0.000 |
| [SIV] 10.5 | - | 0.02 | 0.067 | 0.066 | 0.000 | 0.011 | 0.000 |
| [NeIII] 10.78 | - | - | 0.000 | 0.000 | 0.000 | 0.000 | 0.000 |
| [ClIV] 11.76 | - | - | 0.001 | 0.001 | 0.000 | 0.000 | 0.000 |
| [SIII] 12.0 | - | - | 0.000 | 0.000 | 0.000 | 0.000 | 0.000 |
| [NeII] 12.78 | 1. | 1. | 1.000 | 1.000 | 1.000 | 1.000 | 1.000 |
| [ArV] 13.07 | - | - | 0.019 | 0.023 | 0.001 | 0.003 | 0.000 |
| [MgV] 13.53 | - | - | 0.003 | 0.003 | 0.000 | 0.000 | 0.000 |
| [NeV] 14.3 | 0.045 | 0.072 | 0.082 | 0.004 | 0.012 | 0.001 | |
| [ClII] 14.34 | - | 0.04 | 0.006 | 0.004 | 0.001 | 0.003 | 0.005 |
| [NeIII] 15.6 | - | 0.12 | 6.828 | 5.536 | 13.230 | 0.390 | 0.776 |
| [SIII] 18.67 | 0.42 | 0.084 | 1.088 | 1.272 | 0.127 | 0.147 | 0.007 |
| [FeVI] 19.56 | - | - | 0.044 | 0.048 | 0.002 | 0.007 | 0.001 |
| [ClIV] 20.35 | - | - | 0.001 | 0.001 | 0.000 | 0.000 | 0.000 |
| [ArIII] 21.8 | - | - | 0.054 | 0.047 | 0.020 | 0.009 | 0.003 |
| [FeIII] 22.9 | - | - | 0.253 | 0.150 | 0.212 | 0.095 | 0.259 |
| [NeV] 24.17 | - | 0.2 | 0.099 | 0.113 | 0.005 | 0.016 | 0.002 |
| [OIV] 25.9 | 0.054 | 0.32 | 0.299 | 0.342 | 0.025 | 0.116 | 0.006 |
| [FeII] 26.0 | - | - | 3.133 | 2.826 | 4.740 | 1.055 | 0.434 |
| [OIII] 32.5 | - | - | 0.000 | 0.000 | 0.000 | 0.000 | 0.000 |
| [ClII] 33.4 | - | - | 0.000 | 0.000 | 0.000 | 0.000 | 0.000 |
| [SIII] 33.5 | 0.1 | 1.16?? | 1.598 | 1.887 | 0.152 | 0.171 | 0.006 |
| [SiII] 34.8 | 0.73 | 0.5 | 0.647 | 0.57 | 0.743 | 0.273 | 0.043 |
| [NeIII] 36.1 | - | 0.74?? | 0.598 | 0.484 | 0.923 | 0.033 | 0.052 |
| [OIII] 51.67 | - | - | 0.648 | 0.320 | 0.505 | 0.325 | 0.296 |
| [NeIII] 57.3 | - | - | 0.427 | 0.204 | 0.028 | 0.114 | 0.064 |
| [OI] 63.0 | - | - | 1.148 | 1.446 | 9.387 | 0.367 | 0.177 |
| [NII] 76.07 | - | - | 0.000 | 0.000 | 0.000 | 0.000 | 0.000 |
| [OIII] 87.3 | - | - | 0.478 | 0.207 | 0.069 | 0.146 | 0.039 |
| [NII] 121.5 | - | - | 0.643 | 0.466 | 0.063 | 0.125 | 0.010 |
| [OI] 147.0 | - | - | 0.095 | 0.123 | 0.559 | 0.028 | 0.011 |
| [CII] 158. | - | - | 0.739 | 0.800 | 0.159 | 0.118 | 0.016 |
| [NII] 205. | - | - | 0.144 | 0.102 | 0.007 | 0.0179 | 0.001 |
| [CII]158/[NII] 205 | 17. 3 | - | 5.33 | 8. | 22.8 | 6.59 | 314.8 |
| [NeII] ()12.8 | 2.2e-12 1 | 6.5e-13 | 2.3e-4 | 2.9e-4 | 0.028 | 1.38e-3 | 0.018 |
| [OI] 63 () | -6.35e-13 4 | - | 2.5e-4 | 4.2e-4 | 0.26 | 5.e-4 | 0.0066 |
| [OI] 145 () | 0.94e-13 4 | - | 2.e-5 | 3.5e-5 | 0.016 | 3.8e-5 | 1.9e-4 |
| [CII] 158 () | 9.99e-13 4 | - | 1.6e-4 | 2.3e-4 | 0.004 | 1.63e-4 | 8.5e-5 |
1 Sturm et al (1996); 2 Farrah et al (2007) 3 Rangwala et at. (2011); 4 Luhman et al (2003)
A large grid of models was run in order to avoid degeneracy. In other words we control the line ratios so that they cannot be reproduced within the allowed limits by models different from those selected (see Contini et al 2012 and references therein for a detailed description of modelling).
A first hint about the shock velocity is given by the FWHM of the line profiles and about the gas density by the [SII] 6717/6730 line ratios. Veilleux et al (1999) measured FWHM 300 for the Arp220 line profiles. Then, the first evaluations are slightly changed in order to obtain the best fit of all the line ratios to the data : within 20% for the strong lines and within 50 % for weak lines.
Our method of modelling starts as usually by reproducing the oxygen line ratios, because oxygen is present with lines from two or more different ionization levels. [OIII]/[OI] is adopted in the present modelling instead of the [OIII]/[OII] line ratios which are generally more significant, but the [OII] doublet is not given by the observations. The [OI] line strength depends strongly on , the geometrical thickness of the emitting cloud. In matter bound models the [OI]/H line ratios are not determined only by the physical conditions throughout the cloud, but also by the geometrical thickness of the cloud.
So far the physical conditions of the emitting gas are determined. The relative abundances to H of elements which appear through only one line in the spectrum are calculated by changing the relative solar value until the observed line ratio is satisfactorily reproduced.
In Table 1 (top panel) we compare model results with the optical spectrum observed by Veilleux et al (1999). The spectral line intensities were reddening corrected adopting E(B-V)=1.05. The correction has been done on the basis of the Balmer line ratios. In normal conditions of the emitting gas (densities between 103 and 105 and temperatures between 103 and 106 K) H /H 3 (Osterbrock 1989).
In Table 1 we refer the line ratios to H =1 in order to avoid problems of distances etc. . The absolute fluxes of H observed and calculated by the models are given in the last row of the top panel. Absolute fluxes are observed at Earth but calculated at the nebula, therefore they differ by a large factor which depends on the distance of the nebula from the AC and from the distance of the galaxy to Earth (see Sect. 5).
In the bottom panel of Table 1, we present the input parameters adopted by the models, followed by the relative abundances C/H, N/H, O/H, Si/H, S/H etc which show some variance from the solar ones (C/H=3.3 10-4, N/H=9.1 10-5, O/H=6.6 10-4, Ne/H=10-4, Mg/H=2.6 10-5, Si/H = 3.3 10-5, S/H=1.6 10-5, Fe/H=3.2 10-5 Allen 1976).
The models were selected from a large grid of outflowing clouds in both the cases of an AGN or a starburst. We tried to obtain an approximation to the observed line ratios within 50 %. We chosed the models in order to show how single parameters affect the results. The power-law flux from the AGN is considered for models m1pl and m2pl. The black body flux from the starburst is the photoionising source for models m1sb and m2sb. Recall that the models account for the coupled effects of an external photoionization source and shocks (Sect. 2.2). In the last column of Table 1 we present the results of a shock dominated model msd (F=0, U=0) calculated with =1000 and =1000 which were found adapted to reproduce the IR bump of the continuum SED (Contini et al. 2004).
In Table 2 we report the spectra presented by Sturm et al (1996) corrected for Av=50 mag and those presented by Farrah et al (2007) which were not corrected. Farrah et al (2007) in their table 2 show that the correction factors for line ratios within the 12.8-24.3 m range for different extinction laws, are within the observational error. In the FIR range extinction drops to zero (Draine 2009, fig. 1). The FIR data come from Luhman et al (2003) observations of [OI] and [CII] from LWS ISO and the [CI] lines at 492 and 809 GHz and [NII] at 1462 GHz were observed by Rangwala et al (2011).
The models which appear in Table 1 were selected in order to explain the optical lines, therefore they refer to H , whereas in the IR and far-IR ranges the lines are referred to [NeII] 12.8 which is a relatively strong line (Table 2). Moreover, Ne appears through lines in different ionization levels. Most of the observed IR line ratios are upper limits. We will show in the following that the [NeIII]15.6/[NeII]12.8 line ratio can be used to constrain the models.
In Table 2 the IR line ratios are calculated by the same models as those presented in Table 1, but the optical and infrared modelling are not normalized together because the observational spectra do not provide the data from optical to far-IR consistently. For a complex ensemble of different physical and chemical conditions such as the Arp 220 galaxy, different observations from different locations would be useful. We deal here with summed spectra while it is clear that optical and IR lines could come from different places. The low E(B-V) deduced by Veilleux et al shows that there are clouds reached by the AGN radiation, less obscured which can be seen in the optical range. In fact (Table 1) dusty clouds emitting the IR spectra have geometrical thickness not exceeding 1 pc, corresponding to fragmented matter at the shock front.
In the last line of the top panel of Table 2 we refer to [CII]/[NII]. In the bottom panel of Table 2 the absolute fluxes provided by the observations of some significant IR lines are reported as well as model results.
3 The line spectra
Examining the data of the optical spectrum reported in Table 1, Veilleux et al. (1999) could not decide whether the energy source in Arp220 is accretion into a massive black hole, or a starburst, or even shocks. We have demonstrated in previous works (e.g. Contini et al. 2002a and references therein) that shocks accompany the outward motion of clouds in the NLR of Seyfert galaxies, LINERs etc., even if radiation from the AC is the main photoionization source. In starburst galaxies the shock hydrodynamics is coupled to radiation from the stars. In merger Seyfert galaxies shocks are created by galaxy interaction, double AGN were observed and starbursts arise from collision of galactic matter. We suggest that all of the three energy sources should be accounted for in modelling the Arp 220 spectra.
3.1 Optical lines
Calculation results show that the models which reproduce within the accepted approximation the optical lines (Table 1) account for a shock velocity of 300-400 . The shocks are coupled to a photoionization power-law (pl) radiation flux corresponding to the AGN, in particular a LINER. In fact the flux intensity is rather low ( photon cm-1 s-1 eV-1 at the Lyman limit, Contini 1997) yielding a relatively low [OIII]5007/H . The low photoionizing radiation flux from the AGN is similar to that found in NGC 6240 (Contini 2012b).
The models selected to represent the gaseous clouds reached by the AGN radiation flux (m1pl and m2pl in Table 1) refer to outflow. They reproduce the observed line ratios within 15 %. Model m2pl calculated with =400 shows that a higher increases the temperature of the emitting gas, enhancing the lines corresponding to higher ionization levels (e.g. [OIV] and [NV], Table 2).
Starburst models (m1sb and m2sb in Table 1) are calculated with shock velocities similar to those adopted for pl dominated models, but the photoionizing flux is a black body radiation from the stars. Starburst (sb) models are calculated by a black body radiation corresponding to =4.0 - 4.5 104 K. The temperature of the stars is about in the norm (1-5 104 K). The clouds are outflowing. The corresponding spectra generally show weak low-level and neutral lines, due to the exponential character of the radiation flux.
From the geometrical thickness of the m1pl and m2sb clouds ( 1 pc), we understand that matter is strongly fragmented by the underlying turbulence at the shock front.
The optical line ratios corresponding to the sb models shown in Table 1 hardly fit the data. Model m1sb is anomalous, because to reproduce the relatively high [OI]/H an unusually high ionization parameter U=20 has been adopted. Even so, to reproduce the observed [SII] lines we would need S/H more than twice solar. This is unacceptable in general and in particular for Arp 220 where a large extinction has been measured and the observed 9.7 m absorption feature indicates that S may be locked up in silicate grains (Draine 2009). We have constrained the S/H relative abundance by the IR line ratios.
Cross-cecking the IR spectra, model m1sb overpredicts the [NeIII]15.6/[NeII]12.8 line ratio by a factor 100. The only way to lower this line ratio is to reduce drastically and/or U, which, however, yields a strong decrease of [OI]/H . Considering the discrepancies between calculated and observed data due to observational errors, approximation of the atomic parameters used by the models etc., we choose model m2sb as representative of the starburst models. Model m2sb calculated by U=0.008 shows discrepancies 60 % between calculated and observed low-ionization level and neutral line ratios. For [OIII]/H the discrepacy is 19 %. This model is a compromise between unacceptably low line ratios in the optical range and unacceptably high [NeIII]15.6/[[NeII]12.8 in the IR.
Tables 1 and 2 show that model m1pl better explains the optical spectrum, whereas model m2sb satisfactorily reproduces the IR line ratios. However, the nebulae emit both optical and IR lines. We will show in the following that the optical spectrum from m2sb and the IR spectrum from m1 (which also strongly overpredicts [NeIII] 15.6/[NeII] 12.8) do not contribute to the final total spectra.
Applying to the m2sb optical spectrum an extinction corresponding to E(B-V) 50 (Sturm et al. 1996) in the heavily obscured starburst region, the optical [OIII]/[OI] line ratio will sharply decrease (Draine, 2009, fig. 1), but more interestingly, the intensity of all the single lines will drop to zero considering that Iλ=Iλ0 e where = C f() (C=E(B-V)/0.77 and the extinction function f() in the optical range between H and H is of the order of 1 (Osterbrock 1989)). The optical lines from the starburst region will be unobservable. We can therefore accept a less accurate fit of the optical spectrum by models referring to the starburst and, reducing U 0.008, reproduce the [NeIII]/[NeII] line ratio within a factor of 20 %. Concluding, the optical spectrum corresponds to the AGN, even if the AGN is actually hidden. This will be discussed in Sect. 5.
3.2 IR lines
The IR observations of Arp 220 presented by Sturm et al (1996) and Farrah et al (2007) are adopted to model the IR lines. They appear in the second and third column of Table 2, respectively. To avoid problems of relative abundances, distances etc. we refer the IR line ratios to [NeII] 12.8. A large number of lines from different elements and different ionization levels were calculated and are presented in Table 2. The observed IR lines are hardly affected by extinction whichever E(B-V), because for 10 m f() tends to 0. The models are the same as those adopted for the calculation of the optical spectra (Table 1 bottom). The models referring to the starburst were constrained mostly by the upper limits of the IR data, while the models referring to the AGN were constrained by the observed optical line ratios. The IR line ratios are satisfactorily reproduced by starburst models corresponding to a black body flux corresponding to =4.0 - 4.5 104 K.
Notice that the absolute flux of [NeII] calculated by model m1pl is lower by a factor of 6 than that of m2sb. Moreover, summing up the IR lines of the two models m1pl and m2sb, the contribution of the IR spectrum from the starburst region will dominate adopting a weight =1 for the starburst contribution and =0.01 for that of the AGN. Also the shock dominated model msd shows [NeIII]15.6/[NeII]12.8 higher than observed by a factor of 6.4, therefore it should be added to the other contributions by a weight 0.1. This results agree with the starburst characteristic of the Arp 220 galaxy.
The modelling of the IR spectra also shows that Fe/H should be depleted from the gaseous phase by a factor 10. The O/H relative abundance is about half solar in the clouds reached by the AGN flux, while in the starburst environment it is higher than solar by a factor of 1.5 relatively to the Allen (1976) values but roughly solar adopting Anders & Grevesse (1989) O/H=8.5 10-4. N/H is higher than solar by a factor of 1.5 for both AGN and starburst clouds. Si/H is strongly depleted because locked into silicate grains. S/H is slightly depleted in clouds reached by the AGN flux, but it is reduced by a factor of 10 in the starburst clouds consistently with the strong obscuration. We suggest that the optical lines are emitted from clouds reached by the power-law flux from the AGN, even if the active nucleus (or active nuclei) is (are) hidden by a large amount of dust
3.3 Far-IR lines
In Table 2 (bottom panel) we report the absolute fluxes of the far-IR [OI] and [CII] lines observed and calculated by the same models which were used to model the optical and IR line ratios. The [CII]/[NII] line ratios depend not only on the physical conditions of the emitting gas, but also on the relative abundances. Table 2 shows that model m2sb underpredicts the observed line ratio by a factor 2. A N/H solar abundance would improve the fit.
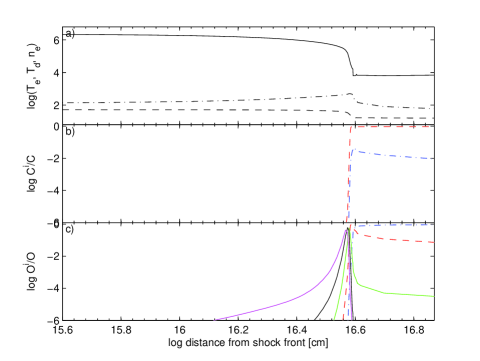
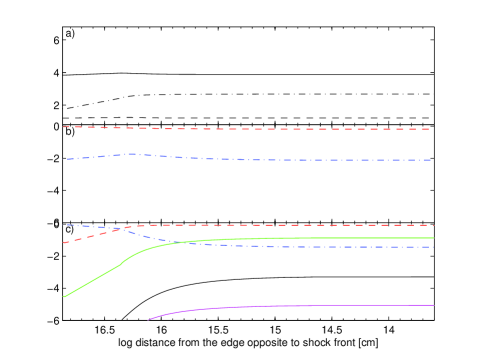
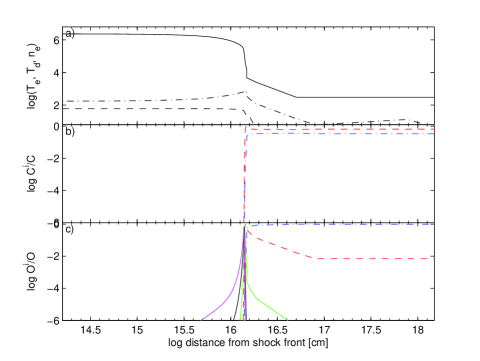
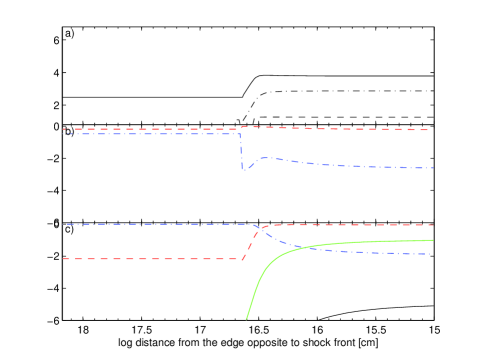
In order to understand why some neutral lines are seen in absorption and low ionization lines are seen in emission, we present in Fig. 1 the physical structure of the clouds corresponding to models m1pl and m2sb. In Fig. 1 we show the profile of the physical quantities , , and (electron temperature, dust temperature and electron density, respectively) and of the main fractional abundance of some significant ions throughout the clouds. Fig. 1 refers to the cloud reached by the pl flux from the AGN and Fig. 2 to the cloud reached by the black body (bb) ionizing flux from the starburst. Figs. 1 and 2 are divided into two halves in order to show the critical zones of recombination on both the edges (the shock front is at the left of the left panel and the edge reached by the photoionizing flux is at the right of the right panel).
The temperature profile is different throughout the pl and bb flux dominated clouds. After the steep drop due to gas recombination when the temperature reaches K, remains 104 K due to secondary radiation throughout most of the cloud in the pl case, while 103 K throughout most of the internal region of the bb radiation dominated cloud. Figs. 1 and 2 show that most of the neutral and low ionization level lines are emitted from the photoionized side of the cloud. In the pl case the [CII] lines are much stronger than [CI]. In fact, C0/C (Fig. 1, middle panel) is relatively low throughout all the pl dominated cloud. Relatively strong [OII] can be predicted in the spectrum presented in Table 1 because also [NII]/H is relatively high, not only due to a high N/H. On the other hand, [CI] and [CII] are both strong in the internal region of the bb cloud (Fig. 2) while [OI] is stronger than [OII]. In the bb case, the clouds are geometrically thick (=3. 1018 cm) and optically thick because the emission measure is high ( n(i) (i) (i) 3 1024 cm-6 cm, where (i) is the single slab thickness), therefore [CI] and [OI] lines are both absorbed throughout the internal region of the cloud. However, on the photoionized side of the bb cloud, at 3 1016 cm from the edge, the [CI] and [OI] lines drop while the [CII] and [OII] lines can be observed, although weak.
So far we have explained the [CI], [CII], [OI] line stength by the models which fit Arp 220 spectra. Now, extrapolating to Arp 220, we will consider the FIR observations of another galaxy, namely the Milky Way because many spectra are available at close positions near the Galactic Centre (GC) (Simpson et al 2007) and throughout the GC (Yasuda et al 2008). We investigate which of the input parameters adopted by the models which fit the observed IR spectra could explain the relatively weak [CII] 158 line observed in emission and the absorbed [OI] 63 line. We will use the results of the models calculated in previous works (Contini, 2009, Contini & Goldman 2011), where we presented the line ratios in the UV, optical and IR based on the models which explain the IR observations of the GC. The emitting clouds are photoionised by the bb flux from the star clusters and heated by the shocks.
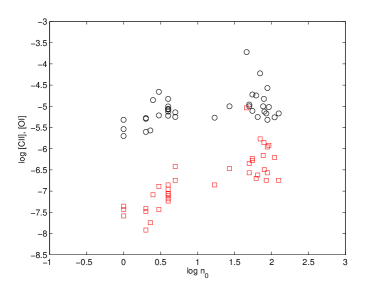
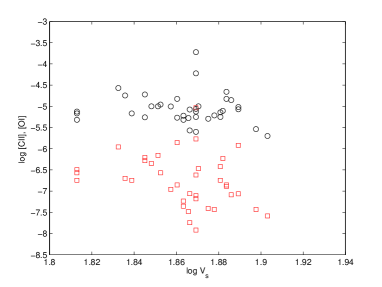
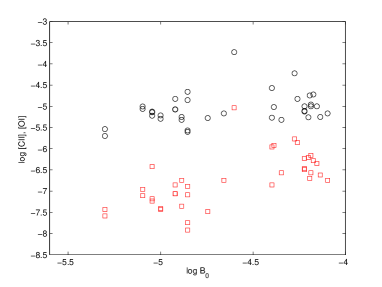
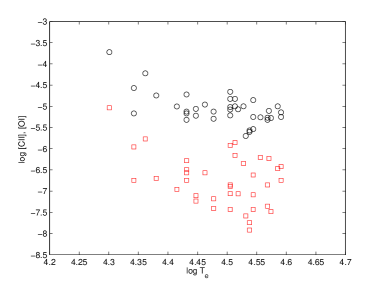
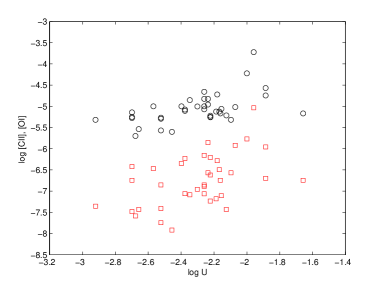
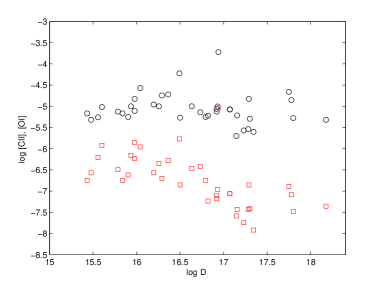
Although the physical conditions in the GC are not always similar to those found for Arp 220, we report in Fig. 3 the trend of [CII] and [OI] lines as function of the single input parameters, We would like to find out which parameter can explain the decrease of the [OI] lines relatively to [CII].
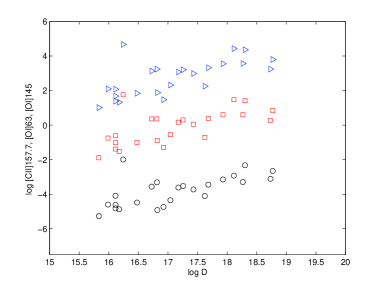
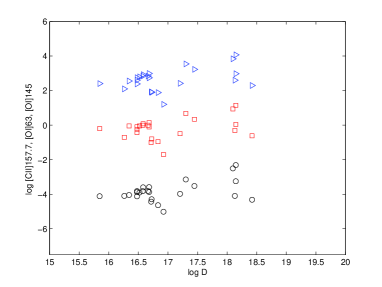
Fig. 3 shows that the preshock density combined with the geometrical thickness of the emitting clouds leads to a clear difference in the trends of [OI] and [CII], diverging at large . We find that both lines are reduced at high , low , low , therefore ULRIGs correspond to relatively young starbursts, but the different trends shown by the [CII] and [OI] lines indicate that the absorption of the [OI] line is due to a large geometrical thickness () of the clouds, leading to a large optical depth. However, when the geometrical depth is very large ( cm) and the flux is a pl from the AGN, the [CII] and [OI] lines both increase with . This appears in Fig. 4 where the line intensities are calculated for the clouds throughout the GC, adopting an AGN as the source of photoionization (Contini 2011). The calculated lines are constrained by the observations of the FIR lines by Yasuda et al (2008).


4 The SED of the continuum
Arp 220 continuum SED has been studied previously on a large frequency range (e.g. Contini, Viegas & Prieto 2004, Contini & Contini 2007) and in the IR domain (e.g. Rangwala et al. 2011).
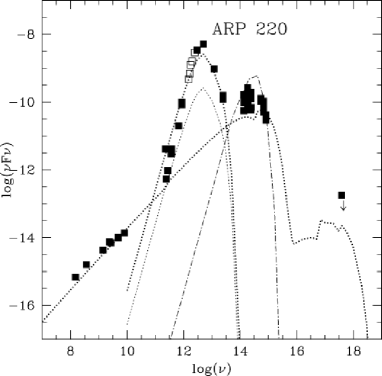
We report in Fig. 5 left and right panels the modelling of the SED based on a set of models which were selected investigating the IR bump of dust reprocessed radiation in AGN (Contini et al 2004, fig. A1) and by fitting the lines of luminous infrared galaxies by Contini & Contini (2007, fig. 6), respectively. It can be noticed (Fig. 5, left) that a model calculated by =1000 , =1000 , a pl flux F=1011 cm-2s-1eV-1 at the Lyman limit and d/g=0.004, agr=1 m , D=1018 cm, reproduces the whole dust reradiation bump, although two other models cannot be excluded (Fig. 5, right). One reproduces partially the data at higher frequencies ( =500 , =300 , U=10, =104 K, d/g=0.04, D=1019 cm) and the other at lower frequencies ( =150 , =100 , U=0.1, =104 K, d/g=3 10-5, D=1015 cm). A higher corresponds to a higher gas temperature downstream and, consequently, it yields a higher collisional heating of the grains by the gas. The fit of the reradiation bump by different models evidences the fact that the models cannot be constrained only by the continuum SED.
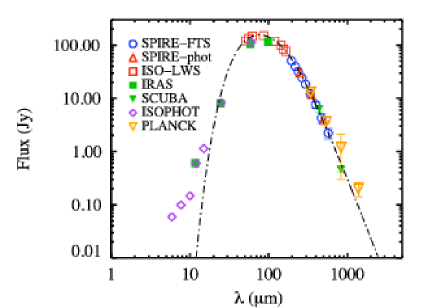
In Fig. 6 Rangwala et al (2011, fig. 3) is reproduced. Rangwala et al claim that Arp 220 data in the IR peak can be explained by the Planck function corresponding to one single temperature (T=66.7 K), as can be seen in detail in the right panel of Fig. 6. Indeed, Rangwala et al (2011, fig. 3) reproduces the IR peak of dust. Nevertheless, at wavelengths 20 m the data follow a different slope (Fig. 6, left panel).
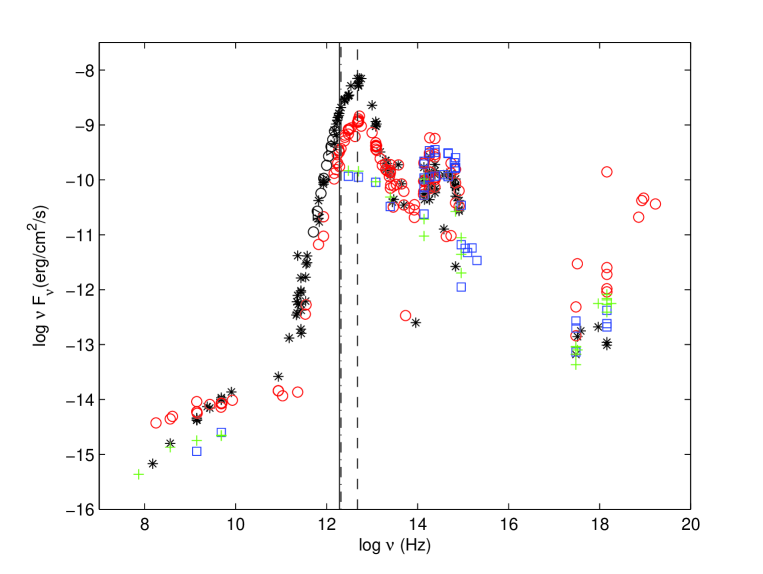
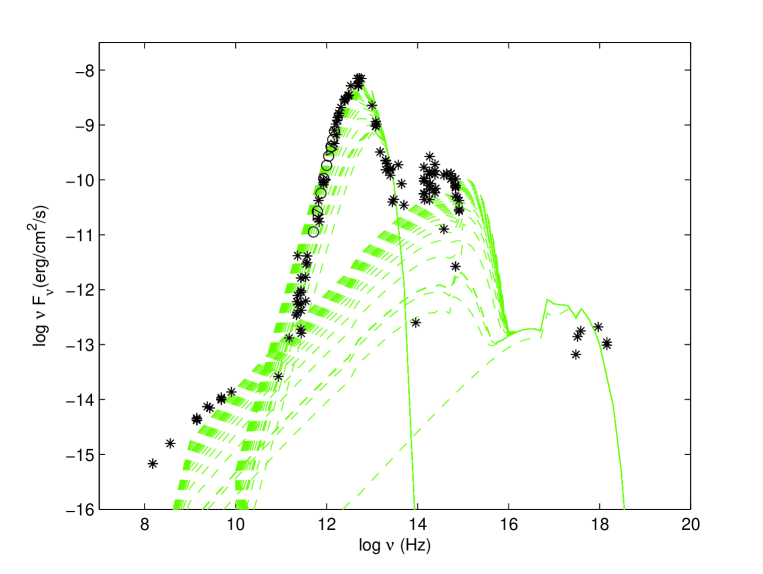
In Fig. 7 we compare the data of Arp 220 with the data presented for some other merger galaxies, NGC 3393, NGC 6240 and NGC 7212 which were previously investigated by a detailed modelling. We make use of the data from the NED for Arp 220 (Ueda et al 2001, Teng et al 2009, de Vaucouleurs et al (1991), Violet et al (2005) Koulouridis (2006), Zwicky et al (1963), Jason et al (2000), Weedman et al (2009), Klaas et al (2001), Gorjian et al (2004), Soifer et al. (1989), Spinoglio et al (2002), Brauher et al. (2008), Klaas et al (2001), Rigopoulou et al (1996) Eales et al (1989), Matsushita et al (2009), Dunne & Eales (2001), Anton et al (2004), Dunne (2000), Sakamoto et al (2009), Aalto et al (2009), Carico et al (1992), Thronson et al (1987), Chini et al (1986), Matsushita et al. (2009), Anton et al (2004), Imanishi et al (2007), Condon et al. (1983) Robert et al. (1991), Glen et al (1990), Condon et al (1983), Dressel et al (1978), Baan & Klockner (2006), Condon et al (1998), Condon et al (2002), White et al (1992) Douglas et al Waldram et al (1996) ). The black open circles and triangles come from Rangwala et al (2011).
The data from the NED were taken with different apertures and at different epochs, however, we have shown by modelling the continuum of the NGC 7212 galaxy (Contini et al 2012) that all the data are significant. In particular, the data taken with different large apertures are nested within the Plank function corresponding to the old star background temperature.
Comparing with the merger galaxy NGC 6240, an important issue about Arp 220 continuum appears. The radio synchrotron radiation created by the Fermi mechanism at the shock front is not seen. On the contrary, it is undoubtly present in many other ULIRGs (Contini & Contini 2007, fig. 6). The most probable explication is connected with the large amount of dust in Arp 220. Ginzburg & Syrovatskii (1965) claim that the intensity and polarization of magnetobremsstrahlung change following not only the source nature, but the nature of the medium where it propagates from source to Earth, I=I0 e-τ. A sharp decrease of the intensity will follow at low frequencies when becomes large. Moreover, when alternate regions of radiating and absorbing material (clouds) appear, as it is suggested by high fragmentation in Arp 220, there is a strong decrease of the flux at low frequencies. The original spectral index of the observed flux at the source will change, and will become similar to that of the thermal bremsstrahlung deleting any trace of synchrotron radiation.
In Fig. 7, comparing the SED from the NED data of Arp 220 with the SED of NGC 6240, we notice that the IR reradiation bump peaks at the same frequency ( 8 1012 Hz, but the intensity of the peak is higher for Arp 220 by about 1 order of magnitude, indicating a higher dust-to-gas ratio. Both galaxies show absorption at frequencies 1012 Hz. The old star black body flux shows that the old star temperature is similar for the two galaxies (4000 K). In Arp 220 the radio flux shows a steep slope, characteristic of thermal bremsstrahlung. It seems (presently) that Arp 220 is less luminous than NGC 6240 in the soft X-ray range.
We have traced upon the SED of the galaxies in Fig. 7 the frequencies corresponding to the [CII] 158, [OI] 63 and 145 lines. Interestingly these lines appear on top of the dust reradiation peak. The lines are emitted from the gas, while the IR peak from the dust. Fig. 7 suggests that at high ratios the far-IR lines can be underestimated (see also Contini 2011, fig.9).
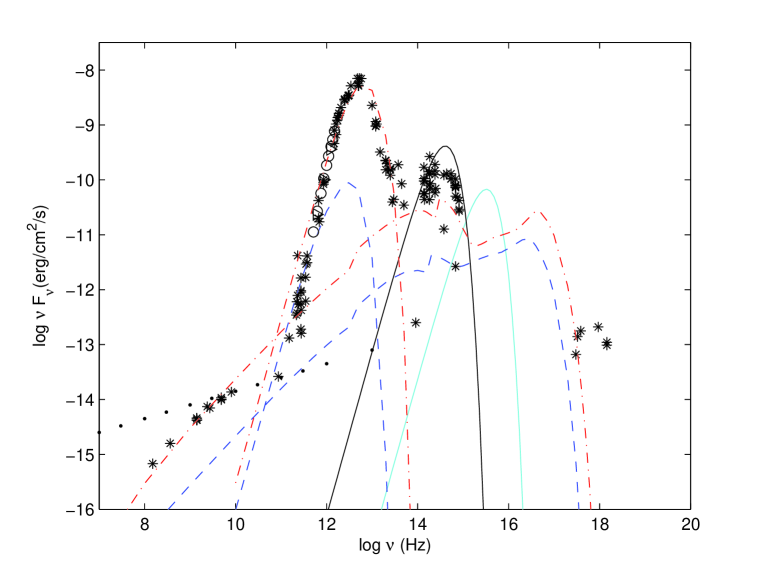
We would like to explain the SED of the continuum emitted from Arp 220 by the same models which were selected by the fit of the line ratios. The observations are rich of data throughout the extended range of frequencies, from radio to X-ray. In Fig. 8 (top panel) we compare the SED of the models with the data. Each model corresponds to two lines, one is the bremsstrahlung from the gas and the other is the dust reprocessed radiation flux. Model m1pl nicely fits the radio bremsstrahlung slope and the soft X-rays (blue lines). Model m2sb (red lines) is calculated by a grain radius agr=0.30 m and =0.02 by mass. It overpredicts the low frequency side of the dust reradiation bump, indicating absorption at 1012 Hz.
We show in Fig. 8 (bottom panel) the model calculated to fit the Arp 220 SED in a previous paper (Contini et al 2004) with a high =1000 , a high = 1000 , and a large agr=1 m . Those high velocities were suggested also by the broad Br reported by DePoy et al (1987). The model calculated with log()=11 reproduces satisfactorily the whole dust reradiation bump, explains the X-ray data and the data in the near-IR.
Recall that the models are calculated at the nebula while the data are observed at Earth. So the models are shifted on the Y-axis adopting relative weights which depend on (R/d)2, where R is the distance of the emitting clouds from the AC and d the distance from Earth. The radiation dominated high velocity model is shown in Fig. 8 adopting a very low (0.01) weight relative to the models explaining the line ratios (m1pl and m2sb).
The shock dominated model referring to =1000 yields acceptable IR line ratios (Table 2, model msd), while the high velocity model dominated by the radiation flux from the AGN leads to high [OIII]/H . However, these lines (which are not shown in Table 1 to avoid confusion) do not spoil the good fit to the data because they should be added to the lines emitted from the other models which appear in Table 1 with the same low relative weight used to fit the SED.
In particular, we show in Fig. 8 (bottom panel) the proceeding of the SED calculation by summing up the different slab contributions downstream (not all are shown in the figure for sake of clarity). The final SED profile results from the integration of the single slab emissions. In the IR peak, the continuum radiation from each single slab results from the Planck function corresponding to the temperature calculated in that slab. Actually, this temperature derives from the mutual heating and cooling of dust and gas.
5 Discussion and concluding remarks
| galaxy | z | model | agr | |||||||
|---|---|---|---|---|---|---|---|---|---|---|
| units1 | - | K | cm | m | by mass | |||||
| NGC 3393 2 | 0.0125 | pl | 100 | 3000 | 2.3e12 | - | - | 4.9e16 | 1. | 1.6e-4 |
| bb | 600 | 300 | - | 1. | 8.6e4 | 1.e17 | 1. | 2.e-4 | ||
| sd | 300 | 1500 | - | - | - | 1.e16 | 1. | 0.004 | ||
| sd | 1000 | 1500 | - | - | - | 3.e18 | 1. | 0.004 | ||
| NGC 6240 3 | 0.0245 | pl | 500-900 | 40 | 3.e8 | - | - | 6.e17 | 1. | 0.004 |
| bb | 500 | 68 | - | 0.002 | 5.e4 | 1.e19 | 1. | 4.e-4 | ||
| sd | 2000 | 500 | - | - | - | 1.e19 | 0.5 | 0.004 | ||
| Arp 220 4 | 0.018 | pl | 300 | 30 | 2.5e8 | - | - | 1.5e17 | 1.2 | 4.e-6 |
| bb | 400 | 40 | - | 0.008 | 4.5e4 | 3.e18 | 0.30 | 0.02 | ||
| sd | 1000 | 1000 | (1.e11) | - | - | 1.e17 | 1. | 4.e-4 | ||
| NGC 7212 5 | 0.0266 | pl | 110-550 | 70-120 | 7.e10 | - | - | 2.e17 | 1. | 4.e-4 |
1 in photon cm-2 s-1 eV-1 at the Lyman limit
Ages : 2 5 Myr (Mayer et al 2007) ;3 5 Myr (Engel et al 2010); 410-300 Myr (Wilson et al 2005);
5100 -1000 Myr (Ramos Almeida et al 2009)
| galaxy | mod | C/H | N/H | O/H | Si/H | S/H |
|---|---|---|---|---|---|---|
| 10-4 | 10-4 | 10-4 | 10-5 | 10-5 | ||
| NGC 3393 | pl1 | 2.3 | 1.8 | 6.6 | 3.3 | 1.6 |
| bb | 3.3 | 1.8 | 6.6 | 3.3 | 1.6 | |
| sd | 3.3 | 1.8 | 6.6 | 3.3 | 1.6 | |
| sd | 3.3 | 0.91 | 6.6 | 3.3 | 1.6 | |
| NGC 6240 | pl | 4.3 | 1.5 | 8.6 | 3.3 | 1.6 |
| bb | 4.5 | 1.5 | 9.6 | 2. | 0.4 | |
| sd | 4.0 | 1.5 | 9.6 | 3.3 | 1.6 | |
| Arp 220 | pl | 3.3 | 1.4 | 3.6 | 0.2 | 1.1 |
| bb | 3.3 | 1.5 | 9.6 | 0.33 | 1.0 | |
| sd | 3.3 | 0.91 | 6.6 | 3.3 | 0.8 | |
| NGC 7212 | pl | 3.3 | 0.3-2.3 | 2.6-6.6 | 3.3 | 0.37-2.8 |
1 Mg/H = 8.5e-6
The physical conditions and the relative abundances of heavy elements to H have been calculated by modelling the line and continuum spectra of Arp 220 in the optical and IR ranges. In Tables 3 and 4 we compare the results for Arp 220 with those obtained by the detailed modelling of other merger galaxies (NGC 3393, Contini 2012a, NGC 7212, Contini et al 2012, NGC 6240, Contini 2012b). The ages of the galaxies are given in the bottom of Table 3. The models which appear in Table 3, column 3, are characterised by the nature of the radiation flux, namely a power-law (pl), black body (bb), and shock dominated (sd) which indicates that =0 or =0.
5.1 Results for Arp 220
Although the line spectra of Arp 220 in the different frequency ranges are given by single observations covering all the different regions within the extended NLR, we can at least try to find the location of the clouds in the surroundings of the AGN and of the starburst. First notice that the clouds emitting the spectra show similar shock velocities and preshock densities. The preshock densities are similar to those calculated in the Milky Way ISM. The optical spectra observed from Arp 220 come from clouds reached by the AGN radiation flux, while the IR spectra are emitted from clouds close to the starburst. It seems that the strong obscuration in the galaxy central region is fragmented such as to allow to observe the optical spectrum from the NLR of the AGN.
The distance R of the emitting gas from the starburst and from the AGN, can be calculated combining the observed absolute flux observed at Earth with the absolute flux calculated at the nebula Fλ (obs) d2 =Fλ (calc) R2 , where d is the distance from Earth and can be regarded as the filling factor. For Arp 220 d=72 Mpc is adopted.
We refer to the absolute values of the [NeII]12.8, [CII] 158 and H lines as representative of the IR, far-IR and optical ranges, respectively. The results show that the clouds emitting the mid-IR and the far-IR lines, e.g. [NeII]12.8 and [CII]157, respectively, are at a distance R[NeII]=2.96 kpc and R[CII]=5.64 kpc from the starburst, adopting =1. In NGC 6240 the starburst fills the central kpc region encompassing the two nuclei (Engel et al. 2010). If the 4.5 104 K stars embody the central starburst of Arp 220, the clouds emitting the IR and FIR lines are close to it, therefore they are highly obscured in the optical range.
We have shown in Sect. 3.3 that the [OI]63, 145 and [CI] at 492 and 809 GHz lines are formed in the internal region of extended clouds and are therefore absorbed, while [CII] lines are emitted from the external edges. This confirms that the clouds are moving outwards. In fact, the temperatures on the edge of the cloud facing the radiation source reach a maximum of 2-3 104 K because the gas is heated by radiation. On the opposite edge, the gas is heated collisionally by the shock at temperatures which depend on . Figs. 1 and 2 show that the temperatures on the shock front are 106 K yielding to highly ionized gas. Such temperatures are certainly higher than those corresponding to the first ionization level lines. On the contrary, in the inflowing case, radiation from the external ionizing source would reach the clouds on the shock front, where collisional ionization dominates. Consequently the [CII] line emission will be restricted to a small region in the internal region of the clouds.
RHβ=1.51 kpc is the distance from the active centre of the optical emitting clouds, adopting =0.01 (Sect. 3.3). The optical emission comes from the extended NLR of the AGN, where the extinction is relatively low. The O/H ratio is lower than solar by a factor of 2 and S/H by a small factor of 1.4. We suggest that such low abundances are characteristic of matter included in the merger during the parent collision. The high velocity clouds are located at a distance of 66 kpc from the active centre.
The relative abundances (Table 3) calculated for the Arp 220 starburst show that O/H are higher than solar, while Si /H and S/H highly depleted, indicating inclusions into dust grains throughout the starburst region. A high dust-to-gas ratio is found by modelling the dust reprocessed radiation bump by the model which represents the clouds photoionised by the starburst. This could explain also the strong absorption of the synchrotron radiation created by the Fermi mechanism at the shock front which characterizes the Arp 220 radio SED. Only the radio thermal bremsstrahlung is seen in the continuum SED.
We have found that the dust reprocessed radiation bump in the IR is well reproduced by relatively large grains (agr=1 m ) accompanying the gas throughout the shock front and downstream for =1000 . Grains with agr=0.3 m are adopted in the model which represents clouds close to the starburst. They also yield a satisfactory fit of the IR bump but do not cover the X-ray domain. Grain growth up to cm-sized particles are predicted by Ubach et al (2012). So grains of 1 m size entering the shock front could be the product of former larger grain fragmentation.
5.2 Comparison with other merger AGN
We compare now the results of the physical conditions and of the relative abundances of the heavy elements, obtained for Arp 220 in previous sections with the results obtained by modelling other merger galaxies. Two AGNs were observed in the X-ray in NGC 3393 (Fabbiano et al 2011) and in NGC 6240 (Komossa et al 2003). In NGC 7212 the merging is confirmed by patches of gas emitting broad line profiles at the edges of the ENLR (Cracco et al. 2011).
Table 3 shows that the shock velocities are similar to those generally found in the NLR of AGN (100-1000 ). However, it is important for mergers to investigate the distribution of throughout the NLR in order to find out eventual collision records. The shock velocities are between 300 and 1000 , except for NGC 3393 and NGC 7212 where regions of low velocity survived to the galaxy collision throughout most of the NLR. The relatively high observed in some central regions and at the outer limits of the extended NLR shows residuals of collision. The shocked matter seems present throughout most of the NGC 3393 NLR, not only because of the high but because of the unexpectedly high close to the AGN. In the other galaxies presented in Table 3, the preshock densities range from 30-40-120 in NGC 6240, Arp 220 and NGC 7212, respectively.
A starburst was found in the centre of the merger galaxies, except in NGC 7212 where the eventual double AGN and the central starburst is not yet observed.
Relative abundances (Table 4) show generally a higher than solar N/H, by a factor of 1.5. except for NGC 7212 showing N/H depletion in most of the observed regions. In particular Arp 220 shows N/O 0.2-0.4, higher than the solar value N/O=0.15 (Allen 1976) and N/O=0.12 (Anders & Grevesse (1989). This result can be explained following Contini et al (2002b), namely the galaxy ISM can be enriched in nitrogen but not in oxygen during a long period of quiescence of intermediate-mass star evolution.
The results obtained by modelling the Arp 220 line and continuum spectra are only a hint to the real picture of the physical conditions throughout the galaxy. There is an urgent need of integral spectroscopy in order to have more information about the distribution of the physical and chemical quantities.
Aknowledgements
I am very grateful to the referee for important remarks which led to a more correct presentation of the results. I wish to thank Dr. N. Rangwala for allowing to reproduce fig.3 of Rangwala et al. (2011). This research has made use of the NASA Astrophysics Data System (ADS) and the NE D, which is operated by the Jet Propulsion Laboratory, California Institute of Technology, under contract with NASA.
References
Aalto, S.; Wilner, D.; Spaans, M.; Wiedner, M. C.; Sakamoto, K.; Black, J. H.; Caldas, M. 2009,A&A,493,481
Allen, C.W., 1976, Astrophysical Quantities, London: Athlone (3rd edition)
Anders, E., Grevesse, N. 1989, Geochin. Cosmochim. Acta, 53, 197
Anton, S.; Browne, I. W. A.; Marcha, M. J. M.; Bondi, M.; Polatidis, A. 2004,MNRAS,352,673
Armus, L., Heckman, T.M., Miley, G.K. 1989, ApJ, 347, 727
Armus, L. et al 2006, ApJ, 640, 210
Baan, W.A., Klockner, H. -R. 2006, A&A,449,559
Becker, R.H., White, R.L., Edwards, A.L. 1991,ApJS,75,1
Brauher, J. R.; Dale, D. A.; Helou, G. 2008, ApJS,178,280
Carico, D.P. , Keene, J., Soifer, B.T., Neugebauer, G. 1992, PASP,104,1086
Chini R., Kreysa E., Krugel E., Metger P.G. 1986. A&A, 166, L8
Condon, J.J., Cotton, W.D., Greisen, E.W., Yin, Q.F., Perley, R.A. Taylor, J.B., Broderick, J.J. 1998,AJ,115,1693
Condon, J.J., Cotton, W.D., Broderick, J.J. 2002,AJ,124,675
Condon, J.J., Condon, M.A., Broderick, J.J., Davis, M.M. 1983, AJ, 88, 20
Contini, M. 2012a, MNRAS, 452, 1205
Contini, M. 2012b, MNRAS, 426, 719
Contini, M., Cracco, V., Ciroi, S., La Mura, G. 2012, A&A, 545, 72
Contini, M., Goldman, I. 2011, MNRAS, 411, 792
Contini, M. 2009, MNRAS, 399, 1175
Contini, M. 2011 MNRAS, 418, 193
Contini, M. 2004, MNRAS, 348, 1065
Contini, M., Radovich, M., Rafanelli, P., Richter, G.M. 2002a, ApJ, 572. 124
Contini, M., Contini, T. 2007, AN, 328, 953
Contini, M.; Viegas, S. M.; Prieto, M. A. 2004, MNRAS, 348, 1065
Contini, M. 1997, A&A, 323, 71
Contini, M., Aldrovandi, S.M. 1983, A&A, 127, 15
Contini, T., Treyer, M. A., Sullivan, M., & Ellis, R. S. 2002b, MNRAS, 330, 75
Cracco, V. et al. 2011, MNRAS, 418, 2630
De Vaucouleurs, G., De Vaucouleurs, A., Corwin JR., H.G., Buta, R. J. Paturel, G., and Fouque, P. Third Reference Catalogue of Bright Galaxies, version 3.9 1991 vol. p. RC3.9
DePoy, D.L., Becklin, E.E., Geballe, T.R. 1987, ApJ, 316, 63
Douglas, J.N., Bash, F.N., Bozyan, F.A., Torrence, G.W. Dressel, L.L., Condon, J.J. 1978,ApJS,36,53
Draine, B.T. 2009, in Interstellar Dust from Astronomical Observations to Fundamental Studies, F. Boulanger, C. Joblin, A. Jones, and S. Madden (eds), EAS Publication Series, 35, 245,268
Dunne, L. and Eales, S.A. 2001, MNRAS, 327, 697
Dunne, L., Eales, S., Edmunds, M., Ivison, R., Alexander, P., Clements, D.L. 2000, MNRAS, 315,15
Eales, S.A., Wynn-Williams, C.G., Duncan, W.D. 1989,ApJ,339,859
Emerson, J.P., Clegg, P.E., Gee, G., Griffin, M.J., Cunningham, C.T., Brown, L.M.J., Robson, E.I., Longmore, A.J. 1984,Natur, 311,237
Engel, H. et al. 2010, A&A, 524, 56
Farrah, D. et al 2007, ApJ, 667, 149
Flower. D.R., Launay, J.M. 1977, JPhB, 10,3673
Ginzburg, V.L., Syrovatskii, S.L. 1965 ARA&A, 3, 297
Gonzalez-Alfonso, E., Smith, H.A., Fischer, J., Cernicharo, J. 2004, ApJ, 613, 261
Gorjian, V., Werner, M.W., Jarrett, T.H., Cole, D.M., and Ressler, M.E. 2004,ApJ,605,156
Graham, G.R., Carico, D.P., Matthews, K., Neugebauer, G., Soifer, B.T., Wilson, T.D. 1990, ApJ, 354, L5
Hayes, M.A. , Nussbaumer, H. 1984 A&A, 139, 233
Imanishi, M.; Nakanishi, K.; Tamura, Y.; Oi, N.; Kohno, K. 2007,AJ,134,2366
Jason A. Surace D. B. Sanders A. S. Evans 2000,ApJ,529,170
Klaas, U. et al. 2001,A&A,379,823
Komossa, S., Burwitz, V., Hasinger, G., Predehl, P., Kaastra, J.S., Ikebe, Y. 2003, ApJ, 582, L15
Koulouridis, E., Plionis, M., Chavushyan, V., Dultzin-Hacyan, D., Krongold, Y., Goudis, C 2006,ApJ,639,37
Langston, G.I., Helfin,M.B., Conner, S.R., Lehar, J., Carrilli, C.L., Burke, B.F. 1990,ApJS,72,621
Luhman, M.L. et al 1998, ApJ, 504, L11
Luhman, M.L., Satyapal, S., Fischer, J., Wolfire, M.G., Sturm, E., Dudley, C.C., Lutz, D., Genzel, R. 2003, ApJ, 594, 758
Malhotra, S. et al 1997 ApJ, 491, 27
Matsushita, S. et al. 2009,ApJ,693,56
Osterbrock, D.E. 1989 in Astrophysics of gaseous nebulae and active galactic nuclei/ University Science Books, 1989
Rangwala, N. et al. 2011 ApJ, 743, 94
Rieke, G.H., Cutri, R.M., Black, J.H. et al. 1985, ApJ 290, 116
Rigopoulou, D., Lawrence, A., Rowan-Robinson, M. 1996,MNRAS,278,1049
Sakamoto, K. et al. 2009,ApJ,700,L104
Simpson, J.P.; Colgan, S. W. J.; Cotera, A. S.; Erickson, E. F.; Hollenbach, D. J.; Kaufman, M. J.; Rubin, R. H. 2007, ApJ, 670, 111
Smith, C.H., Aitken, D.K., Roche, P.F. . 1989, MNRAS, 241, 425
Soifer, B.T., Boehmer, L., Neugebauer, G., and Sanders, D.B. 1989,AJ,98,766
Spinoglio, L., Andreani, P., Malkan, M.A. 2002,ApJ,572,105
Stacey, G. J.; Geis, N.; Genzel, R.; Lugten, J. B.; Poglitsch, A.; Sternberg, A.; Townes, C. H. 1991, ApJ, 373, 423
Stutzki, J. et al. 1997, ApJ, 477, L33
Taylor, V.A., Jansen, R.A., Windhorst, R.A., . Odewahn, S.C., Hibbard, J.E. 2005, ApJ, 630, 784
Teng, S.H. et al. 2009, ApJ, 691, 261
Thronson H.A., JR., Walker C.K., Walker C.E., Maloney P. 1987, ApJ, 318, 645
Ubach, C., Maddison, S.T., Wright, C.M., Wilner, D.J., Lommen, D.J.P. Koribalski, B. 2012arXiv1207,0260
Ueda, Y., Ishisaki, Y., Takahashi, T., Makishima, K., and Ohashi, T. 2001,ApJS,133,1
Veilleux, S., Kim, D.-C., Sanders, D.B. 1999, ApJ, 522,113
Viegas, S.M., Contini, M. 1994, ApJ, 428,113
Waldram, E.M., Yates, J.A., Riley, J.M. and Warner, P.J. 1996,AJ,111,1945
Weedman, D.W.; Houck, J.R. 2009,ApJ,698,1682
White, R.L., Becker, R.H. 1992, ApJS, 79, 331
Wilson, C.D., Harris, W.E., Longden, R., Scoville, N.Z. 2006, ApJ, 641, 763
Yasuda, A., Nakagawa, T., Spaans, M., Okada, Y., Kaneda, H. 2008, A&A, 480, 157
Zwicky, F., Herzog, E. ”Catalogue of Galaxies and of Clusters of Galaxies”, 1963, volume II, Pasadena: California Institute of Technology 1963 vol. p.