Effects of photon trapping on the properties of star-forming galaxies
Abstract
Recent observations show that a large number of Lyman-alpha emitters (LAEs) at high redshift have unusually high equivalent widths (). However, the origin of these high EWs is an open question. Here, we investigate the impacts of photon trapping on the EW and other properties by tracking the radiative transfer in spherical galactic clouds. We find that the delayed escape of the photons can change the properties significantly. During the transition phase from optically thick to optically thin where the photons can escape simultaneously, the EW can be boosted to , the luminosity can be increased by a factor of a few, and the line profile can be significantly broadened. The boost factor appears to depend on the galaxy properties such as mass and star formation rate and timescale, therefore future investigation combing 3D RT calculations with cosmological simulations of galaxy formation and evolution is needed to fully understand the properties of early star-forming galaxies.
keywords:
radiative transfer – galaxies: evolution – galaxies: formation – galaxies: high-redshift1 Introduction
The hydrogen line has played an important role in detecting distant galaxies. To date, a large population of emitters (LAEs) have been observed at high redshifts (e.g., Hu & McMahon 1996; Cowie & Hu 1998; Iye et al. 2006; Gawiser et al. 2006; Gronwall et al. 2007; Lai et al. 2008; Ouchi et al. 2008; Lehnert et al. 2010; Kashikawa et al. 2012; Shibuya et al. 2012). One of the important properties of is the equivalent width (EW), which measures the ratio of flux to that of the UV continuum, and therefore provides useful information of the emission mechanisms and photon escape processes in galaxies.
Unlike UV continuum, photons typically experience many scattering process in galaxies due to its large scattering cross section. These scatterings may prolong the path length and increase the probability of dust absorption, leading to reduction in the emergent luminosity. Hence, the EW can change significantly due to the difference in the radiative transfer (RT) process between and UV continuum. If the escape fraction of is the same as that of the UV continuum, the upper limit of the EW is determined by the intrinsic spectral energy distribution (SED) of the stars. It has been suggested that in the case of a Salpeter initial mass function (IMF), the upper limit is (e.g., Schaerer 2003).
However, a large number of LAEs at have large EWs higher than (e.g., Gronwall et al. 2007; Ouchi et al. 2008). More recently, Kashikawa et al. (2012) detected a LAE with extremely large EW of at . The origin of such high EWs is largely unknown.
It has been proposed that the large EWs may be produced by a top-heavy IMF of PopIII stars (e.g., Gronwall et al. 2007; Kashikawa et al. 2012). However, so far there is no evidence of a top-heavy IMF in high-redshift LAEs (e.g., Nagao et al. 2008), or a PopIII-dominated galaxy. Another model used a Salpeter IMF but invoked clumpy interstellar medium (Neufeld 1991; Hansen & Oh 2006). In this model, UV continuum is assumed to be absorbed by dust passing through the dense clouds, but photons do not experience the dust absorption because they cannot enter the clouds due to surface scattering. However, this is an idealized, optically thin case for the photons in emitting regions between the dense clouds. In fact, most of the stars form in high density clouds, they ionize the gas and create regions which emit photons. These photons then travel in the dense clouds and may experience strong dust extinction. Recently, Yajima et al. (2012b) studied the escape of and continuum photons from star-forming galaxies by combining a cosmological simulation with three-dimensional radiative transfer calculations, and found no correlation between the EW and clumpiness of the ISM. In addition, Laursen et al. (2012) studied the EWs of modeled galaxies with clumpy ISM, and showed that it was difficult to boost the EW with the typical physical state of LAEs. On the other hand, Yajima et al. (2012c) found that collisional excitation from accretion of cold hydrogen gas by galaxies at high redshift () significantly enhances the emission and boost the EW.
It is not clear, however, from our previous studies whether or not cold accretion is the only dominant mechanism to produce a large EW. In many RT calculations, all photons were assumed to escape instantaneously with the UV continuum. However, since the ionization of hydrogen evolves with time, this time-dependent propagation of the ionization front may cause a delay of the escape of the photons (Pierleoni et al. 2009), which in turn may affect the properties. However, the time evolution of ionization has not been considered in most RT calculations before.
In this work, we consider the pure effects of photon trapping on the properties. We perform full RT, which includes time-evolving ionization structure, in spherical galactic clouds, and track the resulting EW, luminosity, and line profiles. The paper is organized as follows: in § 2 we describe our galaxy models and RT methods, in § 3 we present the results of the properties, we discuss our model assumptions and parameters in § 4, and summarize in § 5.
2 Methodology
2.1 Galaxy Models
Our galaxy model consists of one-dimensional spherical shells of hydrogen gas in a spherical Navarro-Frenk-White dark matter halo (Navarro et al. 1997), similar to that of Dijkstra & Loeb (2009). The dark matter halo has a concentration parameter (Gao et al. 2008) at the virial temperature of the halo as derived by Makino et al. (1998) at . The gas is assumed to be in hydrostatic equilibrium with the virial temperature and then gets cold isothermal state with a temperature of , as suggested by Dijkstra & Loeb (2009), who showed that gas in galaxies can quickly reach the cold state of K as a result of balancing between gravitational-shock heating and radiative cooling. A total of 100 shells are constructed for each galaxy.
In addition, we assume star formation takes place at the center of the galaxy, with the rate SFR proportional to the halo mass (e.g., Trac & Cen 2007), and decays exponentially,
| (1) |
where and are amplitude factor of peak SFR and star formation timescale respectively. In this work, the and are free parameters with a range and yr. As fiducial models, we choose and with and (the peak SFR ranges ), as suggested by observations of LAEs from both clustering analysis (e.g., Gawiser et al. 2007; Ouchi et al. 2008, 2010; Guaita et al. 2010) and SED fitting (Gawiser et al. 2006, 2007; Finkelstein et al. 2009; Nakajima et al. 2012).
Along with the star formation history, newly formed stars are added to the galaxy center. We estimate the number of ionizing photons from stacked SEDs. The SED is calculated by summing that star clusters are created in each time step. We use PEGASE ver.2.0 (Fioc & Rocca 1997) to calculate the SEDs, and assume a Salpeter initial mass function with a metallicity of . In each time step, we estimate the ionization structure from the balance between recombination and photo-ionization,
| (2) |
where , , are the emissivity of ionizing photons, the radius of ionized region and the recombination rate to all excitation state, respectively. The gas at is completely ionized region, while at it is in neutral state.
2.2 Radiative Transfer
The RT calculations are performed using the 3D Monte Carlo RT code, All-wavelength Radiative Transfer with Adaptive Refinement Tree () (Li et al. 2008; Yajima et al. 2012a). The multi-wavelength continuum emission of is described in Li et al. (2008), while the implementation of line transfer is detailed in Yajima et al. (2012a). Here we focus on the RT of photons in the ionization structure of the galactic shells and briefly outline the process.
In the RT, it is important to calculate the frequency change due to the scattering process. In the scattering process, the final frequency in the laboratory frame is then:
| (3) |
where, and are incoming and outgoing frequency in the rest frame of scattering medium, respectively, the line center frequency Hz, corresponds to the Doppler frequency width and is the velocity dispersion of the Maxwellian distribution describing the thermal motions, i.e., , is the atom velocity, and are incoming and outgoing propagation direction respectively.
Unlike continuum photons, the photons can experience many scattering processes, which lead to long path length and long scattering timescale before the photons escape. As a result, the ionization structure may change while the photons are traveling. Here, we consider the change of ionization structure with time in the RT process. The optical depth is estimated to be , where and are indexes of the shell position and the time step, respectively. In each scattering, if the traveling of the moves to the next time step, the ionization structure of that time step is used to estimate the optical depth.
The intrinsic luminosity is estimated as:
| (4) |
where the constant 0.68 is the rate of transition from 2p to 1s state via the recombination process under the approximation of case B (Osterbrock 2006), and and are the frequency and the escape fraction of ionizing photons, respectively. The starting point of the photon package is randomly chosen with the weight by the emissivity of each spherical shell, , where is the shell index.
A total of 128 photon packets are used at each time step. Each packet has the same energy as the at the time step divided by the total packet number. The initial frequency is randomly chosen from a Gaussian distribution.
3 Results
3.1 Ionization History

Figure 1 shows the evolution of the star formation rate, the size of the ionized region, and the escape fraction of ionizing photons with time for a galaxy with mass , a star formation timescale yr, and a star formation amplitude factor . The SFR has an initial value of , but exponentially decreases with time. Since ionizing photons mainly come from massive, young stars, they are strongly correlated with SFR. As a result, in the early phase ( yr), the ionizing front reaches the virial radius (). Then, the ionization front steeply decreases with SFR, and becomes at yr.
In the current model of ionization, the of ionizing photons becomes when all gas in the galaxy is ionized. Therefore, the is nonzero at yr. It starts from , then decreases with SFR. When all gas is ionized, the is estimated by , where is the number of total recombination hydrogen, i.e., . In this case, is time-independent, and the is correlated with SFR.
3.2 Equivalent Width
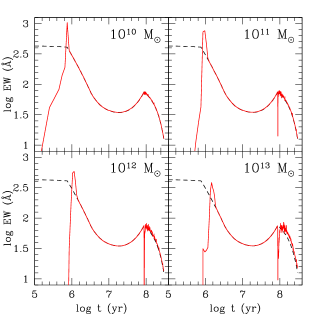
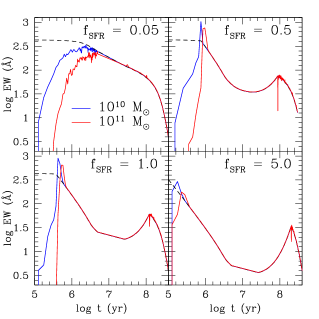
We estimate the EW in rest frame from , where is luminosity density of UV continuum, here we use the luminosity density at . Figure 2 shows the resulting time evolution of EWs with the fiducial values and yr, for 4 different galaxies in the mass range of .
At first, the ionized region is confined in the galaxy, then it grows with increasing stellar mass. In this phase, the photons are also confined in the galaxy, hence the EW is very small. However, when the ionization front reaches the virial radius, the trapped photons can escape simultaneously. This sudden release of photons causes very high EWs, which peaks , much higher than the upper limit predicted by the model in which all photons escape instantaneously.
Moreover, the peak of EW decreases with increasing halo mass. In low-mass galaxies, the potential well is shallow, and the virial radius is small, therefore it is easy for the ionizing photons to propagate and reach quickly. Since the ionization timescale of small galaxies is shorter than that of massive ones, by the end of ionization, a larger ratio of massive () to intermediate-mass stars may result due to the short lifetimes of massive stars. This would lead to larger EWs because more massive stars produce more emission via ionizing photons, while intermediate- or low-mass stars (which have long lifetimes) mainly contribute UV continuum. Therefore, small galaxies may produce larger EWs than massive ones. In addition, in the larger radius, the traveling time from last scattering to escape can change depending on the position and angle, resulting in the extended and smaller peak of EW.
Once the galaxy is ionized, the ionizing photons can escape, and the total recombination rate is fixed. From Equations (2) and (4), the intrinsic luminosity then becomes constant, . On the other hand, the UV continuum can continue to increase with the formation of new stars. Thus, upon completion of ionization, the intrinsic luminosity decreases relatively to UV continuum, resulting in a decrease of EW.
After that, however, the ionized region is confined within again due to decreased SFR. Most of photons are trapped within the galaxy by the neutral hydrogen shell. Some of the trapped photons can escape through scattering and random processes, leading to a mild increase of the EW. However, the UV continuum slowly catches up again with new star formation, bringing down the EW. For galaxies above , there are sharp dips at . This is the phase transition from complete to partial ionization, i.e., the gas shell of neutral hydrogen forms again. At the transition, photons start to be trapped by the shells, hence the EW decreases steeply. For the galaxy of , however, due to the smaller size, the photon traveling time is much smaller than the timestep of simulations, resulting in negligible decrease.
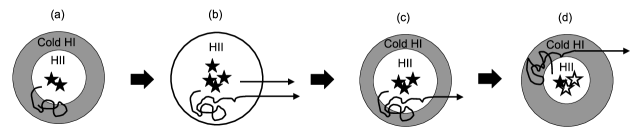
The interplay between and UV continuum photons in the RT processes results in a unique saddle-like shape of the EW as a function of time. To better understand the oscillatory behavior of the EW, we illustrate in Figure 3 a schematic cartoon of the time evolution of the ionization structure and the escape of photons. There are four major phases in the evolution which affect the EW significantly:
- (a):
-
Early phase when the ionized region is confined in the galaxy due to low SFR and stellar mass. Most of the photons are trapped in the galaxy. The resulting EW is very small.
- (b):
-
As more stars form, the flood of ionizing photons from young, massive stars quickly ionizes the galaxy. The previously trapped photons as well as the new ones created via recombination of the ionizing photons in the HII regions escape instantaneously, causing a sudden and strong boost of the EW.
- (c):
-
With the decline of SFR due to ionization, the number of ionizing photons is reduced, and the ionized region is confined in the galaxy again. The cooled and neutral hydrogen can trap the photons, leading to a decrease of the EW.
- (d):
-
As the stars become older and dimmer, the UV continuum flux decreases. Meanwhile, some of the trapped photons escape after some scatterings. Hence, the luminosity increases relatively to the UV continuum, bringing a rise of the EW again.
3.3 Luminosity
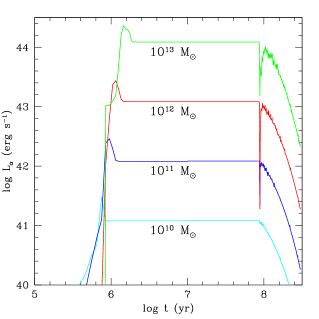
Owing to the time-dependence of the ionization structure, the emergent luminosity () from the galaxy evolves with time as well. Figure 4 shows the corresponding from the modeled galaxies as a function of time.
During Phase (a), the photons are trapped in the galaxy, the approaches to zero in the modeled galaxies. As the galaxy gradually becomes optically thin due to ionization, photons can escape, steadily increasing the luminosity. Upon Phase (b) when the galaxy is completely ionized, all the photons, including both the previously trapped and the newly created ones, escape instantaneously, resulting in a drastic, strong peak of the . After that, the ionized region is confined in the galaxy, the photons are trapped again as in Phase (c) and (d). But since the photons escape mainly through scattering, the fraction remains nearly constant during these phases, leading to constant luminosity. At the end of the star formation timescale, no more new stars form, the number of ionizing and photons declines sharply, so the galaxy becomes optically thick, and most of the photons become trapped, resulting in a rapid drop of the luminosity.
The evolution of the luminosity does not show the characteristic ”saddle” shape as the EW. This is because the luminosity depends only on the ionization structure and the escaping process, it does not depend strongly on the UV continuum as does the EW.
In contrast to the EW, which in general decreases with galaxy mass, the luminosity increases with galaxy mass. This is because both the SFR and the total recombination number are proportional to the galaxy mass, and as a result, the increases linearly with the galaxy mass.
3.4 Line Profiles
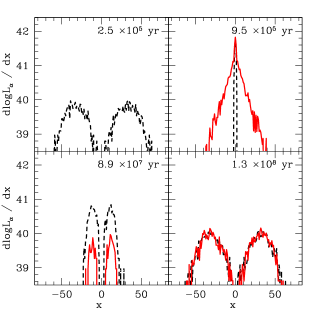
Figure 5 shows the emergent line profiles from the model which takes into account the delayed escape of photons due to the time-dependence of the ionization structure in the galaxy, in comparison with those without photon trapping.
At yr, which corresponds to Phase (a) in Figure 3, the delayed-escaping model predicts that the photons are trapped in the galaxy, there is no emergent line emission. In contrast, the instantaneous-escaping model predicts a double-peak profile caused by scattering of the neutral shells. At Phase (b) when the galaxy is completely ionized ( yr), the galaxy becomes optically thin. The line profile without the time dependence shows a narrow profile peaking around , which is the intrinsic profile, while the line from the trapping model shows not only the central peak, but also a significantly extended distribution in both the blue and red wings. The broadening is caused by the scatterings of the trapped photons before they escape. Then, in Phase (c) ( yr), the galaxy becomes optically thick again, the line profile thus shows double peak owing to scattering, and the luminosity from the trapping model is lower than that from the no-trapping model as expected. In Phase (d) ( yr), with the decline of SFR, the size of the ionized region becomes small. As a result, the optical depth from the center to the increases, the distance between the peaks in the profile thus increases, resulting in two broad double peaks.
4 DISCUSSIONS
In our model, there are two free parameters, the amplitude factor of peak SFR, , and star formation timescale, . In the previous sections, we have presented results using the fiducial numbers and yr. Here we explore the dependence of our results on these two parameters.
Figure 6 shows the EWs of two galaxies of and , respectively, with the same star formation timescale yr but different star formation factor . For , the ionized region is always confined in the galaxy owing to low SFR. Hence, there is no EW peak even at the Phase (b) in figure 3. The EW simply decreases with SFR as the mean stellar age becomes old. For , there is a EW peak at Phase (b). With higher , however, both the SFR and the mass of young stars are higher, leading to an earlier completion of ionization and higher UV continuum flux, which results in smaller EW.
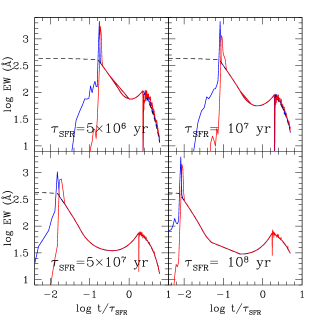
Figure 7 shows the EWs of two galaxies of and , respectively, with the same star formation factor but different star formation timescale . All plots show significantly boosted EW peak at Phase (b), and similar “saddle” shape of the evolution of EW. The difference among these models lies in the duration of Phase (c). With shorter , the the occurrence of Phase (b) is more significantly delayed, resulting in larger difference in the EW evolution between the trapping and non-trapping models.
These results suggest that the EW depend sensitively on the galaxy properties such as star formation rate and timescale. In order to fully address the origin and nature of the EW distribution in LAEs, it is desired to combine 3D RT calculations with full cosmological simulations which include more realistic treatments of star formation and feedback processes, which we plan to do in future work. In addition, 3D hydrodynamics and RT calculations would produce more realistic temperature structures. Here, we assume all gas to be K due to efficient radiative cooling. However, at outer low-density region, some fraction of gas can maintain high temperature near the virial temperature after gravitational shock. Such a detailed history of thermal evolution may change the ionization structure via collisional ionization process, which may lead to different evolution of EW.
In our galaxy model, LAEs are constructed as spherical clouds with embedded stars. If the morphological shape is disky or irregular, supernovae or radiative feedback can produce asymmetric gas ionization and outflow, which would facilitate escaping of ionizing photons. It was suggested that dense gas shells may still form and efficiently trap photons in the presence of galactic outflows in dwarf galaxies (Fujita et al. 2003). However, we note that the relation between EW and outflow gas velocity is a complicated issue as the EW depends sensitively on a number of factors such as ionization structure, dust content and metallicity (Yajima et al. 2012b). LAEs typically have high EWs and low gas outflow velocities, while Lyman Break Galaxies (LBGs), which are typically more massive and metal rich than LAEs, appear to have low EWs but high outflow velocities, as suggested by recent observations (McLinden et al. 2011; Finkelstein et al. 2011; Hashimoto et al. 2013). This may explain the “anti-correlation” between EW and velocity offset reported by Hashimoto et al. (2013) (as well as by Erb et al. 2013, in prep) in galaxy samples that contain both LAEs and LBGs. We plan to investigate the relation between EW and outflow gas velocity using a larger galaxy population that spans a wider range of and properties from cosmological simulations in the future.
In this work, we did not consider dust extinction and detection threshold of flux in observation. The dust extinction can reduce the EW due to smaller escape fraction of photons. However, recent observation indicated that the dust extinction of photons might be similar as that of UV continuum. If this is the case, the resulting EW may not be reduced significantly by the dust. On the other hand, imposing a detection threshold may reduce the EW here because we assume the flux is contributed by all photons. In regions with extended emission due to the scattering processes, the surface brightness may be below the survey threshold and not be detected. We will include more realistic treatments of these issues in future work using cosmological simulations.
5 SUMMARY
We have performed a set of RT calculations on idealized spherical galaxies to study the effects of photon trapping on the properties in star-forming galaxies, by taking into account the time dependence of the ionization process. We have identified four major phases in the evolution of the galaxy in our model:
-
•
Phase (a): The ionized region is confined in the galaxy due to low SFR and stellar mass. Most of the photons are trapped in the galaxy, no emergent emission is observed.
-
•
Phase (b): The galaxy is completely ionized. The previously trapped photons as well as the new ones created via recombination escape instantaneously, resulting in a dramatic and strong boost of the EW and luminosity, and a broadened line profile.
-
•
Phase (c): The ionized region is confined in the galaxy again due to decrease of SFR and ionizing photons. The photons are trapped again, leading to a decrease of the EW and luminosity.
-
•
Phase (d): The ionized region becomes smaller, as the stars become older and dimmer. The escape of the trapped photons is dominated by the stochastic scattering process. There is a small enhancement of the EW due to the decrease of the UV continuum flux, but the luminosity remains constant until the galaxy becomes strongly optically thick and trap most of the photons.
Our model suggests that the interplay between time-dependent ionization and scattering impacts significantly the EW, the emergent luminosity, and the line profile. During the transition phase from optically thick to optically thin where the photons can escape simultaneously, the EW can be boosted to , the luminosity can be increased by a factor of a few, and the line profile can be significantly broadened. These results may be able to explain the unusually large EW in some observed LAEs. However, the boost factor depends on the galaxy properties such as mass and star formation rate and timescale, future investigation combing 3D RT calculations with cosmological simulations of galaxy formation and evolution is needed to fully address this issue.
Acknowledgments
We thank Masakazu A. R. Kobayashi, Tom Abel and Masayuki Umemura for stimulating discussions and helpful comments, as well as the referee for a constructive report which has helped improve the paper. Support from NSF grants AST-0965694 and AST-1009867 is gratefully acknowledged. We acknowledge the Research Computing and Cyberinfrastructure unit of Information Technology Services at The Pennsylvania State University for providing computational resources and services that have contributed to the research results reported in this paper (URL: http://rcc.its.psu.edu). The Institute for Gravitation and the Cosmos is supported by the Eberly College of Science and the Office of the Senior Vice President for Research at the Pennsylvania State University.
References
- Cowie & Hu (1998) Cowie L. L., Hu E. M., 1998, AJ, 115, 1319
- Dijkstra & Loeb (2009) Dijkstra M., Loeb A., 2009, MNRAS, 400, 1109
- Finkelstein et al. (2009) Finkelstein S. L., Rhoads, J. E., Malhotra S., Grogin N., 2009, ApJ, 691, 465
- Finkelstein et al. (2011) Finkelstein S. L. et al., 2011, ApJ, 729, 140
- Fioc & Rocca (1997) Fioc M., Rocca V. B., 1997, A& A, 326, 950
- Fujita et al. (2003) Fujita A., Martin C. L., Mac Low M.-M., Abel T., 2003, ApJ, 599, 50
- Gao et al. (2008) Gao L., Navarro J. F., Cole S., Frenk C. S., White S. D. M., Springel V., Jenkins A., Neto A. F., 2008, MNRAS, 387, 536
- Gawiser et al. (2006) Gawiser E. et al., 2006, ApJ, 642, L13
- Gawiser et al. (2007) Gawiser E. et al., 2007, ApJ, 671, 278
- Guaita et al. (2010) Guaita L. et al, 2010, ApJ, 714, 255
- Gronwall et al. (2007) Gronwall C. et al, 2007, ApJ, 667, 79
- Hansen & Oh (2006) Hansen M., Oh S. P., 2006, MNRAS, 367, 979
- Hashimoto et al. (2013) Hashimoto T., Ouchi M., Shimasaku K., Ono Y., Nakajima K., Rauch M., Lee J., Okamura S., 2013, ApJ, 765, 70
- Hu & McMahon (1996) Hu E. M., McMahon R. G., 1996, Nature, 382, 231
- Iye et al. (2006) Iye M. et al., 2006, Nature, 443, 186
- Kashikawa et al. (2012) Kashikawa N. et al., 2012, ApJ, 761, 85
- Lai et al. (2008) Lai K. et al., 2008, ApJ, 674, 70
- Laursen et al. (2009) Laursen P., Razoumov A. O., Sommer-Larsen J., 2009, ApJ, 696, 853
- Lehnert et al. (2010) Lehnert M. D. et al., 2010, Nature, 467, 940
- Li et al. (2008) Li Y., Hopkins P. F., Hernquist L., Finkbeiner D. P., Cox T. J., Springel V., Jiang L., Fan X., Yoshida N., 2008, ApJ, 678, 41
- Makino et al. (1998) Makino N., Sasaki S., Suto Y., 1998, ApJ, 497, 555
- McLinden et al. (2011) McLinden E. M. et al., 2011, ApJ, 730, 136
- Nagao et al. (2008) Nagao T. et al., 2008, ApJ, 680, 100
- Nakajima et al. (2012) Nakajima K. et al., 2012, ApJ, 745, 12
- Navarro et al. (1997) Navarro J. F., Frenk C. S., White S. D. M., 1997, ApJ, 490, 493
- Neufeld (1991) Neufeld D. A., 1991, ApJ, 370, L85
- Ouchi et al. (2008) Ouchi M. et al., 2008, ApJS, 176, 301
- Ouchi et al. (2010) Ouchi M. et al., 2010, ApJ, 723, 869
- Pierleoni et al. (2009) Pierleoni M., Maselli A., Ciardi B., 2009, MNRAS, 393, 872
- Schaerer (2003) Schaerer D., 2003, A&A, 397, 527
- Shibuya et al. (2012) Shibuya T., Kashikawa N., Ota K., Iye M., Ouchi M., Furusawa H., Shimasaku K., Hattori T., 2012, ApJ, 752, 114
- Trac & Cen (2007) Trac H., Cen R., 2007, ApJ, 671, 1
- Verhamme et al. (2008) Verhamme, A. and Schaerer, D. and Atek, H. and Tapken, C., 2008, A&A, 491, 89
- Yajima et al. (2012a) Yajima H., Li Y., Zhu Q., Abel T., 2012a, MNRAS, 424, 884
- Yajima et al. (2012b) Yajima H., Li Y., Zhu Q., Abel T., Gronwall C., Ciardullo R., 2012b, MNRAS, submitted, arXiv: 1209.5842
- Yajima et al. (2012c) Yajima H., Li Y., Zhu Q., Abel T., Gronwall C., Ciardullo R., 2012c, ApJ, 754, 118