The Ionized Circumstellar Envelopes of Orion Source I
and the Becklin-Neugebauer Object
Abstract
The 229 GHz (1.3mm) radio emission from Orion-KL was mapped with up to angular resolution with CARMA, allowing measurements of the flux densities of Source I (‘SrcI’) and the Becklin-Neugebauer Object (BN), the 2 most massive stars in this region. We find integrated flux densities of mJy for SrcI and mJy for BN. SrcI is optically thick even at 229 GHz. No trace of the H30 recombination line is seen in its spectrum, although the =1, 5(5,0)-6(4,3) transition of H2O, 3450 K above the ground state, is prominent. SrcI is elongated at position angle 140∘, as in 43 GHz images. These results are most easily reconciled with models in which the radio emission from SrcI arises via the H- free-free opacity in a T K disk, as considered by Reid et al. (2007). By contrast, the radio spectrum of BN is consistent with p+/e- free-free emission from a dense ( cm-3), but otherwise conventional, hypercompact HII region. The source is becoming optically thin at 229 GHz, and the H30 recombination line, at VLSR= km s-1, is prominent in its spectrum. A Lyman continuum flux of photons s-1, consistent with that expected from a B star, is required to maintain the ionization. Supplementary 90 GHz observations were made to measure the H41 and H42 recombination lines toward BN. Published 43 and 86 GHz data suggest that SrcI brightened with respect to BN over the 15 year period from 1994 to 2009.
Subject headings:
ISM: individual(Orion-KL) — radio continuum: stars — radio lines: stars — stars: formation — stars: individual (Becklin-Neugebauer-Object)1. Introduction
The Kleinmann-Low Nebula in Orion is well-known as the nearest region of high mass star formation, 415 pc away (Menten et al., 2007; Kim et al., 2008). It contains at least 2 massive young stars. One of these, the Becklin-Neugebauer Object (BN), has been studied extensively at infrared wavelengths (Scoville et al., 1983); it is thought to be a B star. The other object, Source I (hereafter, ‘SrcI’), is so heavily obscured by foreground dust that it is not directly visible in the infrared, although light reflected by the surrounding nebulosity provides a glimpse of its spectrum (Morino et al., 1998; Testi et al., 2010). SrcI is noteworthy because it is surrounded by a cluster of SiO masers, one of the few cases in which SiO masers are associated with a young star. It also is known to drive a bipolar outflow into the surrounding molecular cloud (Plambeck et al., 2009).
Remarkably, proper motion measurements show that SrcI and BN are recoiling from one another at 35-40 km s-1 (Rodríguez et al., 2005; Gómez et al., 2008; Goddi et al., 2011). Tracing the motions backward, Goddi et al. (2011) find that 560 years ago the projected separation of these two stars in the plane of the sky was just AU. An extensive system of ‘bullets,’ bow shocks, and ‘fingers,’ visible in lines of H2, FeII, and CO (Allen & Burton, 1993; Zapata et al., 2011), also is centered on Orion-KL. Proper motion measurements suggest that the fingers were created by an explosive event 500-1000 years ago (Doi et al., 2002; Bally et al., 2011). Thus, the currently favored paradigm for Orion-KL (Gómez et al., 2008; Bally et al., 2011; Goddi et al., 2011) postulates that SrcI and BN were ejected from a multiple system approximately 500 years ago, and that the ejection of the stars unbound the surrounding gas and circumstellar disks, creating the finger system.
BN’s luminosity of L⊙ (De Buizer et al., 2012) suggests that it is a 10 to 15 M⊙ star (Schaller et al., 1992). Estimates of the mass of SrcI are conflicting. SrcI is recoiling at about half the speed of BN in the rest frame of the Orion Nebula Cluster (Goddi et al., 2011); conservation of momentum then suggests that its mass is roughly 20 M⊙. On the other hand, if the SiO masers near SrcI are in Keplerian rotation about the star, the inferred central mass is only 7 M⊙ (Matthews et al., 2010); this can be interpreted as a lower limit if the SiO-emitting gas is supported in part by radiation or magnetic pressure. SrcI could well be a compact binary with a semimajor axis of AU (Gómez et al., 2008).
At cm and mm wavelengths the continuum spectra of BN and SrcI are believed to be dominated by free-free emission from ionized circumstellar gas that is at least partially optically thick up to 100 GHz (Plambeck et al., 1995). Observations at higher frequencies, where this emission should become optically thin, can be used to estimate the Lyman continuum fluxes from the stars, better constraining their masses. Such observations must be made with subarcsecond angular resolution in order to distinguish the compact circumstellar emission from bright but extended dust and molecular line emission from the surrounding molecular cloud.
Here we describe high angular resolution 229 GHz observations of Orion-KL with the Combined Array for Research in Millimeter-Wave Astronomy (CARMA) that cleanly resolve the emission from both stars. Surprisingly, we find that the emission from SrcI is optically thick even at 229 GHz, and we fail to find the H30 recombination line in its spectrum. We argue that these results favor models in which the radio emission from SrcI originates from the H- opacity in a T K disk.
2. Observations
The spectra of SrcI and BN presented here were obtained from a single night’s observation of Orion made with the CARMA B-array on 2011 January 06. Fourteen antennas were used; projected antenna separations ranged from 50 to 700 k. The phase center was 05h35m14505, °22′3045 (J2000). The weather was excellent – the atmospheric opacity at 225 GHz was 0.10, and the rms atmospheric phase fluctuations were 65 m on a 100-m baseline. Double sideband system temperatures for the dual-polarization receivers were 100–200 K, scaled to outside the atmosphere. For each polarization the correlator was configured to observe three overlapping 500 MHz windows (covering the frequency range 225.8–227.2 GHz in the receivers’ lower sideband and 231.4–232.8 GHz in the upper sideband, with 12.5 MHz wide channels), plus a single 250 MHz window (covering 226.65–226.90 GHz in the lower sideband and 231.75–232.00 GHz in the upper sideband, with 3.125 MHz resolution). Upper and lower sideband signals are separated in the correlator by phase-switching.
The antenna gains were derived from observations of the calibrators 0423-013 (2.4 Jy) and 0607-085 (1.05 Jy) that were interleaved with the Orion scans every 10 minutes. To minimize decorrelation from atmospheric phase fluctuations, a self-calibration interval of 30 seconds was used. The calibrator flux densities were established from observations of the primary flux standard, Uranus. Because Uranus is heavily resolved on these baselines, only antenna pairs with separations k were used for flux calibration. Antenna gain solutions were applied to the Orion data after smoothing to a 10 min interval (scalar averaging the amplitude corrections). Only data with antenna separations greater than 250 k were used for the Orion maps, yielding a synthesized beam at PA .
With angular resolution, almost all spectral line emission from the Orion Hot Core and surrounding molecular cloud is resolved out. Nevertheless, to ensure that continuum flux densities were not contaminated by residual line emission or absorption, we made maps of all the spectral channels, and flagged those (28 out of 234) with anomalously high ( average) rms noise; the noisy channels coincided with strong spectral lines. We generated a primary-beam corrected continuum map from the remaining channels, using multifrequency synthesis to avoid radial smearing.
To help correct the Orion data for atmospheric decorrelation, a single phase-only self-calibration was performed on the source itself. This means that after cleaning the continuum map in the normal way, the brightest pixels in the clean component list were used as a source model to refine the antenna-based phases. A time interval of 2 minutes was used, short enough to track the most significant atmospheric phase variations, but long enough to obtain a signal to noise ratio of 1 on each of the 91 available baselines, allowing a robust least squares fit for the 13 antenna-based phases. Applying the self-calibrated phase corrections increased the source flux densities by about 50%. The measured rms noise in the final resolution map is 4 mJy beam-1.
Even higher resolution images of Orion were obtained in 2009 February using the CARMA A-array, with antenna separations of up to 1.7 km (1350 k). These observations utilized older, single-polarization receivers and a 1.5 GHz bandwidth correlator. For these data the CARMA Paired Antenna Calibration System (“C-PACS,” Pérez et al., 2010) was used as an adaptive optics scheme to correct for blurring by atmospheric phase fluctuations. C-PACS placed the 8 CARMA 3.5-meter telescopes next to a subset of the 10-m and 6-m telescopes, including those at the extremes of the array. As the 6-m and 10-m telescopes observed Orion at 229 GHz, the 3.5-m antennas observed the nearby (1.6∘ away) quasar 0541-056 at 31 GHz in order to monitor the atmospheric phase variations above each station. The atmospheric phase delay to each 3.5-m telescope was derived by self-calibration on 0541-056 every 12 sec. These antenna-based phases were scaled up by the ratio of the observing frequencies (229/31 = 7.4) and applied to the mm data. The C-PACS calibration accuracy is limited by the angular separation of the cm calibrator and the mm source, which causes the cm and mm beams to probe different paths through the atmosphere; by the signal to noise ratio on the 31 GHz calibrator; and by the airmass.
A continuum map was generated from the A-array data using only baselines longer than 250 k. The synthesized beam was at PA 14°. Applying the C-PACS corrections more than doubled the signal to noise ratio of this map. As with the B-array map, we then performed a single phase-only self-calibration, with a 2 minute interval, to help correct for residual atmospheric phase fluctuations; this doubled the flux densities of the compact sources. The measured rms noise in the final resolution map is 2.6 mJy beam-1.
The integrated flux densities measured from the and resolution maps were 240 and 255 mJy for BN, 310 and 370 mJy for SrcI. Although the discrepancy in the two SrcI flux densities could conceivably be caused by time variability of the source (cf. section 4.2.3), it is more likely attributable to differences in the sampling of visibilities by the A and B arrays, which lead to different sidelobe structure from the adjacent Orion Hot Core. We will use the A-array flux densities for the remainder of this paper because the higher resolution data should more effectively filter out emission from the Hot Core. We estimate that the absolute flux scale is accurate within %.
Finally, supplementary 3mm observations were made with the A-array in 2009 February to obtain spectra of the H41 (92.034 GHz) and H42 (85.688 GHz) recombination lines toward BN. Both of the recombination lines and the strong SiO maser at 86.243 GHz were measured simultaneously. The data were self-calibrated on the maser using a 10 sec interval. The spectra of the two recombination lines were averaged together to improve the signal to noise ratio.
3. Results
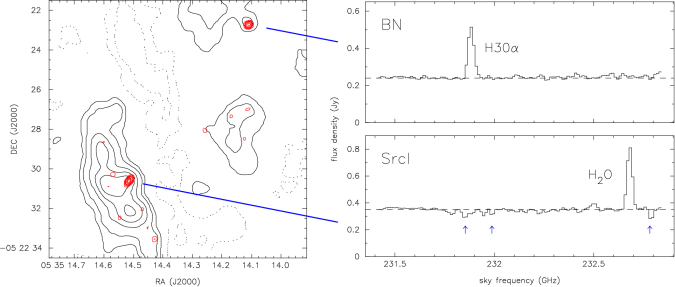
The left hand panel in Figure 1 shows the resolution continuum map from the B-array observations, overlaid on a resolution image obtained with the CARMA C-array (Eisner et al., 2008). SrcI and BN are clearly distinguishable only in the higher resolution map; extended emission from dust and molecular lines dominate the lower resolution image.
The upper sideband spectra of BN and SrcI are shown in the right hand panels of Figure 1. The H30 recombination line at 231.901 GHz is prominent in the spectrum of BN, but is not detected toward SrcI. The bright line at 232.687 GHz in SrcI’s spectrum is the =1, 5(5,0)-6(4,3) transition of H2O. Weak absorption features toward SrcI are due to transitions of ethyl cyanide, dimethyl ether, and methanol. No emission lines were detected toward either source in the lower sideband.
| source | RA | DEC | peak flux density | integrated flux density | deconvolved size |
|---|---|---|---|---|---|
| ( h m s ) | (∘ ′ ′′) | (mJy) | (mJy) | ||
| SrcI | 05 35 14.514 | -05 22 30.59 | at PA | ||
| BN | 05 35 14.109 | -05 22 22.73 | at PA |
Note. — All parameters were measured from the resolution map. Positions are for epoch 2009.1.
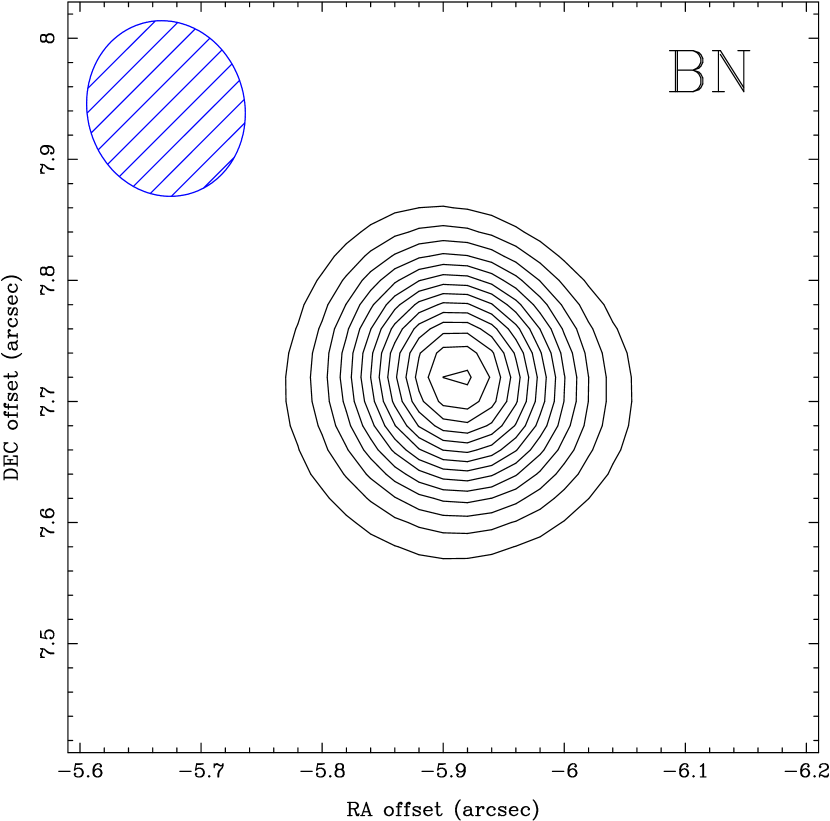
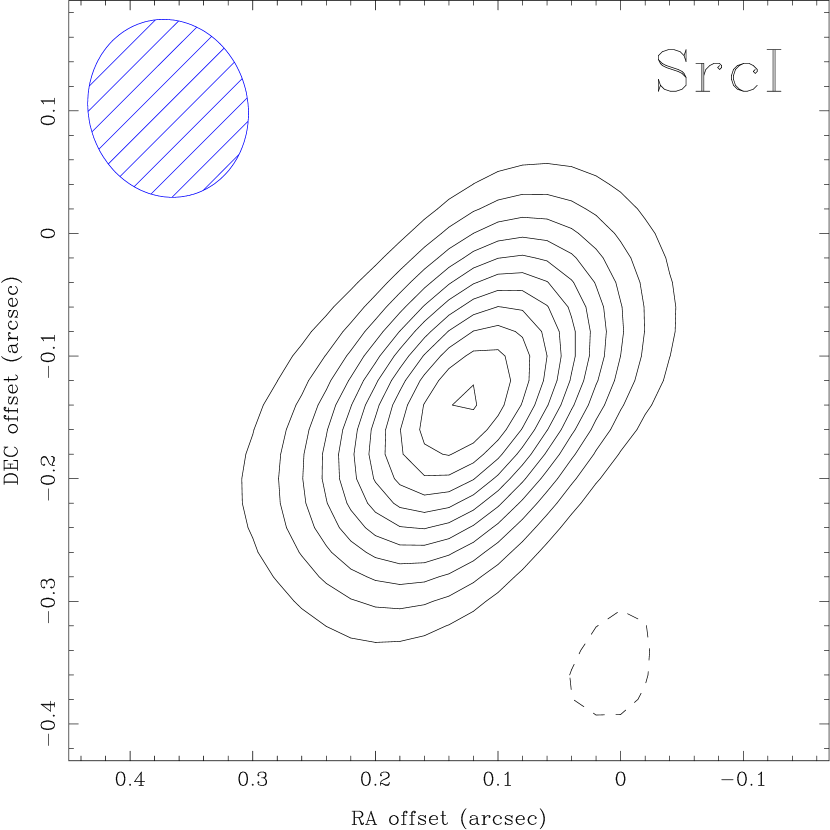
Figure 2 displays the resolution images of BN and SrcI from the A-array. BN is nearly circularly symmetric, while SrcI is elongated. Table 1 summarizes the results of Gaussian fits to the positions, flux densities, and deconvolved sizes. The 229 GHz source positions match the 43 GHz positions measured in 2009 January by Goddi et al. (2011) within . The deconvolved size of SrcI at 229 GHz, at PA 140∘, is similar to the sizes measured at 8.4 GHz ( at PA ; Gómez et al. 2008) and at 43 GHz ( at PA ; Goddi et al. 2011), although the source appears to be thinner along its minor axis at 229 GHz.
The flux density we measure for BN in the resolution map is roughly higher than the value recently reported by Galván-Madrid et al. (2012) from an analysis of ALMA Band 6 Science Verification data. These early ALMA data had a synthesized beam. We suspect that the flux density of BN is depressed in the ALMA map because of negative sidelobes from poorly sampled extended emission. The same problem affects the resolution CARMA image shown in Figure 1; the peak intensity at the position of BN in this low resolution image is mJy/beam. The higher resolution CARMA maps are free of deep negative sidelobes, allowing more reliable flux density measurements of compact sources.
4. Discussion
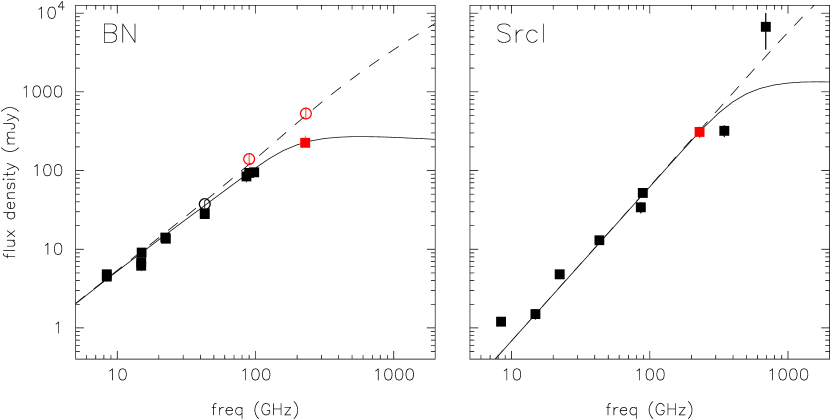
Figure 3 shows the radio continuum spectra of BN and SrcI from cm to submillimeter wavelengths. Numerical values are given in Table 4.1. For BN we also plot the peak intensities of the H30 and H41/42 recombination lines measured with CARMA, and the H53 line measured with the VLA (Rodríguez et al., 2009).
4.1. BN
The continuum spectrum of BN is typical of free-free emission from a hypercompact HII region. The flux density scales as , indicating that optically thick emission has a larger angular extent at lower frequencies, either because the ionized gas is clumpy (Ignace & Churchwell, 2004) or because the electron density declines smoothly with radius (Wright & Barlow, 1975). The spectrum begins to flatten at 229 GHz, indicating that the source is becoming optically thin at higher frequencies.
| frequency | S(SrcI) | S(BN) | epoch | References |
|---|---|---|---|---|
| (GHz) | (mJy) | (mJy) | ||
| 4.8 | 1990 | 1 | ||
| 8.4 | 1994.3 | 2 | ||
| 8.4 | 2006.4 | 3 | ||
| 15 | 1981.6 | 4 | ||
| 15 | 1983.7 | 4 | ||
| 15 | 1986.3 | 5 | ||
| 15 | 1990 | 1 | ||
| 22 | 1983.7 | 4 | ||
| 22 | 1991.5 | 6 | ||
| 43 | 1994.3 | 2 | ||
| 43 | 1994.9 | 7 | ||
| 43 | 2000.9 | 3,8 | ||
| 43 | 2007.9 | 9 | ||
| 43 | 2009.0 | 10 | ||
| 86 | 1995.0 | 11 | ||
| 89 | 2009.0 | 12 | ||
| 229 | 2009.1 | 13 | ||
| 348 | 2004.1 | 14 | ||
| 690 | 2005.1 | 15 |
References. — (1) Felli et al. 1993b; (2) Menten & Reid 1995; (3) Gómez et al. 2008; (4) Garay et al. 1987; (5) Felli et al. 1993a; (6) Forbrich et al. 2008; (7) Chandler & Wood 1997; (8) Reid et al. 2007; (9) Rodríguez et al. 2009; (10) Goddi et al. 2011; (11) Plambeck et al. 1995; (12) Friedel & Widicus Weaver 2011 (assuming 10% absolute calibration accuracy); (13) this paper; (14) Beuther et al. 2004; (15) Beuther et al. 2006
4.1.1 Model spectra
To model the spectrum, we assume that the emission region is spherically symmetric, with a uniform electron temperature and an electron density that is constant, , inside core radius , then declines as at larger radii. For each projected radius we numerically integrate along the line of sight to compute the emission measure pc cm-6. The brightness temperatures at this projected radius in the continuum and at the peak of a recombination line are then and , where the continuum and line opacities are approximated as (Rohlfs & Wilson, 2000)
| (1) | |||||
| (2) |
We integrate the brightness temperatures over circular annuli to obtain flux densities, assuming a distance to the source of 415 pc.
The model BN spectra shown by smooth curves in Figure 3 assumed K, cm-3, AU, , and recombination line velocity widths of 30 km s-1 for all transitions. The model does not take into account systematic velocity gradients or pressure broadening of the recombination lines. The model parameters were determined by trial and error, and are not a formal fit to the data. To first order, however, the turnover frequency sets , the spectral slope sets , and the absolute flux densities set .
4.1.2 Excitation parameter
The model parameters above yield an excitation parameter pc cm-2, which serves as a measure of the flux of ionizing photons from the central star. This corresponds to the excitation parameter expected for a main sequence B star with Lyman continuum flux photons s-1 and total luminosity L⊙ (Panagia, 1973). The ionizing flux is comparable to the value derived by Scoville et al. (1983) from infrared data, and the luminosity is comparable with the bolometric luminosity obtained by De Buizer et al. (2012) from 6–37 m SOFIA observations.
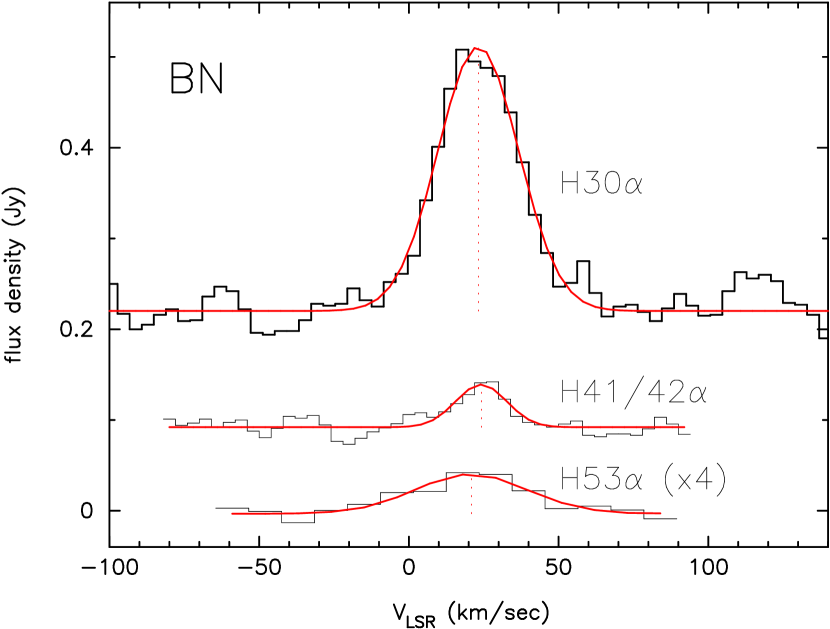
4.1.3 Recombination lines
Figure 4 displays the recombination line profiles toward BN. H30 and H41/42 (the average of the H41 and H42 lines) were observed with CARMA, H53 with the VLA (Rodríguez et al., 2009). The H30 spectrum was measured using the 250 MHz wide correlator window with 4 km s-1 channel spacing; it has been Hanning smoothed to 8 km s-1 resolution. Line parameters and uncertainties derived from Gaussian fits to the spectra are summarized in Table 3. The H53 line is at slightly lower velocity and is noticeably wider than the higher frequency lines.
For the electron densities cm-3 that we infer for BN, collisional broadening of recombination lines can be significant. Collisional broadening is most important for high- transitions because the diameter of a hydrogen atom is proportional to – an atom in the n=53 level is 0.3 m across! The collision-broadened linewidths are given by the approximate formula (Brocklehurst & Seaton, 1972)
| (3) |
For cm-3 and K, km s-1 for H53, 30 km s-1 for H41, and km s-1 for H30. These widths must be convolved with the expected km s-1 wide thermal profiles, plus any additional Doppler broadening from turbulent motions.
Since the observed width of the H53 line is much less than 200 km s-1, most of the H53 emission that is detected must originate more than AU from the star, in the lower density halo where cm-3. The line is slightly blueshifted relative to the other transitions, as expected if this gas is expanding. The H30 line is little affected by pressure broadening or by continuum opacity, so its central velocity, 23.2 km s-1, is the best indicator of the VLSR of BN. We attribute the anomalously narrow width observed for the H41/42 transition to poor signal to noise; more sensitive spectra of all these recombination lines would be useful in further constraining models of the electron density in BN.
We do not detect the 231.995 GHz helium recombination line toward BN. The absence of this line is consistent with the identification of BN as a B-star. In the 30 km s-1 resolution BN spectrum in Figure 1, the 2 upper limit on the intensity of the He30 line is mJy, while the intensity of the H30 line is 270 mJy; thus He30H30. If helium were ionized over the full volume of the HII region, the opacity ratio would be comparable to the He/H abundance ratio, . Thus we can say that the He+ zone, if it exists, fills less than half the volume of the HII region. This places an upper limit of roughly 0.05 on the ratio of helium-ionizing to hydrogen-ionizing photons from the star (Mezger et al., 1974, Fig. 2), consistent with the ratio expected for B-stars, but not for O9 or more massive stars (Mezger et al., 1974; Vacca et al., 1996).
| line | freq | SpeakaaPeak flux density of the line above the continuum level. | VLSR | FWHM | |
|---|---|---|---|---|---|
| (GHz) | (mJy) | (km s-1) | (km s-1) | ||
| H53bbRodríguez et al. 2009. | 42.952 | ||||
| H42 | 85.688 | ccfit to average of the H41 and H42 line profiles. | ccfit to average of the H41 and H42 line profiles. | ccfit to average of the H41 and H42 line profiles. | |
| H41 | 92.034 | ||||
| H30 | 231.901 |
4.2. SrcI
According to the data in Figure 3, the flux density of SrcI scales approximately as from 43 to 229 GHz, suggesting that over this frequency range the source is an optically thick black body with constant angular size. Even if the absolute calibrations are wrong, the absence of a detectable H30 line rules out the possibility that the emission is optically thin p+/e- bremsstrahlung, unless the H30 line is unexpectedly broad ( km s-1). For a linewidth of 30 km s-1, comparable to the velocity span of the SrcI SiO masers, the line to continuum opacity ratio from equations (1) and (2), and the line should easily have been detected if .
Our data cannot easily be reconciled with the 348 GHz flux density of mJy measured with the SMA (Beuther et al., 2004), which falls below plausible extrapolations from the lower frequency points. Such a low 348 GHz flux density would imply that the free-free emission from SrcI is somewhat optically thin at 229 GHz, in which case we should have detected the H30 line. Possibly the 348 GHz SrcI measurement was corrupted by negative sidelobes from the bright Hot Core clumps 1-2′′ east of SrcI, or possibly SrcI is time-variable (cf. Section 4.2.3). The 690 GHz flux density measured with the SMA, Jy (Beuther et al., 2006), lies above the extrapolation from lower frequencies, but this is easily explained if there is thermal emission from dust within the synthesized beam.
4.2.1 An optically thick hypercompact HII region?
If SrcI is a conventional hypercompact HII region, it must have an extraordinarily high emission measure, pc cm-6, in order to remain optically thick at 229 GHz. We are able reproduce the observed continuum flux densities with the simple spherically symmetric model described in section 4.1.1 if we assume that the ionized region has radius AU, electron temperature K, and uniform electron density cm-3. The resulting continuum spectrum is shown by the solid curve in Figure 3; the dashed curve shows the recombination line intensities predicted by the model. The HII region is constrained to have a sharp outer edge – any halo of lower density plasma would lead to excess emission at cm wavelengths. Collisional broadening of the H30 line is predicted to be of order 10 km s-1, not enough to smear out the line. The excitation parameter pc cm-2 computed from the radius and electron density corresponds to an ionizing flux of photons s-1, consistent with a B0 to B1 main sequence star with luminosity L⊙ (Panagia, 1973; Smith et al., 2002). Since the continuum emission is optically thick, this should be interpreted as a lower limit to the ionizing flux.
The source diameter of 15 AU used in the model is dictated by the assumed electron temperature of 8000 K, the measured flux densities, and the distance to Orion. A diameter of 15 AU is, however, inconsistent with the observed size of SrcI, which is roughly , or 80 AU, along its major axis. This suggests that the emission region is clumpy or filamentary so that it does not fill the synthesized beam. But it is implausible that all these clumps or filaments are perfectly sharp-edged, such that every one of them is optically thick even at 229 GHz. Generally, one expects a distribution of clumps to produce emission with a shallower spectral slope (Ignace & Churchwell, 2004).
One alternative is that the electron temperature is less than 8000 K. The highest resolution measurements of SrcI that are available, 43 GHz VLA observations with a 34 mas synthesized beam, imply that the source has a brightness temperature of only 1500 K (Reid et al., 2007). This is much cooler than is possible in an HII region, however; hydrogen is almost entirely neutral in dense gas at T K (Reid & Menten, 1997).
4.2.2 H- free-free emission from a massive disk?
The absence of hydrogen recombination lines, 1500 K apparent brightness temperature, and spectral index of 2 all are difficult to explain if SrcI is a hypercompact HII region. The data more naturally fit an alternative hypothesis, first considered by Reid et al. (2007), that the emission from SrcI originates in a T K disk, similar to the radio photospheres of Mira variables (Reid & Menten, 1997). The infrared spectrum of SrcI, seen via light reflected off the neighboring nebulosity, suggests such an interpretation as well – Testi et al. (2010) find that the spectrum is characteristic of a low-gravity photosphere with effective temperature 3500–4500 K. The close association of SrcI with SiO masers, also characteristic of Mira variables, further strengthens the case for this hypothesis.
As discussed by Reid & Menten (1997), free-free emission at temperatures of about 1500 K in such a photosphere arises via the H- opacity, the scattering of electrons by neutral hydrogen atoms or molecules. The electrons are produced by collisional ionization of Na, K, and other metals. The H- opacity is roughly times smaller than the p+/e- opacity, so high densities ( cm-3) typically are required to obtain optically thick emission.
Reid et al. (2007) were able to fit the 43 GHz VLA observations of SrcI with models of H- emission from an 80 AU diameter, 3 M⊙ disk. However, they found that such a large disk cannot be maintained at T K if it is heated solely by a central star – a stellar luminosity L⊙, greater than the luminosity of the entire Orion-KL region, would be required. They proposed that accretion processes might heat the disk locally. Testi et al. (2010) also find that the infrared spectrum of SrcI can be explained by emission from a disk around a M⊙ protostar that is accreting at a few M⊙ yr-1. However, their models show that the disk temperature falls below 1500 K for r AU, so cannot easily explain the H- free-free emission at larger radii.
In summary, the H- hypothesis explains the observational results in a natural way. The principal barrier to its acceptance is uncertainty over the mechanism by which such a large disk can be maintained at sufficiently high temperature. Whether the disk could be heated by an anomalously high accretion rate, a merging binary, magnetic effects, or some other mechanism remains a key question.

4.2.3 Is SrcI brightening?
If accretion is responsible for much of SrcI’s luminosity, then one might expect to see changes in its flux density on timescales of years. Although Goddi et al. (2011) found no evidence of flux variations at 43 GHz over 4 epochs from 2000 to 2009, we are struck by the discrepancy in the 86 GHz fluxes measured at BIMA in 1995 ( mJy, Plambeck et al., 1995) and at CARMA in 2009 ( mJy, Friedel & Widicus Weaver, 2011).
Generally, uncertainties in absolute flux densities are dominated by systematic effects – e.g., variations in telescope gains as a function of elevation, or uncertainties in the brightness temperature models of planets used as primary flux standards. The ratio of the flux densities of SrcI and BN should be immune to such effects because the two sources are just apart and can be observed simultaneously. In Figure 5 we plot this ratio as a function of time for the 43 and 86 GHz data in Table 4.1. Note that the error bars in this figure were calculated from the thermal noise in the original maps, not from the absolute flux uncertainties listed in Table 4.1. From these 7 independent datasets it appears that the ratio increased from about 0.4 in 1995 to 0.5 in 2009.
This result should be interpreted cautiously. Although the flux density ratio is unaffected by the absolute calibration scale, it is sensitive to the sampling of visibility data in the plane. It is also unclear whether SrcI or BN, or both, are varying; periodic variations in the infrared luminosity of BN were reported by Hillenbrand et al. (2001). Future careful monitoring of the flux densities of both SrcI and BN with the VLA and ALMA will be required to find conclusive evidence for source brightness variations.
4.2.4 Vibrationally excited H2O
The bright emission line in the spectrum of SrcI in Figure 1 is the H2O =1, 5(5,0)-6(4,3) transition of H2O at 232.687 GHz, 3450 K above the ground state. This line also was recognized by Hirota et al. (2012) in the Orion Band 6 ALMA Science Verification data. With 0.6 km s-1 velocity resolution, the ALMA data show that the H2O line is double-peaked, like the 22 GHz H2O masers or the 43 and 86 GHz SiO masers toward SrcI.
In the resolution ALMA maps the H2O line is blended with a HCOOCH3 transition at 232.684 GHz, whereas in the resolution CARMA map the HCOOCH3 emission is resolved out. The H2O emission is unresolved by the CARMA beam, so it is clear that the line originates from the compact SiO maser zone close to SrcI, rather than the extended strip where 22 GHz H2O masers are found (Gaume et al., 1998). The SiO v=2 masers also originate in energy levels 3500 K above the ground state; Goddi et al. (2009) find that these masers can be excited in gas with kinetic temperature K.
The same transition of vibrationally excited H2O was detected toward the evolved stars VY CMa and W Hya by Menten & Melnick (1989). Like SrcI, both of these stars have SiO and 22 GHz H2O masers.
5. Summary
CARMA 229 GHz maps of Orion-KL with up to angular resolution clearly distinguish the ionized envelopes of SrcI and BN from the surrounding molecular cloud. The principal results are as follows:
-
1.
The integrated flux densities of SrcI and BN at 229 GHz are 310 and 240 mJy respectively, with a probable uncertainty of 15%. The BN flux density we measure with resolution is a factor of two greater than that derived by Galván-Madrid et al. (2012) from ALMA Science Verification data with a synthesized beam. We suspect that the flux density of BN is depressed in the ALMA map because of negative sidelobes from poorly sampled extended emission. These large scale structures are filtered out more effectively in the higher resolution CARMA data.
-
2.
SrcI’s flux density is proportional to from 43 to 229 GHz – it appears to be an optically thick black body. By comparison, BN’s flux density scales as up to about 100 GHz, then flattens; its free-free continuum is becoming optically thin at 229 GHz.
-
3.
SrcI is elongated at PA 140 degrees in the CARMA images. Its deconvolved size is similar at 229 and 43 GHz – further evidence that it is optically thick.
-
4.
The H30 recombination line is not detected toward SrcI, though it is bright toward BN. The absence of this recombination line is a third piece of evidence that SrcI is optically thick, or that it is not an HII region at all.
-
5.
The =1, 5(5,0)-6(4,3) transition of H2O at 232.687 GHz, 3450 K above the ground state, is prominent toward SrcI. The line emission originates close to the central star, not in the larger zone where 22 GHz H2O masers are found.
-
6.
While our observational results do not rule out the possibility that SrcI is an exceptionally dense hypercompact HII region, they are more easily explained by models of free-free emission via the H- opacity in a T K disk, as modeled by Reid et al. (2007).
-
7.
A model of a spherically symmetric hypercompact HII region with a diameter of about 15 AU and electron density cm-3 matches both the continuum and the recombination line intensities toward BN.
-
8.
The excitation parameter pc cm-2 derived for BN implies that its Lyman continuum flux is photons s-1, consistent with that expected from a zero age main sequence B star with a total luminosity of L⊙.
-
9.
The H53 recombination line in BN is predicted to have a collisionally broadened linewidth of 200 km s-1. Presumably the H53 emission observed by Rodríguez et al. (2009), with a linewidth of about 40 km s-1, originates primarily from lower density ionized gas farther from the central star.
-
10.
The VLSR of BN is km s-1, based on the central velocity of the 231.9 GHz H30 line, which is little affected by pressure broadening or continuum opacity.
-
11.
Published flux densities at both 43 and 86 GHz provide tentative evidence that SrcI brightened with respect to BN between 1994 and 2009.
Future ALMA observations of Orion-KL at submillimeter wavelengths will provide a definitive test of the emission mechanism in SrcI. If SrcI is an HII region, it must become optically thin at sufficiently high frequencies. If the source were still optically thick at 650 GHz, for example, an O-star with a Lyman continuum flux photons s-1 would be required to maintain its ionization, but the luminosity of such a star, L⊙ (Panagia, 1973), would exceed the measured luminosity of the entire Orion-KL nebula. Then, at frequencies where the continuum is optically thin, hydrogen recombination lines must be detectable if hydrogen is ionized. If these recombination lines are detected, the free-free hypothesis is confirmed. If not, or if the continuum flux density continues to increase following a law, the emission must be attributable to the H- mechanism.
Submillimeter observations of BN, as well as more sensitive observations of its cm and mm wavelength recombination lines, will be useful in constraining models of the hypercompact HII region around this star, and in tracking small changes in the SrcI/BN flux density ratio that could be an indication of time variable accretion onto these objects.
References
- Allen & Burton (1993) Allen, D. A., & Burton, M. G. 1993, Nature, 363, 54
- Bally et al. (2011) Bally, J., Cunningham, N. J., Moeckel, N., Burton, M. G., Smith, N., Frank, A., & Nordlund, A. 2011, ApJ, 727, 113
- Beuther et al. (2004) Beuther, H., et al. 2004, ApJ, 616, L31
- Beuther et al. (2006) —. 2006, ApJ, 636, 323
- Brocklehurst & Seaton (1972) Brocklehurst, M., & Seaton, M. J. 1972, MNRAS, 157, 179
- Chandler & Wood (1997) Chandler, C. J., & Wood, D. O. S. 1997, MNRAS, 287, 445
- De Buizer et al. (2012) De Buizer, J. M., Morris, M. R., Becklin, E. E., Zinnecker, H., Herter, T. L., Adams, J. D., Shuping, R. Y., & Vacca, W. D. 2012, ApJ, 749, L23
- Doi et al. (2002) Doi, T., O’Dell, C. R., & Hartigan, P. 2002, AJ, 124, 445
- Eisner et al. (2008) Eisner, J. A., Plambeck, R. L., Carpenter, J. M., Corder, S. A., Qi, C., & Wilner, D. 2008, ApJ, 683, 304
- Felli et al. (1993a) Felli, M., Churchwell, E., Wilson, T. L., & Taylor, G. B. 1993a, A&AS, 98, 137
- Felli et al. (1993b) Felli, M., Taylor, G. B., Catarzi, M., Churchwell, E., & Kurtz, S. 1993b, A&AS, 101, 127
- Forbrich et al. (2008) Forbrich, J., Menten, K. M., & Reid, M. J. 2008, A&A, 477, 267
- Friedel & Widicus Weaver (2011) Friedel, D. N., & Widicus Weaver, S. L. 2011, ApJ, 742, 64
- Galván-Madrid et al. (2012) Galván-Madrid, R., Goddi, C., & Rodríguez, L. F. 2012, A&A, 547, L3
- Garay et al. (1987) Garay, G., Moran, J. M., & Reid, M. J. 1987, ApJ, 314, 535
- Gaume et al. (1998) Gaume, R. A., Wilson, T. L., Vrba, F. J., Johnston, K. J., & Schmid-Burgk, J. 1998, ApJ, 493, 940
- Goddi et al. (2009) Goddi, C., Greenhill, L. J., Chandler, C. J., Humphreys, E. M. L., Matthews, L. D., & Gray, M. D. 2009, ApJ, 698, 1165
- Goddi et al. (2011) Goddi, C., Humphreys, E. M. L., Greenhill, L. J., Chandler, C. J., & Matthews, L. D. 2011, ApJ, 728, 15
- Gómez et al. (2008) Gómez, L., Rodríguez, L. F., Loinard, L., Lizano, S., Allen, C., Poveda, A., & Menten, K. M. 2008, ApJ, 685, 333
- Hillenbrand et al. (2001) Hillenbrand, L. A., Carpenter, J. M., & Skrutskie, M. F. 2001, ApJ, 547, L53
- Hirota et al. (2012) Hirota, T., Kim, M. K., & Honma, M. 2012, ApJ, 757, L1
- Ignace & Churchwell (2004) Ignace, R., & Churchwell, E. 2004, ApJ, 610, 351
- Kim et al. (2008) Kim, M. K., et al. 2008, PASJ, 60, 991
- Matthews et al. (2010) Matthews, L. D., Greenhill, L. J., Goddi, C., Chandler, C. J., Humphreys, E. M. L., & Kunz, M. W. 2010, ApJ, 708, 80
- Menten & Melnick (1989) Menten, K. M., & Melnick, G. J. 1989, ApJ, 341, L91
- Menten & Reid (1995) Menten, K. M., & Reid, M. J. 1995, ApJ, 445, L157
- Menten et al. (2007) Menten, K. M., Reid, M. J., Forbrich, J., & Brunthaler, A. 2007, A&A, 474, 515
- Mezger et al. (1974) Mezger, P. G., Smith, L. F., & Churchwell, E. 1974, A&A, 32, 269
- Morino et al. (1998) Morino, J.-I., Yamashita, T., Hasegawa, T., & Nakano, T. 1998, Nature, 393, 340
- Panagia (1973) Panagia, N. 1973, AJ, 78, 929
- Pérez et al. (2010) Pérez, L. M., et al. 2010, ApJ, 724, 493
- Plambeck et al. (2009) Plambeck, R. L., et al. 2009, ApJ, 704, L25
- Plambeck et al. (1995) Plambeck, R. L., Wright, M. C. H., Mundy, L. G., & Looney, L. W. 1995, ApJ, 455, L189+
- Reid & Menten (1997) Reid, M. J., & Menten, K. M. 1997, ApJ, 476, 327
- Reid et al. (2007) Reid, M. J., Menten, K. M., Greenhill, L. J., & Chandler, C. J. 2007, ApJ, 664, 950
- Rodríguez et al. (2005) Rodríguez, L. F., Poveda, A., Lizano, S., & Allen, C. 2005, ApJ, 627, L65
- Rodríguez et al. (2009) Rodríguez, L. F., Zapata, L. A., & Ho, P. T. P. 2009, ApJ, 692, 162
- Rohlfs & Wilson (2000) Rohlfs, K., & Wilson, T. L. 2000, Tools of Radio Astronomy (3rd edition; New York: Springer)
- Schaller et al. (1992) Schaller, G., Schaerer, D., Meynet, G., & Maeder, A. 1992, A&AS, 96, 269
- Scoville et al. (1983) Scoville, N., Kleinmann, S. G., Hall, D. N. B., & Ridgway, S. T. 1983, ApJ, 275, 201
- Smith et al. (2002) Smith, L. J., Norris, R. P. F., & Crowther, P. A. 2002, MNRAS, 337, 1309
- Testi et al. (2010) Testi, L., Tan, J. C., & Palla, F. 2010, A&A, 522, A44
- Vacca et al. (1996) Vacca, W. D., Garmany, C. D., & Shull, J. M. 1996, ApJ, 460, 914
- Wright & Barlow (1975) Wright, A. E., & Barlow, M. J. 1975, MNRAS, 170, 41
- Zapata et al. (2011) Zapata, L. A., Loinard, L., Schmid-Burgk, J., Rodríguez, L. F., Ho, P. T. P., & Patel, N. A. 2011, ApJ, 726, L12