The HI environment of the M101 group
Abstract
We present a wide (8.5∘ 6.7∘, 1050 825 kpc), deep (= 1016.8-17.5 cm-2) neutral hydrogen (HI) map of the M101 galaxy group. We identify two new HI sources in the group environment, one an extremely low surface brightness (and hitherto unknown) dwarf galaxy, and the other a starless HI cloud, possibly primordial in origin. Our data show that M101’s extended HI envelope takes the form of a 100 kpc long tidal loop or plume of HI extending to the southwest of the galaxy. The plume has an HI mass 108 M☉ and a peak column density of NHI= 5 1017 cm-2, and while it rotates with the main body of M101, it shows kinematic peculiarities suggestive of a warp or flaring out of the rotation plane of the galaxy. We also find two new HI clouds near the plume with masses 107 M☉, similar to HI clouds seen in the M81/M82 group, and likely also tidal in nature. Comparing to deep optical imaging of the M101 group, neither the plume nor the clouds have any extended optical counterparts down to a limiting surface brightness of = 29.5. We also trace HI at intermediate velocities between M101 and NGC 5474, strengthening the case for a recent interaction between the two galaxies. The kinematically complex HI structure in the M101 group, coupled with the optical morphology of M101 and its companions, suggests that the group is in a dynamically active state that is likely common for galaxies in group environments.
Subject headings:
galaxies:dwarf – galaxies:evolution – galaxies:groups – galaxies:individual:M101 – galaxies:interactions – galaxies:ISM1. Introduction
The gaseous ecosystems around nearby galaxies are thought to be rich and dynamic, reflecting a wide variety of processes associated with galaxy formation and evolution. Theoretical arguments predict that galaxies can continually accrete gas from their surroundings, as material falls in from the more diffuse intragroup medium (e.g., Larson 1972; Maller & Bullock 2004; Kereš et al. 2005; Sommer-Larsen 2006). Massive galaxies can host a significant population of gas-rich dwarf companions, and interactions with these companions and with larger nearby galaxies can imprint kinematic and morphological signatures in the extended HI disks, such as disk warps, HI plumes and tidal tails, and high velocity cloud complexes (see compilations in Hibbard et al. 2001; Sancisi et al. 2008). Radially extended gas is responsive to even low-level perturbations, and this makes deep HI imaging an excellent tool to pinpoint subtle dynamical effects that are missed in the optical, and that help drive galaxy evolution.
Galaxies are believed to be embedded in a gaseous network which can feed galaxies through accretion. At high redshift, this accretion is thought to be rapid, perhaps in a “cold” accretion mode where gas flows smoothly onto galaxies along dense dark matter filaments, never shock heating to the virial temperature of the host dark matter halo (e.g., Kereš et al. 2005, 2009, Dekel & Birnboim 2006, Stewart et al. 2011). However, under these models, the fraction of cold gas accretion plummets once the dark matter halo reaches a critical mass M☉(Dekel & Birnboim 2006). At the present epoch, therefore, the accretion of gas onto massive galaxies may happen either via “hot mode” accretion, where gas cools from a surrounding hot halo, or by the accretion of smaller gas-rich companion galaxies. Of course, these scenarios are not mutually exclusive, as several accretion processes may be operating simultaneously. The exact mechanism driving gas accretion onto galaxies at low redshift — whether it be hot mode, vestigial cold mode, or satellite accretion — remains unclear.
Searches for signatures of gas accretion have shown a very complex HI environment around nearby galaxies. On large scales, HI tails, plumes, warps, and lopsidedness certainly argue that ongoing accretion is triggered by interactions and mergers (see Sancisi et al. 2008 for a review). In many cases, the clear culprit is a companion galaxy tidally stripping and/or being stripped the host galaxy. In contrast, searches for pure “starless” HI clouds in the intragroup medium that might drive gaseous accretion have yielded few detections (e.g., de Blok et al. 2002; Kovač et al. 2009; Chynoweth et al. 2009; Pisano et al. 2007, 2011). While strongly interacting groups can host a population of massive free-floating HI clouds (such as those found in the M81/M82 group; Chynoweth et al. 2008), the clouds are typically linked to the more diffuse tidal debris and have a phase space structure consistent with a tidal formation scenario, rather than being fresh material accreting from the intragroup medium or being “dark galaxies” hosted by their own dark matter halo (Chynoweth et al. 2011a). In short, despite solid theoretical evidence that galaxies should accrete gas from the intergalactic medium, or draw from the warm gas reservoir in the halo, most of the observed HI structures are consistent with interaction with or accretion from another gas-rich galaxy.
The ubiquity of tidal interaction signatures in the HI distribution around nearby galaxies is easily understood by the radially extended nature of the neutral interstellar medium in galaxies. Because gas at large radius is less tightly bound to its host galaxy than is the more concentrated stellar component, it is more responsive to tidal perturbations, and can reveal interaction signatures even in systems which show little or no direct evidence of tidal debris in the optical, such as the Leo Ring around the M96 group (Schneider 1985; Michel-Dansac et al. 2010), the tidal features connecting galaxies in the M81/M82 system (Yun et al. 1994), or the tidal tail in the Leo Triplet, first detected in HI (Haynes et al. 1979). Beyond simply identifying interacting systems, the morphology and kinematics of the HI tidal debris can be used to develop detailed dynamical models of the interaction (e.g., Hibbard & Mihos 1995; Yun 1999; Michel-Dansac et al. 2010; Barnes 2011)
The nearby111In this paper, we adopt a physical distance to M101 of 6.9 Mpc, but note that the exact distance to M101 remains uncertain, with recent estimates ranging from 6.1 to 7.6 Mpc (see, e.g., the recent compilation by Matheson et al. 2012). M101 galaxy group (Tully 1988) provides an opportunity to study the connection between the group HI environment and the properties of the individual galaxies. M101 itself is a well-studied, massive Sc galaxy, and its highly asymmetric disk suggests ongoing interactions with other galaxies within the group (Beale & Davies 1969; Waller et al. 1997). Previous 21-cm neutral atomic hydrogen (HI) imaging of M101, both single dish and synthesis mapping, has shown a complex HI environment: a distorted HI disk with several high velocity cloud complexes (van der Hulst & Sancisi 1988, hereafter vdHS88; Walter et al. 2008), and an extended, asymmetric outer HI plume at lower column density (Huchtmeier & Witzel 1979, hereafter HW79]). The outer disk shows blue optical colors (Mihos et al. 2012) and extended UV emission (Thilker et al. 2007), consistent with extended star formation, perhaps triggered by a recent accretion or interaction event.
In this paper we survey the neutral hydrogen content of the M101 group using the 100m Robert C. Byrd Green Bank Telescope (GBT) at the NRAO222The National Radio Astronomy Observatory (NRAO) is a facility of the National Science Foundation operated under cooperative agreement by Associated Universities, Inc. in Green Bank, West Virginia. Compared with previous single-dish 21-cm studies of M101 (HW77), our survey is wider in area, more sensitive, and covers a wider velocity range. Our data is complementary to HI synthesis maps of galaxies in the M101 group by probing the more extended, low column density HI surrounding the galaxies. We use the data to search for isolated HI clouds in the M101 group, to identify any signatures of HI accretion onto M101, to probe the kinematics of the diffuse HI around M101, and to search for any extended HI that might trace a past interaction between M101 and any of its companions.
2. Observations
We observed the M101 galaxy group using the GBT auto-correlation spectrometer using 9-bit sampling. The observations were carried out in 20 sessions between 2011 January and April. We observed the inner 2∘ 1.5∘ region surrounding M101 more sensitively than the outer regions of the galaxy group, in order to search more deeply for HI features. To survey the entire M101 group, we moved the telescope in a “basket-weave” pattern with 3 offsets between each scan and sampled every 3 at an integration time of 2 s per sample. This sampling interval corresponds to a slightly better-than-Nyquist rate at approximately 3 pixels per beam. Total integration time was approximately 86 hr. Table 1 gives a summary of the observations, including the rms noise figures.
We calibrated the GBT data in the standard manner using the GBTIDL and AIPS333Developed by the National Radio Astronomy Observatory; documentation at http://gbtidl.sourceforge.net, http://www.aoc.nrao.edu/aips data reduction packages. A short observation of a discrete reference position outside the map of the galaxy group bracketed 1–4 hr sections of integration time. We averaged the reference position observations bracketing each section of data to construct an average reference spectrum for that section, and used the reference spectrum to perform a standard (signal-reference)/reference calibration of each pixel. Spectra were then smoothed from their native resolution of 3.1 kHz to a channel spacing of 24.4 kHz, corresponding to a velocity resolution of 5.2 km s-1 across the 12.5 MHz bandwidth. This spectral smoothing balances the need for sensitivity, which is increased with more spectral smoothing, with the need to resolve possible narrow line-width HI features. The calibrated spectra were scaled by the system temperature (typically about 20 K for these observations), corrected for atmospheric opacity and GBT efficiency. We adopted the GBT efficiency Equation (1) from Langston & Turner (2007) with a zenith atmospheric opacity of = 0.009 and a zenith efficiency of = 0.71.
The frequency range observed was relatively free of radio-frequency interference (RFI), with less than 0.5% of all spectra adversely affected. The spectra exhibiting RFI were identified by tabulating the rms noise level in channels free of neutral hydrogen emission. Spectra that showed high rms noise across many channels were flagged and removed. Narrow-band RFI also adversely affected a small number of channels, which were blanked from the datacube. The data were then gridded using the AIPS task SDIMG, which also averages polarizations. We used a Gaussian-tapered Bessel convolving function for gridding as described in Mangum et al. (2007), with parameters found empirically to maximize the map sensitivity without degrading resolution (F. J. Lockman, private communication). After amplitude calibration and gridding, continuum sources were subtracted by fitting and subtracting a first-order polynomial to line-free regions of the spectra. Only channels in high negative velocity ranges, where few or no sources are expected, were used for the fit. This simple baseline fit was extrapolated to the positive velocity range, where galaxies and unknown HI features make a baseline fit unreliable.
The effective angular resolution, determined from maps of 3C286, is 9.15′ 0.05′– corresponding to a physical resolution of 18.7 kpc. To convert to units of flux density, we observed the calibration source 3C286, whose flux density is 14.57 0.94 Jy at 1.418 GHz (Ott et al. 1994). The calibration from K to Jy was derived by mapping 3C286 in the same way as the HI maps were produced. After all corrections for the GBT efficiency and the mapping process, the scale factor from K beam-1 to Jy beam-1 images is 0.49.
The rms uncertainty varies across the field due to differing integration times; in the inner region around M101 itself, the rms noise is 3 mJy beam-1, while in the outer region the noise is a factor of five larger, 15 mJy beam-1. These noise levels correspond to a limiting column density for the dataset of = 16.8 and 17.5 in the inner and outer regions, respectively. To calculate a characteristic HI mass sensitivity, we assume that low mass clouds will be unresolved in our beam, and use the relation
| (1) |
where is the distance to M101 in Mpc, is the rms noise in one channel, and is the channel width. For our adopted distance of Mpc, we obtain a sensitivity per 5.2 km s-1 channel of M☉ in the inner region of our map and M☉ in the outer region. However, in searching for discrete HI emission, we used more conservative detection limits (described below) to ensure valid detections.
To systematically survey the M101 group for HI emission, we extract a spectrum for each spatial pixel, masking out velocity channels in the range VLSR km s-1, which are dominated by diffuse Galactic emission, and channels in the range VLSR km s-1, which were contaminated by narrowband RFI. In each spectrum, we then search for emission that is above the noise level in three adjacent velocity channels, with at least one channel having peak emission of . Objects detected this way are thus detected at a level integrated over three channels. To determine the limiting detectable cloud mass, we insert artificial point source clouds of varying HI mass and gaussian velocity widths into the datacube and see how effectively our search algorithm recovers these clouds. At =30 km s-1, our 90(50)% recovery limit is 2(1.6) M☉ in the inner region and 10(7.5) M☉ in the outer region. Larger velocity widths spread the emission out over more channels and raises our mass detection threshold; at =60 km s-1, the 90(50)% limits rise to 3.5(2.5) M☉ in the inner region and 16(12) M☉ in the outer region.
| Area: | |
|---|---|
| range (J2000): | 13:26:39.1 – 14:30:27.7 |
| range (J2000): | 50:46:13 – 57:50:27 |
| Observations: | |
| Center frequency (MHz): | 1418 |
| Bandwidth (MHz): | 12.5 |
| Velocity range (heliocentric, km s-1): | –787 – +1855 |
| Channel width (kHz): | 24.4 |
| Velocity resolution (km s-1) | 5.2 |
| Integration time (hours): | 86 |
| Sensitivity, inner region: | |
| rms noise (mJy beam-1) | 3.0 |
| NHI (cm-2) | 1016.8 |
| Sensitivity, outer region: | |
| rms noise (mJy beam-1) | 15.0 |
| NHI (cm-2) | 1017.5 |
| Beam size: | |
| Angular (): | 9.1 |
| Physical (kpc): | 18.2 |
3. Results
3.1. The HI Environment of the M101 Group
We start our analysis with a survey of the HI environment on large scales around M101; a detailed discussion of the HI distribution and kinematics of M101 itself follows in Section 3.2.
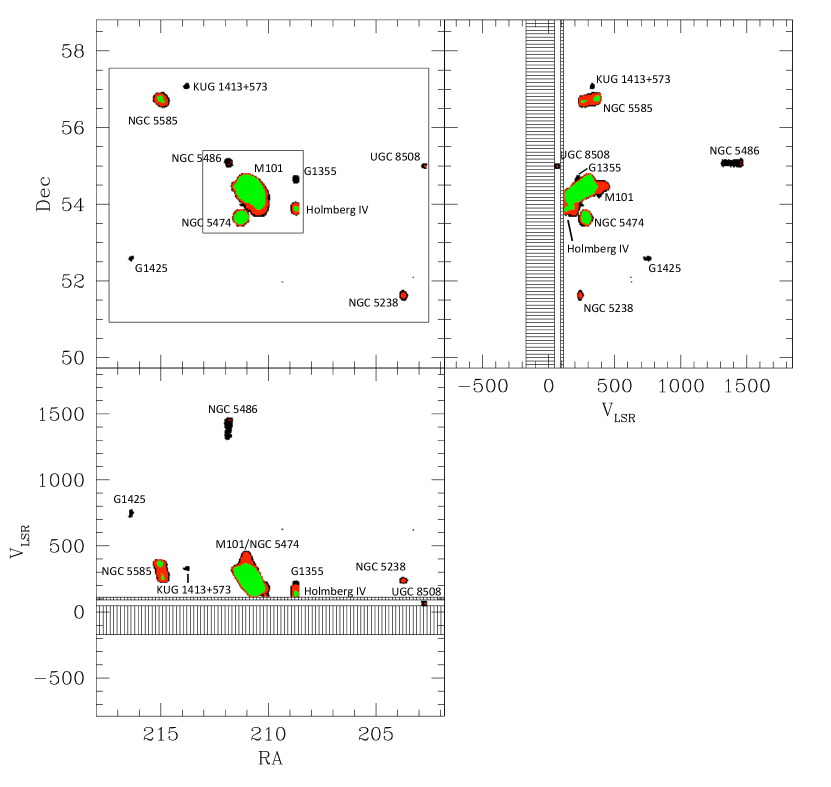
The distribution of detected HI emission is shown in Figure 1. We detect all known galaxies in the survey field with velocities in our detection range, along with two new sources, dubbed GBT 1425+5235 (hereafter G1425) and GBT 1355+5439 (hereafter G1355).444While we use IAU-recommended nomenclature for the source names in this paper, the authors prefer the names “Skipper” (G1425) and “Gilligan” (G1355) for these objects, adopted in honor of Sherwood Schwartz, who passed away during the writing of this paper. To verify these sources, we conducted short, follow-up position-switched observations of each source using the GBT spectrometer in 2012 September. In 30 minute integrations, we achieved an rms sensitivity of 3 mJy beam-1 and easily recovered both objects. Our HI spectra of these sources from the follow-up observations are shown in Figure 2, and their integrated properties are given in Table 2. Both of these sources are unresolved in our data due to the large 9.1′ (18 kpc) beam of the GBT.
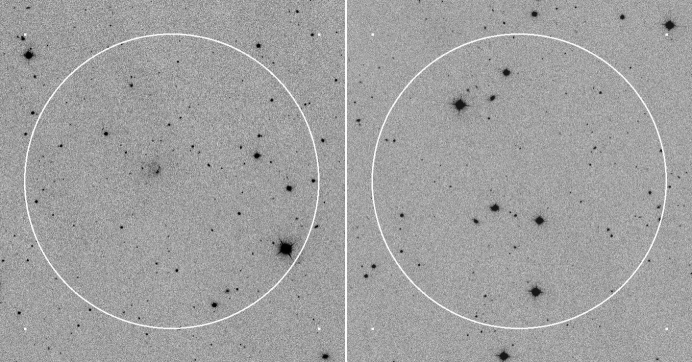
G1425 has a cataloged optical counterpart WHI J1425+52, identified by Whiting et al. (2007) as Galactic nebulosity based on relatively shallow R-band imaging with a limiting surface brightness of 25.5. However, with a significant HI detection, a velocity of VLSR=736 km s-1, and a line width of =77 km s-1, G1425 is unlikely to be Galactic in origin. To examine G1425’s optical properties in more detail, we used deeper () Sloan Digital Sky Survey Data Release 7 (SDSS DR7) imaging (Abazajian et al. 2009) of the field, shown in Figure 3, to characterize the morphology and colors of the optical counterpart. The system consists of a few high surface brightness knots asymmetrically embedded in a diffuse, low surface brightness () structure approximately 0.65′ in diameter. Within this aperture, the object has a total magnitude of ; if at the adopted distance of M101, it would have an absolute magnitude of M and a diameter of 1.3 kpc. Its very blue colors (see Table 2) and knotty appearance are characteristic of a star forming dwarf irregular galaxies (e.g., van Zee 2001). The closest Local Group analogue to G1425 might be the Pegasus dwarf irregular galaxy (Gallagher et al. 1998; Kniazev et al. 2009), although Pegasus is more symmetric, higher in central surface brightness, and redder than G1425. In these properties, G1425 is similar to the extreme low surface brightness dwarf galaxies (Bothun et al. 1998; van Zee 2001).
In contrast to G1425, around G1355 we find no plausible optical counterpart down to the limiting surface brightness of the SDSS imaging (shown in Figure 3). There are no extended sources present in the field, and the two small galaxies within the 9.1′ GBT beam are background galaxies (SDSS J135459.84+543736.8 at and SDSS J135456.31+544122.6 at ). The source also lies precisely on the edge of the field in our deep imaging of M101 (Mihos et al. 2012), which has an even deeper limiting surface brightness of , but again there is no detection.
The lack of any optical detection around G1355 makes classifying this source difficult. One possibility is that G1355 is a high velocity cloud (HVC) in the Galactic halo. The M101 field lies near (but not within) the Galactic HVC complex C (Wakker & van Woerden 1991), but this complex has velocities in the range of VLSR= –235 to –50 km s-1, very dissimilar to G1355’s velocity of VLSR=+210 km s-1. Also, in our data G1355 is also not part of any larger HI structure identifiable with Galactic emission — it is unresolved in the GBT beam with no surrounding diffuse emission, and the nearest velocity channel with any diffuse emission comes in at VLSR=+45 km s-1. Furthermore, no HVCs have been identified in this part of the sky with velocities greater than +50 km s-1(Wakker & van Woerden 1991).
If instead of being a Galactic HVC, G1355 is at the M101 distance, it would have a mass of M☉, and with a velocity width of =41 km s-1 it would be similar to the HI clouds found around the interacting galaxies M81/M82/NGC3077 (Chynoweth et al. 2008). However, those clouds are found embedded in the extensive HI tidal debris surrounding the galaxies (Yun et al. 1994) and have likely formed from HI stripped out of the galaxies due to the group interaction. Although G1355 could also have formed through an interaction between M101 and one of its companion galaxies, perhaps Holmberg IV, we see no diffuse HI structures connecting G1355 to either M101 (projected 80 kpc to the SSE) or Holmberg IV (50 kpc to the south).
Aside from G1425 and G1355, we find no other isolated HI sources aside from the well-known galaxies in the field. As both G1425 and G1355 have masses 5-10x higher than our 90% detection threshold in the outer field, other clouds of similar mass should have been easily detected as well. Other than G1355, we find no evidence for any robust population of massive HI clouds in the M101 group, similar to the findings of other searches for starless HI clouds in the group environment (de Blok et al. 2002; Pisano et al. 2007, 2011; Kovač et al. 2009; Chynoweth et al. 2009). Any undetected population of discrete HI clouds in the M101 group must have masses less than our detection limit of M☉.
| GBT 1425+5235 | GBT 1355+5439 | |
|---|---|---|
| RA | 14:25:29.3 | 13:54:50.6 |
| Dec | +52:34:59 | +54:38:50 |
| D [kpc] | 450 | 160 |
| [km s-1] | 737 | 210 |
| [km s-1] | 77 | 41 |
| HI flux [Jy km s-1] | 5.1 | 1.1 |
| M [M☉] | ||
| 17.24 | … | |
| 0.30 | … | |
| 0.30 | … | |
| 0.07 | … | |
| Mg | 11.95 | … |
| L [L☉] | … | |
| MHI/LB | 0.25 | … |
Note. — Sensitivities are per 5.2 km s-1 velocity channel.
Note. — a) DM101 is the projected physical separation between the object and M101. b) MHI calculated assuming the objects are at the adopted M101 distance of 6.9 Mpc. c) LB calculated using the conversion from to B from Lupton (2005).

3.2. Extended HI around M101
A variety of studies have focused on the HI properties of M101, including both single-dish observations (HW79) and array synthesis observations (Allen & Goss 1979; vdHS88; Walter et al. 2008). Rather than focus our discussion on the well-studied inner regions of M101, we will concentrate on studying the diffuse outer features of the HI distribution; it is here that our very deep, wide-field data adds new information to the M101 system.
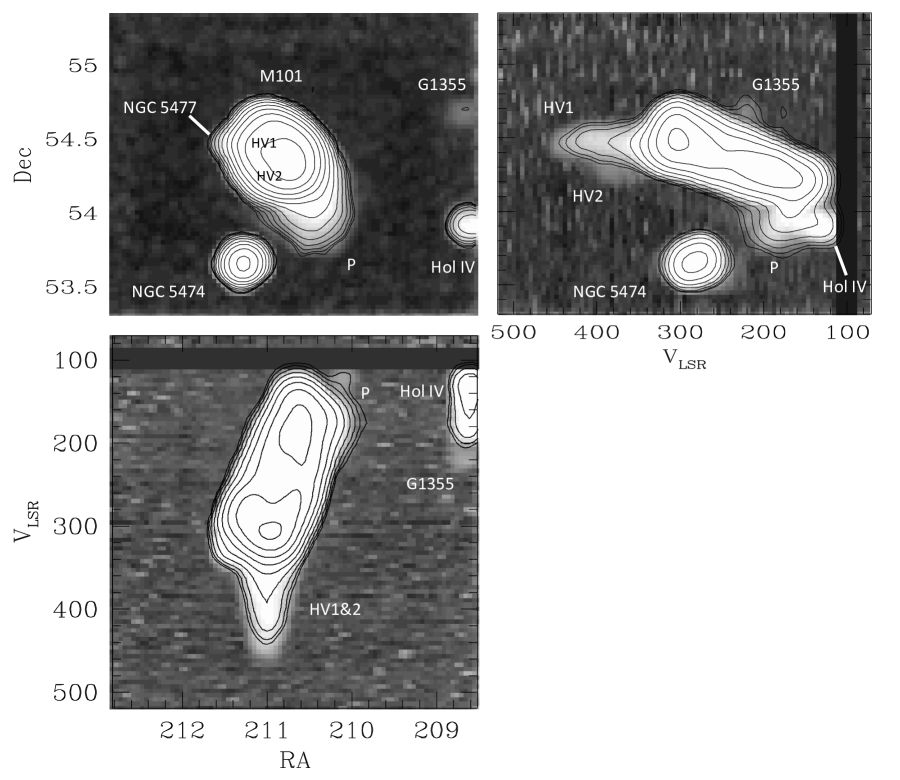
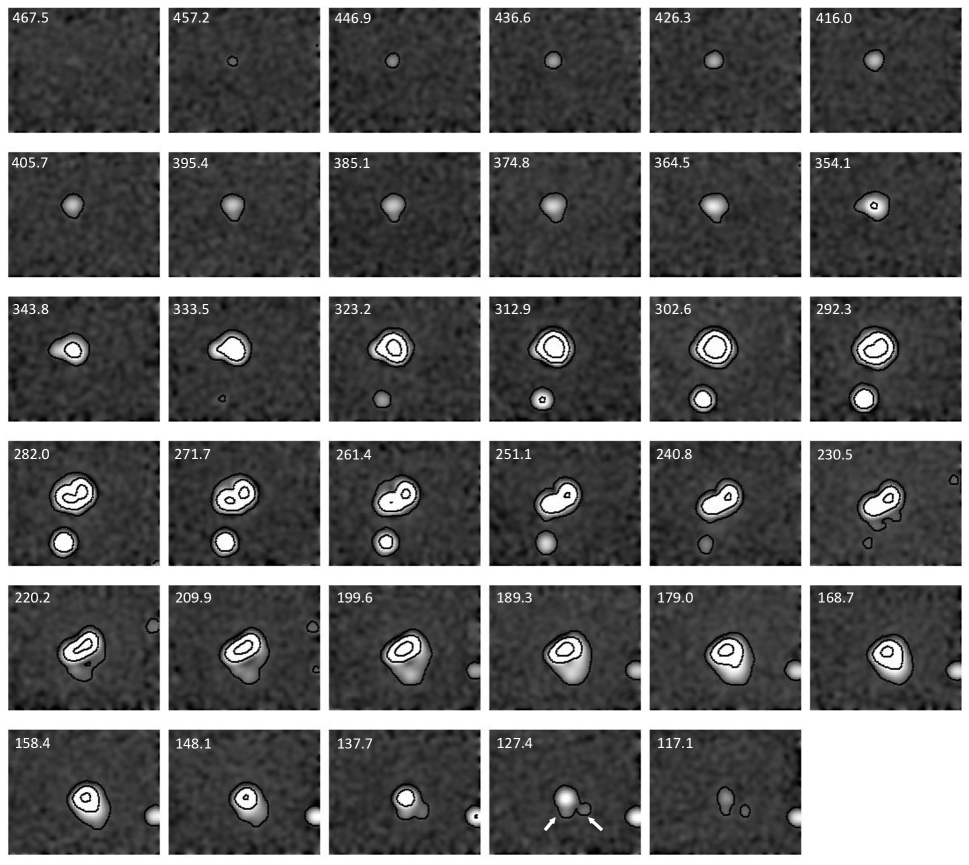
Figure 4 shows three orthogonal projections of our full HI datacube. In this figure, the intensity greyscale has been stretched to best show the diffuse HI structures at large radius and low column density, which saturates much of the emission from the inner parts of the galaxy. In our deep HI intensity map, the most striking feature is the long plume of HI extending to the southwest of M101. This gives the galaxy an HI asymmetry at low column density which is in the opposite sense from that indicated by the high column density THINGS map and at low surface brightness in the optical (Mihos et al. 2012), both of which show M101 extended to the northeast.555At even higher column density in the inner few kpc of the galaxy, the HI asymmetry swings back again to the southwest side of the galaxy, mirroring the well-known lopsidedness of M101’s optical disk (see, e.g., Mihos et al. 2012). This feature was noticed at higher column density ( cm-2) by HW79, and the HI synthesis map of vdHS88 shows it connecting smoothly into M101’s disk at yet higher column density ( cm-2). In our data, we trace this plume even farther out in radius to 85 kpc from the center of M101, where the column density has dropped to cm-2. The plume has no optical starlight associated with it, down to a limiting surface brightness of =29.5 (Mihos et al. 2012). The position-velocity plots in Figure 4 and the channel maps in Figure 5 show that this plume co-rotates with M101, following the general decline in M101’s rotation curve on the southwest side of the disk. However, the plume doesn’t show the simple kinematic behavior expected for simple circular motion; instead, it takes on a loop-like appearance in the channel maps from VLSR=210 to 180 km s-1, before filling in with emission at lower velocity of VLSR=150 km s-1. This could be a signature of a warping or flaring of the plume out of the plane of rotation, and the complex kinematic structure of this feature leads to the diffuse, irregular HI emission seen around the main kinematic structure of the plume in the position-velocity maps in Figure 4.
In addition to the plume itself, we see a number of discrete HI features in the dataset. Near the southwest plume, but discrete in velocity space from the plume itself, we find two distinct HI clouds. These clouds show up in the last few channel maps shown in Figure 5 around VLSR=127 km s-1 and have HI masses M☉. An examination of the extremely deep optical imaging by Mihos et al. 2012 shows no resolved optical counterparts at the position of these clouds. Given their low HI masses, it is unlikely that they could have pulled such a long plume of HI from M101 itself, but they may be similar to the HI clouds seen in the tidal debris in the M81 group, thought to form from tidally stripped gas during strong galaxy interactions (Chynoweth et al. 2008, 2011).
The position-velocity projections of the datacube (Figure 4) also show other HI features kinematically distinct from the ordered disk rotation of M101. The two regions of high velocity gas first noted by vdHS88 can easily be seen as a bright finger of HI emission extending to VLSR=460 km s-1 and another fainter feature just to the south at VLSR=400 km s-1. Both these features are projected onto the outskirt’s of M101’s disk and are spatially coincident with each of the low surface brightness tidal features seen in the outer optical disk (Mihos et al. 2012). Several dynamical models have been proposed to explain this high velocity gas, including infall of gas clouds onto M101’s disk (vdHS88) and tidal perturbations due to the interaction with M101’s dwarf companion galaxy NGC 5477 (Combes 1991).
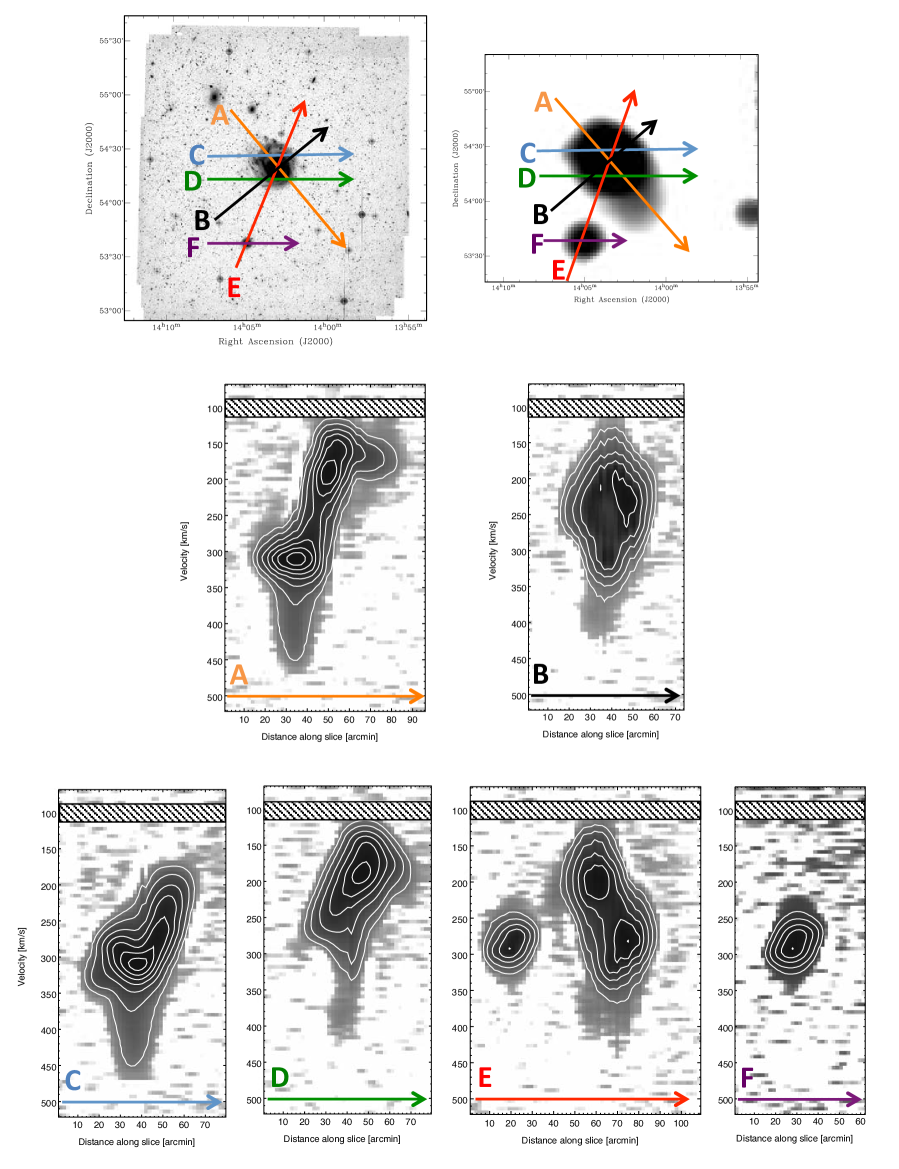
To further explore the HI kinematics around M101, Figure 6 shows position-velocity slices along selected spatial cuts through the data cube. The slices are extracted using the kpvslice task in the Karma data analysis package (Gooch 1996) and are 1.65′ (one spatial pixel) wide. Slice A is a cut along the kinematic major axis (, Bosma et al. 1981), showing M101’s projected HI rotation curve. This cut runs through the high velocity gas on the northeast side of the disk as well as the extended HI plume to the southwest. On both sides of the galaxy the projected velocities show a significant decline at larger radius, which could be a signature of either a declining rotation curve or a warping of the disk. While M101’s rotation curve does show a modest drop in the rotation speed in the inner disk (10′–14′; Bosma et al. 1981), we are seeing this behavior at much larger radius ( 30′). A minor axis cut can help discriminate between a warp and an overall decline in the rotation curve. In pure circular rotation, a minor axis cut should show no gradient, while a warp would skew the kinematic axes with radius and result in a gradient along a fixed kinematic minor axis cut. We show a minor axis cut in slice B, which does reveal a very modest gradient, but given the beam smearing in our data and the presence of the high velocity gas in the cut it is hard to interpret this gradient unambiguously. However, we also note that the projected velocities along the major axis show are asymmetric – they drop more steeply on the southwest side of the disk, and along this portion of the cut, diffuse gas can be seen moving both faster and slower than the main spine of the rotation curve. This is the region of the extended HI plume and again is suggestive of diffuse gas moving out of the disk plane, perhaps in a warp.
Aside from the major and minor axis cuts, we also present a variety of spatial cuts aimed at exploring the kinematics of the M101 system on larger scales. Slices C and D are cuts at constant declination through M101, and are analogous to the cuts in the HI synthesis map shown in Figure 2 of vdHS88; slice C cuts through the dwarf companion NGC 5477 and then through the north side of the disk, while slice D cuts through the south side of the disk. In slice C, NGC 5477 can be seen at the beginning of the cut at VLSR=330 km s-1, redshifted 50 km s-1 with respect to M101.
Slice E cuts first through the nuclei of both NGC 5474 and M101, and shows the presence of diffuse HI gas located between the galaxies. This gas is at velocities intermediate between NGC 5474’s systemic velocity and the velocity of the southeastern edge of M101’s disk, suggestive of material drawn out of M101 due to an interaction with NGC 5474. Indeed, a cut along the kinematic major axis of NGC 5474 (slice F) shows a slight kinematic asymmetry as well; there is more gas on the lower velocity side of the profile, at similar velocity (VLSR=240 km s-1) to the diffuse gas found between the galaxies in slice E. The gas at intermediate velocity may represent an actual bridge of material between the galaxies, or simply be a plume of tidally stripped gas that lies between the galaxies in projection.
4. Discussion
Our deep HI imaging of the M101 group does not reveal any large population of HI clouds at masses of a few M☉, echoing the results from HI searches in other nearby galaxy groups (de Blok et al. 2002; Pisano et al. 2007, 2011; Kovač et al. 2009; Chynoweth et al. 2009). Of the two new sources we detect in the group, one (G1425) is optically identifiable using SDSS imaging as an extremely low surface brightness dwarf galaxy. G1425’s properties make it comparable to the gas-rich HI dwarfs being found in blind HI surveys such as ALFALFA (Haynes et al. 2011; Cannon et al. 2011; Huang et al. 2012), with large HI fractions, blue colors, irregular structure, and evidence for on-going star formation. In contrast, G1355 potentially represents a much rarer object — a starless HI cloud with mass MHI M☉. While such objects are seen in the tidal debris surrounding strongly interacting galaxies (e.g., Chynoweth et al. 2009), G1355 itself seems to be truly distinct and isolated from M101’s extended (and likely tidal) HI plume. We detect no extended HI emission around G1355 out to a radius of 35′ (70 kpc); given that G1355’s peak brightness (40 mJy beam-1) is an order of magnitude greater than the background noise, this places a lower limit on the HI column density contrast between G1355 and its environment of 10:1. In comparison, the HI clouds we find near M101’s tidal plume, while comparable in mass to G1355, are embedded in the more diffuse plume emission with a density contrast of 3:1, and are very likely tidal in origin. Isolated starless HI clouds like G1355 are extremely rare — for example, less than 2% of the HI detected objects in the ALFALFA survey have no associated optical counterpart in SDSS or DSS2 imaging (Haynes et al. 2011). Many (3/4) of the starless ALFALFA HI sources are found in fields with known objects (Haynes et al. 2011) and may be associated with tidal debris or extended HI. While G1355 is also found in a field with neighboring galaxies, in this case we see no evidence tying it to any of the extended HI in the M101 group.
Given that G1425 and G1355 are found in the loose group environment, there may be a significant degree of photoionization from the UV radiation emitted by M101, as well as photoevaporation from any intragroup medium (e.g. Benson et al. 2002).666While the M101 group does not have a dense X-ray emitting IGM like those seen in elliptical-dominated groups, a more tenuous hot halo capable of stripping low mass dwarfs remains a possibility (e.g., Lin & Faber 1983; Freeland & Wilcots 2011). Because of this heating, it is expected that such low mass dwarfs may be surrounded by an envelope of ionized gas that shields the HI gas from further disruption (Sternberg et al. 2002). The detectable HI, then, may be just the tip of the iceberg that marks the true gas content associated with these objects. Since these dwarfs will also be subject to ram pressure stripping by the intragroup medium, it may well be true that they are newly accreted into the M101 group, or on more circular orbits that prevent them from encountering particularly dense intragroup gas (e.g. Gunn & Gott 1972; Nichols & Bland-Hawthorn 2011; Freeland & Wilcots 2011).
More speculatively, it might be tempting to call G1355 a pre-reionization fossil dwarf, a protogalaxy whose star formation history was cut short by the epoch of reionization (Ricotti & Gnedin 2005). While the canonical fossil dwarf is presumed to be an ancient dSph that is nearly devoid of gas, more detailed work predicts that there is a class of ’polluted’ fossil dwarfs that have a late spurt of gas accretion from the intergalactic medium onto an essentially dark minihalo (Ricotti 2009). These pre-reionization artifacts, then, should be undetectable optically, but should show up in a deep HI survey due to their cold gas content (Bovill & Ricotti 2011) — similar on the face to G1355. However, the likeliest location of polluted fossil dwarfs is in voids, not loose groups. In addition, with a line width of =40km s-1, G1355 might exceed the minimum halo mass below which reionization could have halted collapse and star formation in the dwarf (MM☉ ( km s-1) (Babul & Rees 1992; Efstathiou 1992) and thus not be a good candidate for a pre-reionization fossil dwarf.
If both G1425 and G1355 are virialized, HI-dominated dwarf galaxies, we can use their HI mass to place them on the baryonic Tully-Fisher relationship (McGaugh et al. 2000; McGaugh 2012). There is significant scatter at the low mass end of the relation, for G1425 we get =30–75 km s-1 and for G1355 =20–50 km s-1. Our measurements of (77 km s-1 and 41 km s-1, respectively) are consistent with, but on the high side of, these ranges. This may argue that both systems are observed largely edge on, which maximizes the rotation width, or that the objects have significant non-circular motion, either because they are not yet virialized, or because they are being tidally disrupted by M101 and other galaxies in the M101 group. Followup HI synthesis mapping would help discriminate between these possibilities and shed light on the true nature of these objects.
The lack of a large population of neutral hydrogen clouds in the M101 group argues that M101 is likely not experiencing significant cold accretion directly from the surrounding intragroup medium. This is perhaps not surprising for a massive galaxy in the local universe. M101’s circular velocity ( 220 km s-1; Bosma et al. 1981) and size suggest a total mass on the order of M☉. This mass marks the threshold above which the galaxy accretes through a predominantly hot, shock-heated mode, where cold flows are unlikely to reach the disk unimpeded by the hot halo. However, Kereš et al. 2009 find that HI filaments and clouds can still form via a density inversion as the the accreting gas enters a hot gaseous halo, triggering Rayleigh-Taylor instabilities. These clouds rain down radially on the disk from distances of kpc and the most massive of these M☉are expected to survive and feed the disk (Kereš et al. 2009). With NHI 1016 cm-2, a covering fraction approaching 10%, and velocities distinctly decoupled from disk rotation, this phenomenon could be a channel to form HVCs (Stewart et al. 2011).
While this hot accretion mechanism can continue feeding gas to the disk of a massive galaxy like M101, such clouds would be below our detection threshold and go unnoticed in our dataset. Indeed, the masses of G1355 and the two discrete clouds seen near the extended HI plume are all M☉, higher than expected for clouds condensing out of a hot halo. At least for the two clouds near the plume, it is more likely that they formed through the same tidal interaction that led to the plume itself, much like the HI clouds found in the M81/M82 system (Chynoweth et al. 2008). While G1355 may have formed this way as well, the lack of a connection to any of the diffuse HI tidal debris around M101 makes this identification less secure.
While the detected cloud masses in M101’s plume are not a good match for clouds accreting from a warm halo, they are similar to the masses of the high velocity gas complexes seen in M101’s outer disk ( M☉, vdHS88). A large fraction of the material tidally stripped during galaxy encounters can fall back to the host galaxy over long timescales (Hibbard & Mihos 1995); were these clouds to fall back on to M101, they too could punch through the disk gas and lead to the formation of such high velocity cloud complexes; mass loading during the interaction between the cloud and the disk gas could increase the mass of the resulting high velocity gas complex as well. Thus the clouds we see may well be the progenitors to the current high velocity gas features seen in M101’s disk, spawned by a past interaction that also led to M101’s strong asymmetry and extended HI plume.
M101’s well-known asymmetry has long been believed to arise from an interaction (Beale & Davies 1969; Rownd et al. 1994; Waller et al. 1997), but unambiguously identifying the interacting partner has remained difficult. The two most obvious candidates are NGC 5477, located 22′(44 kpc) east of M101, and NGC 5474, 44 (88 kpc) to the south. NGC 5477 resides near M101’s crooked NE spiral arm; while it is clearly distorted and interacting with M101, its low luminosity (M; de Vaucouleurs et al. 1991) makes it unlikely to be massive enough to produce such a strong morphological response in a giant Sc spiral like M101. NGC 5474 is a more luminous system (M; de Vaucouleurs et al. 1991) and sports a strongly asymmetric disk (Rownd et al. 1994, Kornreich et al. 1998), but shows no sign of any extended tidal debris in the optical (Mihos et al. 2012). Previous single dish mapping of the M101 system hinted at the possibility of an HI bridge between NGC 5474 and M101 (HW79), but subsequent HI synthesis imaging has shown no sign of any HI tidal features around NGC 5474 (Rownd et al. 1994, Kornreich et al. 2000) which might trace a previous interaction. Our data strengthen the case for a past interaction between M101 and NGC 5474. In diffuse HI, we find gas between the galaxies at intermediate velocity, as would be expected from a tidal feature drawn out of M101 by the interaction. First hinted at in the single dish data of HW77, this feature can clearly be seen in slice D on our Figure 6. NGC 5474 itself shows a slight kinematic asymmetry as well (slice E), with more extended HI emission at lower velocities similar to that on the southern edge of M101’s disk.
An accurate estimate of the mass ratio of the M101/NGC5474 pair is quite difficult. Because both galaxies are largely face-on, and because of the kinematic irregularity of M101’s extended disk, deriving dynamical masses for each galaxy is fraught with uncertainty (HW77; Allen et al. 1978; Bosma et al. 1981; Rownd et al. 1994), and estimates of the mass ratio between the pair range from 20:1 to 200:1 depending on the different dynamical mass estimates used. Even under the simplest (and likely incorrect) assumption that the galaxies have similar mass to light ratios, the mass ratio of the pair can range from 15:1 based on the V-band flux ratio (RC3, de Vaucouleurs et al. 1991) to 40:1 based on the K-band flux ratio (Jarrett et al. 2003). Even with the significant uncertainty, and even accounting for any mass loss that may have been experienced by NGC 5474 during the encounter, it seems clear that this would have been a high mass ratio interaction. For this type of encounter to do such significant damage to M101’s disk, the encounter would have to be largely prograde, or involve a close impact parameter, since distant or retrograde encounters typically result in a relatively weak disk response (Toomre & Toomre 1972). Close or prograde encounters would also be effective at drawing material out of the galaxy disks and forming the kinematic irregularities, extended HI plume, and high velocity cloud structures we see in our data.
5. Summary
Taken as a whole, our deep, wide-field HI map of the M101 group has revealed a number of features indicative of a very dynamic gaseous environment surrounding M101. We have traced M101’s extended (and likely tidal) plume of neutral hydrogen 100 kpc to the southwest of the galaxy, where it contains two distinct, massive ( M☉) clouds. Clouds such as these may be the source of gaseous infall that gives rise to the high velocity gas seen in M101’s outer disk (vdHS88), as they fall back onto the galaxy from the tidal debris. We also identify two new discrete HI sources in the M101 group, one a new and extremely low surface brightness dwarf galaxy and another a starless HI cloud or, possibly, primordial dwarf galaxy. Finally, we identify a possible bridge or plume of gas at intermediate velocities between M101 and NGC 5474 which may indicate a recent interaction between the galaxies, possibly leading to their highly asymmetric morphologies and giving rise to M101’s extended HI plume.
With growing evidence that both NGC 5477 and NGC 5474 have recently interacted with M101, we are building a picture of the M101 group as a dynamically active system. If our two new HI detections do prove to be gas-rich, relatively unevolved dwarf galaxies, the fragility of these objects in the group environment may further underline the image of a still assembling galaxy group.
References
- Abazajian et al. (2009) Abazajian, K. N., Adelman-McCarthy, J. K., Agüeros, M. A., et al. 2009, ApJS, 182, 543
- Allen & Goss (1979) Allen, R. J., & Goss, W. M. 1979, A&AS, 36, 135
- Allen et al. (1978) Allen, R. J., van der Hulst, J. M., Goss, W. M., & Huchtmeier, W. 1978, A&A, 64, 359
- Babul & Rees (1992) Babul, A., & Rees, M. J. 1992, MNRAS, 255, 346
- Barnes (2011) Barnes, J. E. 2011, MNRAS, 413, 2860
- Beale & Davies (1969) Beale, J. S., & Davies, R. D. 1969, Nature, 221, 531
- Benson et al. (2002) Benson, A. J., Lacey, C. G., Baugh, C. M., Cole, S., & Frenk, C. S. 2002, MNRAS, 333, 156
- Bosma et al. (1981) Bosma, A., Goss, W. M., & Allen, R. J. 1981, A&A, 93, 106
- Bothun et al. (1997) Bothun, G., Impey, C., & McGaugh, S. 1997, PASP, 109, 745
- Bovill & Ricotti (2011) Bovill, M. S., & Ricotti, M. 2011, ApJ, 741, 18
- Cannon et al. (2011) Cannon, J. M., Giovanelli, R., Haynes, M. P., et al. 2011, ApJ, 739, L22
- Chynoweth et al. (2011) Chynoweth, K. M., Holley-Bockelmann, K., Polisensky, E., & Langston, G. I. 2011, AJ, 142, 137
- Chynoweth et al. (2011) Chynoweth, K. M., Langston, G. I., & Holley-Bockelmann, K. 2011, AJ, 141, 9
- Chynoweth et al. (2009) Chynoweth, K. M., Langston, G. I., Holley-Bockelmann, K., & Lockman, F. J. 2009, AJ, 138, 287
- Chynoweth et al. (2008) Chynoweth, K. M., Langston, G. I., Yun, M. S., et al. 2008, AJ, 135, 1983
- Combes (1991) Combes, F. 1991, A&A, 243, 109
- de Blok et al. (2002) de Blok, W. J. G., Zwaan, M. A., Dijkstra, M., Briggs, F. H., & Freeman, K. C. 2002, A&A, 382, 43
- Dekel & Birnboim (2006) Dekel, A., & Birnboim, Y. 2006, MNRAS, 368, 2
- Efstathiou (1992) Efstathiou, G. 1992, MNRAS, 256, 43P
- Freeland & Wilcots (2011) Freeland, E., & Wilcots, E. 2011, ApJ, 738, 145
- Gallagher et al. (1998) Gallagher, J. S., Tolstoy, E., Dohm-Palmer, R. C., et al. 1998, AJ, 115, 1869
- Gooch (1996) Gooch, R. 1996, Astronomical Data Analysis Software and Systems V, 101, 80
- Gunn & Gott (1972) Gunn, J. E., & Gott, J. R., III 1972, ApJ, 176, 1
- Haynes et al. (1979) Haynes, M. P., Giovanelli, R., & Roberts, M. S. 1979, ApJ, 229, 83
- Haynes et al. (2011) Haynes, M. P., Giovanelli, R., Martin, A. M., et al. 2011, AJ, 142, 170
- Hibbard & Mihos (1995) Hibbard, J. E., & Mihos, J. C. 1995, AJ, 110, 140
- Hibbard et al. (2001) Hibbard, J. E., van Gorkom, J. H., Rupen, M. P., & Schiminovich, D. 2001, Gas and Galaxy Evolution, 240, 657
- Huang et al. (2012) Huang, S., Haynes, M. P., Giovanelli, R., et al. 2012, AJ, 143, 133
- Huchtmeier & Witzel (1979) Huchtmeier, W. K., & Witzel, A. 1979, A&A, 74, 138
- Jarrett et al. (2003) Jarrett, T. H., Chester, T., Cutri, R., Schneider, S. E., & Huchra, J. P. 2003, AJ, 125, 525
- Kereš et al. (2009) Kereš, D., Katz, N., Fardal, M., Davé, R., & Weinberg, D. H. 2009, MNRAS, 395, 160
- Kereš et al. (2005) Kereš, D., Katz, N., Weinberg, D. H., & Davé, R. 2005, MNRAS, 363, 2
- Kniazev et al. (2009) Kniazev, A. Y., Brosch, N., Hoffman, G. L., et al. 2009, MNRAS, 400, 2054
- Kornreich et al. (1998) Kornreich, D. A., Haynes, M. P., & Lovelace, R. V. E. 1998, AJ, 116, 2154
- Kornreich et al. (2000) Kornreich, D. A., Haynes, M. P., Lovelace, R. V. E., & van Zee, L. 2000, AJ, 120, 139
- Kovač et al. (2009) Kovač, K., Oosterloo, T. A., & van der Hulst, J. M. 2009, MNRAS, 400, 743
- Langston & Turner (2007) Langston, G., & Turner, B. 2007, ApJ, 658, 455
- Larson (1972) Larson, R. B. 1972, Nature, 236, 21
- Lin & Faber (1983) Lin, D. N. C., & Faber, S. M. 1983, ApJ, 266, L21
- Maller & Bullock (2004) Maller, A. H., & Bullock, J. S. 2004, MNRAS, 355, 694
- Mangum et al. (2007) Mangum, J. G., Emerson, D. T., & Greisen, E. W. 2007, A&A, 474, 679
- Matheson et al. (2012) Matheson, T., Joyce, R. R., Allen, L. E., et al. 2012, ApJ, 754, 19
- McGaugh et al. (2000) McGaugh, S. S., Schombert, J. M., Bothun, G. D., & de Blok, W. J. G. 2000, ApJ, 533, L99
- McGaugh (2012) McGaugh, S. S. 2012, AJ, 143, 40
- Michel-Dansac et al. (2010) Michel-Dansac, L., Duc, P.-A., Bournaud, F., et al. 2010, ApJ, 717, L143
- Mihos et al. (2012) Mihos, C., Harding, P., Spengler, C., Rudick, C., & Feldmeier, J. 2012, arXiv:1211.3095
- Nichols & Bland-Hawthorn (2011) Nichols, M., & Bland-Hawthorn, J. 2011, ApJ, 732, 17
- Ott et al. (1994) Ott, M., Witzel, A., Quirrenbach, A., et al. 1994, A&A, 284, 331
- Pisano et al. (2007) Pisano, D. J., Barnes, D. G., Gibson, B. K., et al. 2007, ApJ, 662, 959
- Pisano et al. (2011) Pisano, D. J., Barnes, D. G., Staveley-Smith, L., et al. 2011, ApJS, 197, 28
- Ricotti (2009) Ricotti, M. 2009, MNRAS, 392, L45
- Ricotti & Gnedin (2005) Ricotti, M., & Gnedin, N. Y. 2005, ApJ, 629, 259
- Rownd et al. (1994) Rownd, B. K., Dickey, J. M., & Helou, G. 1994, AJ, 108, 1638
- Sancisi et al. (2008) Sancisi, R., Fraternali, F., Oosterloo, T., & van der Hulst, T. 2008, A&A Rev., 15, 189
- Schneider (1985) Schneider, S. 1985, ApJ, 288, L33
- Sommer-Larsen (2006) Sommer-Larsen, J. 2006, ApJ, 644, L1
- Sternberg et al. (2002) Sternberg, A., McKee, C. F., & Wolfire, M. G. 2002, ApJS, 143, 419
- Stewart et al. (2011) Stewart, K. R., Kaufmann, T., Bullock, J. S., et al. 2011, ApJ, 738, 39
- Thilker et al. (2007) Thilker, D. A., Bianchi, L., Meurer, G., et al. 2007, ApJS, 173, 538
- Toomre & Toomre (1972) Toomre, A., & Toomre, J. 1972, ApJ, 178, 623
- Tully (1988) Tully, R. B. 1988, Nearby Galaxies Catalog (Cambridge: Cambridge Univ. Press)
- van der Hulst & Sancisi (1988) van der Hulst, T., & Sancisi, R. 1988, AJ, 95, 1354
- van Zee (2001) van Zee, L. 2001, AJ, 121, 2003
- Wakker & van Woerden (1991) Wakker, B. P., & van Woerden, H. 1991, A&A, 250, 509
- Waller et al. (1997) Waller, W. H., Bohlin, R. C., Cornett, R. H., et al. 1997, ApJ, 481, 169
- Walter et al. (2008) Walter, F., Brinks, E., de Blok, W. J. G., et al. 2008, AJ, 136, 2563
- Whiting et al. (2007) Whiting, A. B., Hau, G. K. T., Irwin, M., & Verdugo, M. 2007, AJ, 133, 715
- Yun (1999) Yun, M. S. 1999, in IAU Symp. 186, Galaxy Interactions at Low and High Redshift, ed. J. E. Barnes & D. B. Sanders (Cambridge: Cambridge Univ. Press), 81
- Yun et al. (1994) Yun, M. S., Ho, P. T. P., & Lo, K. Y. 1994, Nature, 372, 530