The near-IR counterpart of IGR J17480-2446 in Terzan 5††thanks: Based on observations collected at the European Organisation for Astronomical Research in the Southern Hemisphere, Chile, DDT proposal 286.D-5012. Based on observations made with the NASA/ESA Hubble Space Telescope, obtained from the data archive at the Space Telescope Science Institute. STScI is operated by the Association of Universities for Research in Astronomy, Inc. under NASA contract NAS 5-26555.
Abstract
Context. Some globular clusters in our Galaxy are noticeably rich in low-mass X-ray binaries. Terzan 5 has the richest population among globular clusters of X- and radio-pulsars and low-mass X-ray binaries.
Aims. The detection and study of optical/IR counterparts of low-mass X-ray binaries is fundamental to characterizing both the low-mass donor in the binary system and investigating the mechanisms of the formation and evolution of this class of objects. We aim at identifying the near-IR counterpart of the 11 Hz pulsar IGRJ17480-2446 discovered in Terzan 5.
Methods. Adaptive optics (AO) systems represent the only possibility for studying the very dense environment of GC cores from the ground. We carried out observations of the core of Terzan 5 in the near-IR bands with the ESO-VLT NAOS-CONICA instrument.
Results. We present the discovery of the likely counterpart in the band and discuss its properties both in outburst and in quiescence. Archival HST observations are used to extend our discussion to the optical bands.
Conclusions. The source is located at the blue edge of the turn-off area in the color-magnitude diagram of the cluster. Its luminosity increasefrom quiescence to outburst, by a factor 2.5, allows us to discuss the nature of the donor star in the context of the double stellar generation population of Terzan 5 by using recent stellar evolution models.
Key Words.:
pulsars: general – pulsars: individual: IGR J17480-2446 – binaries: close – globular clusters: individual: Terzan 51 Introduction
IGRJ17480-2446 (hereafter IGRJ17480) was detected on October 10, 2010 with INTEGRAL (Bordas et al. 2010) and then later identified as a newly discovered accreting pulsar with a spin period of 90.6 ms (Altamirano et al. 2010; Strohmayer & Markwardt 2010). The properties and evolution of its X-ray emission have been studied in detail (see, e.g. Motta et al. 2011), and the timing analysis of the pulse period has revealed that the system has an orbital period of (Strohmayer et al. 2010; Papitto et al. 2011). This is the most central pulsar in the globular cluster (GC) Terzan 5, located at about of the optical center. The X–ray position has been accurately determined by Pooley et al. (2010) with the satellite Chandra and, more recently, by Riggio et al. (2012) using a moon occultation method (MO) that allowed an accuracy of 0.04′′.
Low-mass X-ray binaries (LMXBs) are binary systems in which a compact primary (neutron star or black hole) accretes matter via mass transfer by Roche lobe overflow from a donor low-mass star. The accreting gas transfers angular momentum to the old neutron star, “recycling” it to millisecond rotation periods (Bhattacharya & van den Heuvel 1991). This system is particularly interesting, because the long spin period of the neutron star () points to the possibility that it has been caught at the beginning of the mass-transfer phase that is accelerating it to a millisecond pulsar, thus it is a good candidate for enlightening the link between the X-ray sources and the radio millisecond pulsars proposed by this “recycling scenario”. Papitto et al. (2012) analyze the spectral and pulse properties of IGRJ17480 and find that the pulsar is indeed spinning up, and a similar result is also presented by Patruno et al. (2012).
The detection and study of optical/IR counterparts of LMXBs is important in order to study the nature and characteristics of donor stars and clarify the evolutionary status of the system. Detection of optical/IR counterparts in GCs is often difficult because of crowding conditions that affect many GCs. The discovery is usually achievable only from space or with adaptive optics (AO) systems from the ground. Near-IR bands have the advantage of a reduced extinction with respect to the optical bands, a crucial bonus for cases like this, in which the target cluster lies in a strongly obscured region (, meaning an extinction in the band of more than six magnitudes, Barbuy et al. 1998; Valenti et al. 2007).
Terzan 5 is one of the densest and metal-richest clusters in our Galaxy (Cohn et al. 2002; Ortolani et al. 2007), and this characteristic feature favored the formation of a large number of rotation-powered millisecond pulsars, with 35 pulsars discovered so far111see the web page maintained by P. Freire for an updated list: http://www.naic.edu/pfreire/GCpsr.html (Ransom et al. 2005; Hessels et al. 2006; Pooley et al. 2010). In addition, recent studies have revealed in Terzan 5 the presence of two different stellar populations: a metal-poor () and a metal-rich one () (Ferraro et al. 2009, F09). Although the presence of multiple populations is now recognized to be very common in GCs (e.g. Carretta et al. 2009; Piotto 2009), it is unusual to have such bimodality in metallicity. The two interpretations proposed (see, e.g. D’Antona et al. 2010) are either that the two generations differ by 6 Gyr in age (F09), the younger being the most metal-rich, or they are almost coeval, but in this case the metal richer population must also show higher He content. In this work, we report on the near-IR counterpart identification of IGRJ17480, obtained with observations taken after the detection of the outbursting pulsar and by comparison with archival data of the same field taken in the same bands and with similar techniques in 2008 by F09. The comparison allows us to determine the brightening of the source between the quiescent phase and the X–ray outburst of 2010, as well as its consequences for the binary model. In addition, the location of the source in quiescence with respect to the cluster average stellar loci in the optical color-magnitude diagram allows us to consider its probable evolutionary status and to place it in the context of the two stellar generations that populate Terzan 5. In Sect. 2 we describe the data set and the procedure used for the detection of the IR counterpart, then we analyze the results with the help of photometry of archival optical data from HST and compare them with model predictions in Sect. 3. Finally, we briefly summarize the conclusions in Sect. 4.
2 Near-IR photometry
2.1 Observations, reductions, and calibrations
Observations were carried during the X-ray outburst phase, within a director’s discretionary Time (DDT) proposal at ESO-VLT with the NAOS-CONICA AO near-IR camera. Data were obtained during four nights in November 2010 in the , , and bands, at the very beginning of the night at a considerably high airmass (), owing to the limited visibility window of the target at the epoch of observation. Although in the and bands data were never good enough to allow precise photometric analysis, the -band images taken in nights 3 and 4 were of sufficient quality to resolve the very crowded center of Terzan 5.
The whole data set consists of 12 images of each, which were reduced following a standard procedure for infrared images: i) subtraction of a median sky frame, taken off-source because of the crowding; ii) flat fielding; iii) alignment and sum of all single images to obtain a final image of 672s equivalent exposure time. On this image we used the DAOPHOTII (Stetson 1987, 1994) version available in the suite IRAF222IRAF is distributed by the National Optical Astronomy Observatories, which are operated by the Association of Universities for Research in Astronomy, Inc., under cooperative agreement with the National Science Foundation. (Tody 1986, 1993) to detect and measure sources via both PSF profile fitting and aperture photometry. We used a semi-analytic model for the PSF, with a core described by an analytic function (in this case the best choice among the available forms was a “penny2” function, i.e. a Gaussian core with Lorentzian wings model with a beta parameter of 1.0, where the Gaussian core and Lorentzian wings may be tilted in different directions). The outskirts were modeled by adding to the analytical function describing the wings of the PSF a nonanalytical contribution in the form of a residual correction matrix, established by using all the stars used for the PSF model, and weighing the contributions by the inverse square of the noise. In this way we found that the PSF model varies with the distance from the star chosen for the wavefront analysis with a trend described well by a quadratic function of the radius. Calibration was obtained via comparison with the photometry of F09 obtained on the same field with the Multi-conjugated Adaptive Optics (MAD) camera at ESO-VLT, by analyzing a subset of stars in common with our observation after selecting those that were not too bright to prevent systematic effects of nonlinearity.
| ID# | R.A. | Dec. | K(2010) | K(2008) | ||
|---|---|---|---|---|---|---|
| 1 | 17:48:04.822 | -24:46:48.81 | 13.88 | 0.05 | 13.91 | 0.02 |
| 2 | 17:48:04.822 | -24:46:48.90 | 15.40 | 0.15 | 16.44 | 0.15 |
| 3 | 17:48:04.845 | -24:46:48.82 | 16.10 | 0.40 | 15.90 | 0.10 |
2.2 Astrometry, photometry, and counterpart identification
To obtain the astrometric calibration, we attempted to use the UCAC3 catalog (Zacharias et al. 2010), which is an improved version of the more commonly used USNO catalog obtained with astrographic techniques, but we found only one catalog star in the small field of view of NACO. We therefore followed a two-step approach, using archival images from the HST archive. In particular, we used two images of Terzan 5 taken with the ACS/WFC in 2003 in the F606W (R) and F814W (I) filters. These images already have an astrometric solution written in the image header, which was found to have a 0.5′′ offset from the UCAC3 reference positions.
As a first step, we thus obtained an astrometric solution by using 21 UCAC3 catalog stars present in the field of view of HST/ACS, with a magnitude range between 11 and 16. Then, we used the sources from HST images as secondary astrometric calibrators for our VLT/NACO images. As a byproduct, we also obtained the photometric catalog of the stars in the HST/ACS images. The uncertainty on the astrometric fit, obtained as described above, was estimated by combining the error from the first fit and the fit of the secondary calibration process. For the first we assumed as source errors the r.m.s. of the fit, the positional error on the catalog given in the UCAC3 table, the centroiding error on the HST stars, and the systematic error of the UCAC3 catalog with reference to the absolute coordinate system. The secondary astrometric fit has a negligible error (formal r.m.s. of 0.01 m.a.s.) so that we neglect it in the total error estimation. The adopted uncertainty on the astrometry for the our VLT/NACO position is 50 m.a.s., on the basis of the analysis described above.
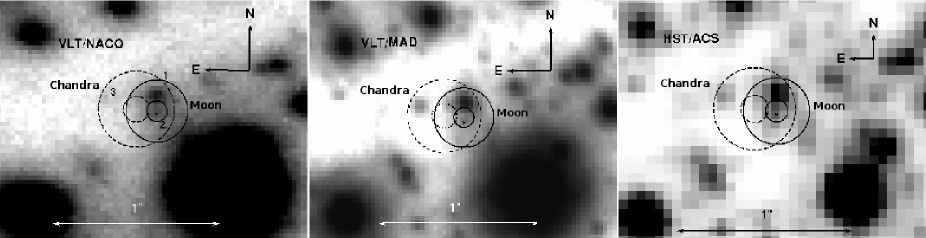
Figure 1 (left panel) shows a subimage around the X-ray transient position. The positions of the X-ray transient found with the Moon occultation method and with Chandra are shown with error circles drawn at 1 and 3 radii, computed by combining the errors quoted by the authors (0.04′′ for MO, 0.06′′ for Chandra) and the uncertainty on the astrometric fit (0.05′′).
We found three sources within 3 radius of the X-ray transient positions. For the MO position, the easternmost source (#3 in Fig. 1) is outside the error box, so we only consider it as a possible counterpart to the Chandra position. Table 1 reports the position and magnitudes of the three sources. Source #2, on the other hand, is very close to the nominal position of the MO X-ray transient. If we consider the latest measurement performed by using the lunar laser altimetry by the LRO/NASA satellite (see Riggio et al. 2012), the two positions differ by 32 m.a.s.. To determine whether one of the three candidate sources had varied with respect to the epoch of MAD observations, we compared our catalog with the one from F09. One of the sources (#2) is not present in the F09 catalog. This source has magnitude (see Table 1), whereas the limiting magnitude of the VLT/NACO image is (at level).
We checked in the images of F09 that the source is indeed visible but not included in the photometric catalog, or if it is not visible at all. We therefore selected the best K-band images from the MAD dataset (i.e. those having the lowest values of FWHM) and again performed the photometry in the subimage around the X-ray transient position. In this image, the object has been detected and measured by DAOPHOTII, finding , with a level magnitude limit of , while the other two sources do not show variation in magnitude between the two epochs.
On the basis of the results described above, it can be seen that the source has increased its brightness by 1.04 mag between the two epochs, i.e. a factor of , and thus we identify it as the most probable IR counterpart to the X-ray transient IGRJ17480. Figure 1 (central panel) shows the same area around the transient position on the MAD image, while the corresponding area in the HST/ACS F814W image is shown in the right hand panel of the same figure. According to our astrometric calibration, the position of the source is =17:48:04.822 ; =-24:46:48.90, to which we associate an 1 uncertainty of 0.05.
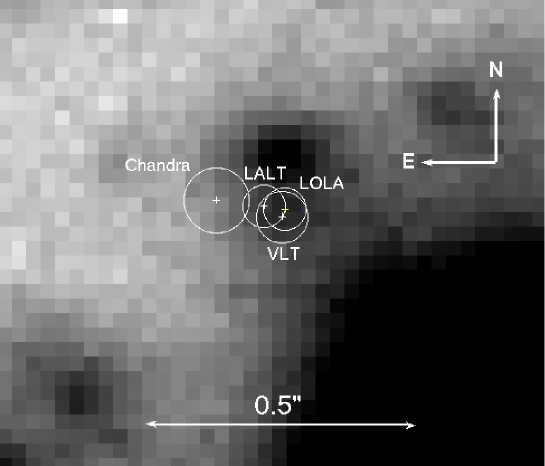
Figure 2 shows the X-ray transients positions determined with Chandra (Pooley et al. 2010) and with Rossi/XTE and the Moon Occultation method, using two different laser altimetry onboard lunar missions, i.e. LRO/NASA (LOLA) and NAGUYA/JAXA (LALT) (Riggio et al. 2012), and the IR counterpart position discussed in this work.
2.3 Comparison with archival HST observations during quiescence
Another check was made by using the two archival images taken with the HST/ACS in the F606W and F814W filters. The source is visible in the two HST images, although the image is undersampled and the crowding conditions extreme. Despite the undersampling (FWHM 1.8 pixels), DAOPHOTII was able to detect and measure the candidate, although the procedure was more challenging and required a manual identification of the source. We found , for the source in the Vegamag system.
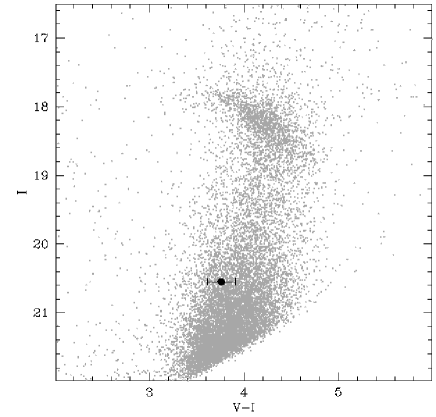
We then transformed the magnitudes of the HST/ACS catalog into standard V,I magnitudes by using the Sirianni et al. (2005) relations, and obtain , for the candidate counterpart,. Figure 3 shows the color-magnitude diagram with the position of the candidate counterpart superimposed. The mean loci of the color-magnitude diagram are considerably spread out most probably because of the differential reddening affecting the cluster.
We compared our results with Patruno & Milone (2012), who used the same HST archival data set as used in this work. The authors report identifying the optical companion of our IR counterpart as their star #2, which has magnitudes and colors that are consistent with the ones reported above. However, star #2 of Patruno & Milone (2012) does not seem to correspond to our proposed conterpart. It is a faint object located halfway between the bright star just above the counterpart (#4 in Patruno & Milone 2012) and the much brighter star located to the SW. It is at about 0.6″ from the X-ray source position as determined by Chandra and the Moon occultation observed by RXTE. This object is not visible in the IR image of Fig. 1 because the choice of the contrast level is such that it is embedded in the PSF of the bright star, but it is visible in the HST/ACS image (see right panel of Fig. 1). However, it has been detected and measured in the near-IR, showing no sign of variation between the 2008 and 2010 epochs. Moreover, in the optical images it looks extended, and in the F814W image it has been actually deblended into two separate components. On the basis of the discussion above, we conclude that the counterpart proposed in Patruno & Milone (2012) does not correspond to our IR counterpart, but it is another object that has similar magnitude and color.
3 Analysis and comparison with theory
The counterpart, at the epoch of HST observations (2003) is presumably in quiescence and lies in the turn-off region of the color-magnitude diagram, slightly bluer than the average main sequence locus. We take it as a bona–fide position, although it could be simply due to the relatively high photometric error and/or to the differential reddening affecting the cluster. Considering the differential reddening, we note that the average value for reddening in Terzan 5 is (Barbuy et al. 1998), and recent determinations indicate that in the source area, very close to the optical center of the cluster (Massari et al. 2012). This correction does not help put the object closer to the main sequence mean locus, because the source would be even bluer in a dereddened diagram. We therefore assume that the star is actually on the blue edge of the main sequence locus at the turnoff level.
We now make a differential analysis of the few data we have on this system, to understand whether they form a coherent frame in which to interpret its evolution and properties. We try to answer to two main questions:
-
1.
Are the location of the optical companion in the HR diagram in 2003 and the increase by a factor 2.5 between 2008 and 2010 in its IR luminosity consistent with the system’s evolutionary status?
-
2.
Can the photometric results for the optical counterpart provide indications that attribute IGRJ17480 to one of the two stellar populations of Terzan 5?
3.1 X–ray heating during the X–ray transient phase
First of all, the location of the object identified as a possible companion of the pulsar, close to the cluster turnoff during the quiescence status of 2003, shows that its mass must be close to the turnoff mass in this cluster. We put it here at =0.8, but see the discussion in Sect. 3.2. We choose a typical neutron star mass of =1.4 for the pulsar (see the justification below). The X-ray burst activity of the source and the fact that the neutron star has been accelerated up to the 90 ms spin period indicate that the neutron star is accreting from the donor, so that the donor radius must be close to its Roche lobe radius. We can therefore require that the companion radius R2 is equal to its Roche lobe radius , where can be calculated using the standard approximation by Paczyński (1971).
From similar optical studies performed on other known accreting LMXBs we know that the observed optical counterpart of these sources is too bright to be the result of intrinsic emission from the companion star (expected to be a low-mass star, usually less than 1 ). Optical emission during X-ray outbursts comes from the X-ray irradiated face of the companion star and/or the accretion disk (see e.g. Giles et al. 1999; Wang et al. 2001). Indeed, the optical luminosity is observed to decay with time as the X-ray flux decays during the outburst, until it reaches a minimum value during X-ray quiescence. Both the disk and one face of the companion will be irradiated by the X-ray emission from the central source.
The X-ray luminosity - during the outburst in the date of IR observations - was erg/s (Papitto et al. 2012), calculated from the measured X-ray flux and spectrum of the source, at a distance of 5.9 kpc, which is the current estimate for Terzan 5 (Lanzoni et al. 2010). In the hypothesis that this luminosity heats the accretion disk and a side of the companion star and assuming isotropic emission, we can evaluate the fraction of the irradiation luminosity that will be intercepted and reprocessed by the disk and the companion star, respectively (as, e.g., in Burderi et al. 2003; Campana et al. 2004). For the accretion disk, the fraction of intercepted luminosity, , is given by the projected area of the disk as seen by the central source, (where is the disk outer radius and is the disk semi-thickness at ) divided by the total area, . Adopting a standard Shakura-Sunyaev (Shakura & Sunyaev 1973) disk model, in which the outer edge is truncated at 80% of the Roche lobe of the neutron star, the orbital period of hr, a Roche lobe-filling companion star of about 0.8 , we find . For the companion star the intercepted fraction can be written as , where is the orbital separation and the angle subtended by the companion star as seen from the central source. In the same hypothesis as above, we obtain .
Adopting an X-ray albedo of 0.85 and 0.93 for the companion star and the accretion disk, respectively (corresponding to an averaged X-ray albedo of , see e.g. van Paradijs 1996), this corresponds to similar luminosities of the irradiated face of the companion star and the irradiated disk, ergs/s, respectively. The corresponding reprocessed blackbody temperatures are estimated to be K for the companion star and K for the irradiated surface of the disk. From the two blackbodies of temperatures and and luminosities and , respectively, we have calculated the predicted apparent (incremented for the appropriate extinction correction towards Terzan 5, Cardelli et al. 1989; Valenti et al. 2007) magnitudes in three IR bands, , , and , which are , , and for the irradiated face of the companion star and , , and for the irradiated disk, respectively. Combining the magnitudes of the irradiated companion star and accretion disk, we estimate a magnitude of for the observed IR counterpart, which is compatible with the observed magnitude of our candidate. The largest uncertainty in our calculation of the irradiated luminosity is in the X-ray albedo. In principle, if in the future it were possible to disentangle the companion star and accretion disk reprocessed luminosities, it would be possible to put a constraint on the X-ray albedo of these two components of the system.
3.2 Which population for IGRJ17480?
In the 2003 observations, the optical companion must instead be close to its intrinsic luminosity. In principle, when accretion onto the neutron star is off, the neutron star should still emit energy according to the Larmor formula because it is a rotating magnetic dipole, and part of this energy can be intercepted and reprocessed by the companion star. Indeed, this mechanism has been invoked to explain the high optical luminosity of the companion star of the accreting millisecond pulsar SAX J1808.4-3658 in quiescence (Burderi et al. 2003; Campana et al. 2004), and see D’Avanzo et al. (2009) for similar studies on other sources of this class.
To estimate this effect in the case of IGR J17480-2446, we should start from the estimates of the neutron star magnetic field. Papitto et al. (2011) evaluate the magnetic field in the range between G to G, assuming that the inner disk radius lies between the neutron star radius and the corotation radius, while the source shows pulsations. Papitto et al. (2012) estimate the magnetic field in the range between G and G from the derived estimate of the NS spin up, which is Hz s-1, attained when the X-ray luminosity reached its peak value and assuming that the NS accretes the Keplerian angular momentum of matter at the inner disk boundary. These estimates agree with those given by Cavecchi et al. (2011), who estimate the magnetic field in the range G to G, using arguments similar to Papitto et al. (2011). Finally, Miller et al. (2011) use the results of a relativistic iron line fit to estimate the magnetic field at the poles to be G or G depending on the assumed value (1 or 0.5, respectively) of the conversion factor from spherical to disk accretion when balancing magnetic and ram pressures. In agreement with all these estimates, we consider an upper limit to the neutron star magnetic moment in this system of G cm3 and the spin frequency of the neutron star Hz.
With these values, the Larmor formula gives an emitted power of erg/s, resulting in a heating luminosity of erg/s, which is about times lower than the intrinsic bolometric luminosity of a 0.8 companion. We therefore conclude that, in the case of IGRJ17480, the optical luminosity in quiescence is truly representative of the intrinsic luminosity of the companion star.
We can now try to interpret the location of the companion close to, but bluer than, the turnoff of the cluster. We first recognize that, independent of how long ago the system was formed, the pulsar acceleration began a short time ago, and it is to be attributed to the evolution of the donor to larger radii. This recalls the evolutionary status of the system PSR J1740-5340 in NGC 6397, whose very fast radio millisecond pulsar was indeed accelerated when the companion began its evolution off-main sequence, as shown by the models presented in Burderi et al. (2002). In PSR J1740-5340 today the companion mass has been reduced to 0.4, whereas in IGRJ17480 we must be close to the beginning of a similar evolutionary path. The evolution – when irradiation is low – proceeds from the turnoff towards the red giant branch, so that we should expect that the donor star is in fact redder than the turnoff. Its bluer location might mean that it suffers a low illumination from the pulsar (see Fig. 1 in Burderi et al. 2002, left side evolution), but, as mentioned above, we find this explanation unlikely.
We now examine this problem from a different point of view, by using a detailed model for the Terzan 5 cluster. Recent observations of the color-magnitude diagram features and the chemistry of Terzan 5 constitute a benchmark in our understanding of GC formation. F09 show that the cluster clump (horizontal branch) stars are actually divided into two clumps separated by mag and that the more luminous stars have a much higher iron content () with respect to the lower HB (). This result shows that two well-separated populations are present in the cluster. Comparing the HB data to stellar isochrones of the correct metallicity, F09 conclude that the population with a higher metallicity must be 6 Gyr younger than the first generation. The presence of such a young population among bulge stars and clusters is not seen elsewhere (e.g. Feltzing & Gilmore 2000; Origlia et al. 2008), and D’Antona et al. (2010) propose instead to attribute the different clump luminosity to a much greater helium content present in the metal-rich population, consistent with models for the chemical evolution of the bulge (e.g. Renzini 1999).
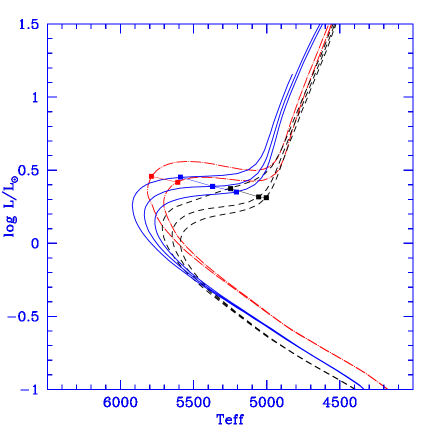
In Figure 4 we show isochrones from D’Antona et al. (2010), able to describe the two populations in Terzan 5 and the two different cases (age vs He-content difference between the two populations). We report, on the isochrones, the location of the evolving star when the evolving mass has a radius equal to the Roche lobe radius of IGRJ17480 in a system with orbital period P=21.274 hr. Despite the (small) mass loss that the donor must have suffered already, the theoretical location should still be close to the location of the donor of IGRJ17480. Since the observations show that the donor in quiescence lies at the blue edge of the turn-off locus, the comparison between the possible locations implies that either the donor belongs to the low-metallicity population (solid lines, blue in the color electronic version) and the second population is helium rich (dashed lines, black in the color version), or that it belongs to a younger second population (dot–dashed lines, red in the color version). Only in these two cases may we expect to find it at colors bluer than the turnoff location.
4 Summary and conclusions
In this work we present and discuss the likely detection and characterization of the near-IR counterpart to the X-ray pulsar IGRJ17480-2446. The analysis shows that the source is visible in quiescence both in near-IR and optical bands. Thanks to the precise identification of the optical counterpart, we were able to trace its location back in the color magnitude diagram to the previous epoch of quiescence. The relative location of the object with respect to the ridge line of the cluster turnoff offers us the intriguing possibility of attributing the object either to the first (low-metallicity) population, if the second population is also helium rich, or to the second one (high-metallicity), if it is much younger than the first one (Fig. 4). A fundamental test to determine which population IGRJ17480 belongs to would be to determine the metallicity, which seems currently out of reach with the present generation of telescopes and instruments available. Determining metallicity will allow to choose between the two scenarios (age or He-content difference) proposed to explain the different luminosities of the clump stars of these two populations.
Acknowledgements.
We gratefully acknowledge the excellent support and help from the ESO staff. AP acknowledges the support by the grants AYA2009-07391 and SGR2009-811, as well as the Formosa program TW2010005 and iLINK program 2011-0303.References
- Altamirano et al. (2010) Altamirano, D., Watts, A., Kalamkar, M., et al. 2010, The Astronomer’s Telegram, 2932, 1
- Barbuy et al. (1998) Barbuy, B., Bica, E., & Ortolani, S. 1998, A&A, 333, 117
- Bhattacharya & van den Heuvel (1991) Bhattacharya, D. & van den Heuvel, E. P. J. 1991, Phys. Rep, 203, 1
- Bordas et al. (2010) Bordas, P., Kuulkers, E., Alfonso-Garzón, J., et al. 2010, The Astronomer’s Telegram, 2919, 1
- Burderi et al. (2002) Burderi, L., D’Antona, F., & Burgay, M. 2002, ApJ, 574, 325
- Burderi et al. (2003) Burderi, L., Di Salvo, T., D’Antona, F., Robba, N. R., & Testa, V. 2003, A&A, 404, L43
- Campana et al. (2004) Campana, S., D’Avanzo, P., Casares, J., et al. 2004, ApJ, 614, L49
- Cardelli et al. (1989) Cardelli, J. A., Clayton, G. C., & Mathis, J. S. 1989, ApJ, 345, 245
- Carretta et al. (2009) Carretta, E., Bragaglia, A., Gratton, R. G., et al. 2009, A&A, 505, 117
- Cavecchi et al. (2011) Cavecchi, Y., Patruno, A., Haskell, B., et al. 2011, ApJ, 740, L8
- Cohn et al. (2002) Cohn, H. N., Lugger, P. M., Grindlay, J. E., & Edmonds, P. D. 2002, ApJ, 571, 818
- D’Antona et al. (2010) D’Antona, F., Ventura, P., Caloi, V., et al. 2010, ApJ, 715, L63
- D’Avanzo et al. (2009) D’Avanzo, P., Campana, S., Casares, J., et al. 2009, A&A, 508, 297
- Feltzing & Gilmore (2000) Feltzing, S. & Gilmore, G. 2000, A&A, 355, 949
- Ferraro et al. (2009) Ferraro, F. R., Dalessandro, E., Mucciarelli, A., et al. 2009, Nature, 462, 483
- Giles et al. (1999) Giles, A. B., Hill, K. M., & Greenhill, J. G. 1999, MNRAS, 304, 47
- Hessels et al. (2006) Hessels, J. W. T., Ransom, S. M., Stairs, I. H., et al. 2006, Science, 311, 1901
- Lanzoni et al. (2010) Lanzoni, B., Ferraro, F. R., Dalessandro, E., et al. 2010, ApJ, 717, 653
- Massari et al. (2012) Massari, D., Mucciarelli, A., Dalessandro, E., et al. 2012, ApJ, 755, L32
- Miller et al. (2011) Miller, J. M., Maitra, D., Cackett, E. M., Bhattacharyya, S., & Strohmayer, T. E. 2011, ApJ, 731, L7
- Motta et al. (2011) Motta, S., D’Aı, A., Papitto, A., et al. 2011, MNRAS, 414, 1508
- Origlia et al. (2008) Origlia, L., Lena, S., Diolaiti, E., et al. 2008, ApJ, 687, L79
- Ortolani et al. (2007) Ortolani, S., Barbuy, B., Bica, E., Zoccali, M., & Renzini, A. 2007, A&A, 470, 1043
- Paczyński (1971) Paczyński, B. 1971, Acta Astron., 21, 1
- Papitto et al. (2011) Papitto, A., D’Aì, A., Motta, S., et al. 2011, A&A, 526, L3
- Papitto et al. (2012) Papitto, A., Di Salvo, T., Burderi, L., et al. 2012, MNRAS, 2916
- Patruno et al. (2012) Patruno, A., Alpar, M. A., van der Klis, M., & van den Heuvel, E. P. J. 2012, ApJ, 752, 33
- Patruno & Milone (2012) Patruno, A. & Milone, A. P. 2012, The Astronomer’s Telegram, 3924, 1
- Piotto (2009) Piotto, G. 2009, in IAU Symposium, Vol. 258, IAU Symposium, ed. E. E. Mamajek, D. R. Soderblom, & R. F. G. Wyse, 233–244
- Pooley et al. (2010) Pooley, D., Homan, J., Heinke, C., et al. 2010, The Astronomer’s Telegram, 2974, 1
- Ransom et al. (2005) Ransom, S. M., Hessels, J. W. T., Stairs, I. H., et al. 2005, Science, 307, 892
- Renzini (1999) Renzini, A. 1999, Ap&SS, 267, 357
- Riggio et al. (2012) Riggio, A., Burderi, L., Di Salvo, T., et al. 2012, ApJ, 754, L11
- Shakura & Sunyaev (1973) Shakura, N. I. & Sunyaev, R. A. 1973, A&A, 24, 337
- Sirianni et al. (2005) Sirianni, M., Jee, M. J., Benítez, N., et al. 2005, PASP, 117, 1049
- Stetson (1987) Stetson, P. B. 1987, PASP, 99, 191
- Stetson (1994) Stetson, P. B. 1994, PASP, 106, 250
- Strohmayer & Markwardt (2010) Strohmayer, T. E. & Markwardt, C. B. 2010, The Astronomer’s Telegram, 2929, 1
- Strohmayer et al. (2010) Strohmayer, T. E., Markwardt, C. B., Pereira, D., & Smith, E. A. 2010, The Astronomer’s Telegram, 2946, 1
- Tody (1986) Tody, D. 1986, in Society of Photo-Optical Instrumentation Engineers (SPIE) Conference Series, Vol. 627, Society of Photo-Optical Instrumentation Engineers (SPIE) Conference Series, ed. D. L. Crawford, 733
- Tody (1993) Tody, D. 1993, in Astronomical Society of the Pacific Conference Series, Vol. 52, Astronomical Data Analysis Software and Systems II, ed. R. J. Hanisch, R. J. V. Brissenden, & J. Barnes, 173
- Valenti et al. (2007) Valenti, E., Ferraro, F. R., & Origlia, L. 2007, AJ, 133, 1287
- van Paradijs (1996) van Paradijs, J. 1996, ApJ, 464, L139
- Wang et al. (2001) Wang, Z., Chakrabarty, D., Roche, P., et al. 2001, ApJ, 563, L61
- Zacharias et al. (2010) Zacharias, N., Finch, C., Girard, T., et al. 2010, AJ, 139, 2184