IONIZATION SOURCE OF A MINOR-AXIS CLOUD IN THE OUTER HALO OF M82
Abstract
The M82 ‘cap’ is a gas cloud at a projected radius of 11.6 kpc along the minor axis of this well known superwind source. The cap has been detected in optical line emission and X-ray emission and therefore provides an important probe of the wind energetics. In order to investigate the ionization source of the cap, we observed it with the Kyoto3DII Fabry-Perot instrument mounted on the Subaru Telescope. Deep continuum, H, [N II]6583/H, and [S II]6716,6731/H maps were obtained with sub-arcsecond resolution. The superior spatial resolution compared to earlier studies reveals a number of bright H emitting clouds within the cap. The emission line widths ( km s-1 FWHM) and line ratios in the newly identified knots are most reasonably explained by slow to moderate shocks velocities ( = 40–80 km s-1) driven by a fast wind into dense clouds. The momentum input from the M82 nuclear starburst region is enough to produce the observed shock. Consequently, earlier claims of photoionization by the central starburst are ruled out because they cannot explain the observed fluxes of the densest knots unless the UV escape fraction is very high ( 60%), i.e., an order of magnitude higher than observed in dwarf galaxies to date. Using these results, we discuss the evolutionary history of the M82 superwind. Future UV/X-ray surveys are expected to confirm that the temperature of the gas is consistent with our moderate shock model.
Subject headings:
galaxies: individual (M82) — intergalactic medium — galaxies: ISM — galaxies: starburst1. INTRODUCTION
Superwinds are galaxy scale outflows, caused by supernovae in nuclear starburst regions or active galactic nuclei (AGNs). They are so powerful that interstellar matter within the galaxies is blown out. Some of the material may escape to the intergalactic or group medium, while some of the material may be recycled throughout the galactic halo (Cooper et al., 2008). Superwinds are expected to quench star-formation activity (feedback) and to enrich the external medium with new metals. Generally, galactic winds are diffuse and difficult to observe. M82, one of the nearest starburst galaxies (3.63 Mpc, Freedman et al., 1994), is one of the most well known examples of the superwind phenomenon. Its large inclination angle ( 80∘: Lynds & Sandage, 1963; McKeith et al., 1995) and proximity allow us to see many details of the wind phenomenon far from the galactic plane. The source has been observed in hot gas ( K; e.g., Cappi et al. 1999), ionized gas ( K; e.g., McCarthy et al. 1987; Bland & Tully 1988), and molecular gas ( K; e.g., Nakai et al. 1987; Walter et al. 2002).
The kinematics and ionization of the wind material over the inner few kiloparsecs have been investigated in detail. McKeith et al. (1995) and Shopbell & Bland-Hawthorn (1998) modeled the outflow structure using position-velocity diagrams in optical emission lines. The emission line ratios of the inner region indicate that photoionization by the nuclear starburst plays a significant role in the excitation (McCarthy et al., 1987; Shopbell & Bland-Hawthorn, 1998). In recent years, new observational methods such as integral field spectroscopy (e.g., Westmoquette et al. 2009a, b) and spectropolarimetry (e.g., Yoshida et al. 2011) have revealed its more intricate structure.
Our goal is to shed light on processes behind large-scale galactic winds. Very little is known about their total extent, energetics and importance in the context of galaxy evolution. By studying the most spatially extended emission, we can obtain a better understanding of the total kinetic energy of the wind. There are many questions that remain unanswered for M82’s outflow. How old is the wind and how far does it extend? Is it powered by radiation pressure or wind pressure, or a combination of both? Is the source of energy impulsive or sustained over many dynamical times? Is most of the outflowing material swept up or entrained from the disk? Does the wind material escape the galaxy or fall back to the disk? To have any chance of answering these questions, we need a better understanding of the most basic properties of the large-scale wind.
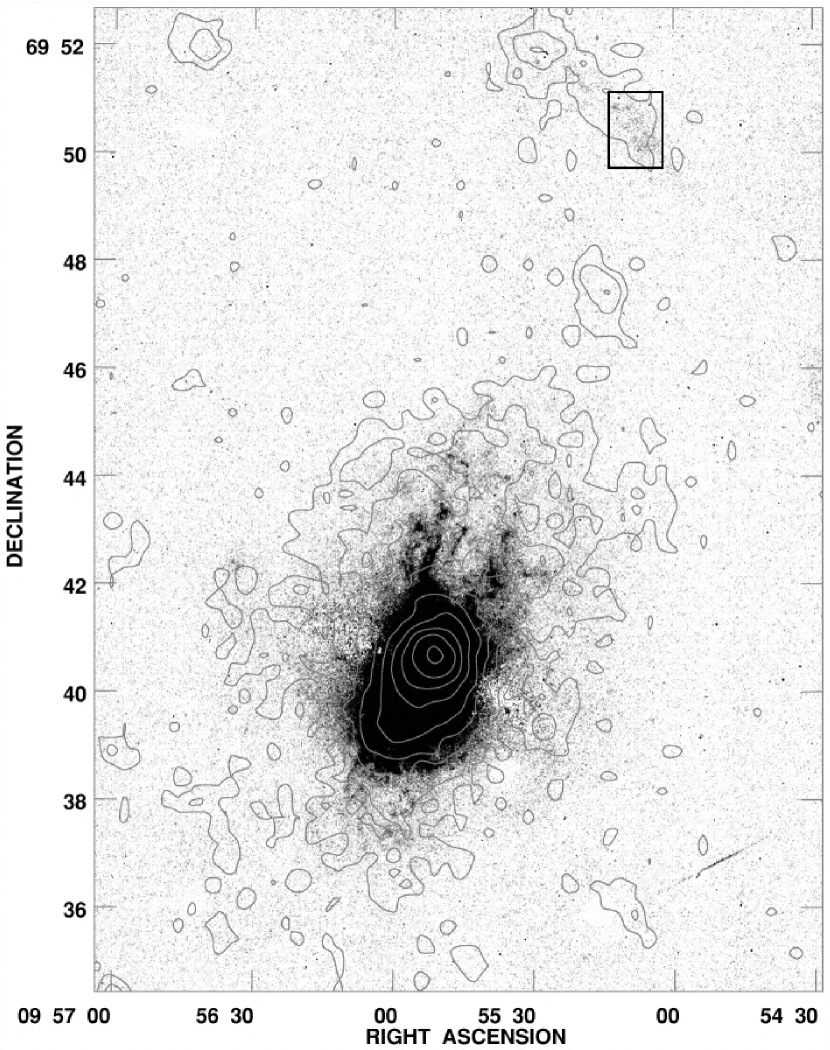
The most distant gas cloud in M82 is the ‘cap’ originally discovered in H and X-ray emission at a radius of 11.6 kpc along the minor axis of M82 (Devine & Bally, 1999; Lehnert et al., 1999). Strong UV emission provides evidence for reflecting dust in the cloudlets that make up the cap (Hoopes et al., 2005). The metal abundances of O, Ne, Mg, Si, and Fe of X-ray emitting gas in the cap suggest that most of the metals arise from a circumnuclear starburst dominated by Type II supernovae (Tsuru et al., 2007).
We now show that the dominant ionization source in the cap provides an important clue to the wind’s origin and history. Lehnert et al. (1999) suggested the cap is either photoionized by UV photons from the nuclear starburst region or by a shock being driven by the hot wind into a dense halo cloud, or a combination of both. The X-ray observations already support the idea that the wind reaches the distance of the cap, but are the optical emission line diagnostics consistent with a wind-driven shock?
Therefore, in order to obtain emission line intensity map and line ratio maps at high spatial resolution, we carried out Fabry-Perot observations of M82’s cap with the Subaru Telescope. This combination enables us to detect weak emission with a larger field of view than that of integral field spectroscopy. Through a comparison of the observed line ratios and those calculated by photoionization and shock models, we discuss the ionization source of the M82 cap and a likely evolution history for the large-scale galactic wind.
2. OBSERVATIONS AND DATA REDUCTION
On 2011 November 22, we observed the central part of the M82 cap, 10′ N of the nucleus of M82, with the Kyoto3DII Fabry-Perot mode (Sugai et al., 2010) mounted on the Cassegrain focus of the Subaru Telescope. Figure 1 displays the position of the cap relative to the M82 center, and indicates the region where we observed in this observation. This mode uses an ET-50 etalon manufactured by Queensgate Instruments. The field of view is 1′.9 and the pixel scale is 0″.112 pixel-1 after 2 2 on-chip binning. The spectral resolution corresponds to 19 Å at 6598.95Å. We obtained 14 object frames for H + [N II]6548,6583, five for [S II]6716,6731, and two for the off bands.
The observed wavelengths at the field centres are summarized in Table 1. The exposure time for each frame was 300 seconds. We also observed a standard star EGGR247 for flux calibration (Bland-Hawthorn, 1995). Bias subtraction and flat fielding were performed for the target and standard star frames. Because the center wavelength in Fabry-Perot observations depends on the distance from the center of the field of view, simple sky subtraction results in some residuals due to sky emission lines. We measured sky emission fluxes in blank regions of the object frames, and subtracted it from the regions at the same distance from the center. Flux calibration and distortion correction were carried out for the target frames. We used a spectrum catalog of Oke (1990) for flux calibration for each wavelength setting. The positional offsets among the object frames were detected, because the Cassegrain auto guider was unavailable due to repairs and we did not use it in this observation run. We corrected the offsets by using the stars in the target frames. We matched the spatial resolution of the target frames to the worst one, 0″.9, and carried out 4 4 binning, resulting in the pixel scale of 0″.45 pixel-1.
| band | wavelength [Å] |
|---|---|
| H + [N II]6548,6583 | 6546, 6554aaTwo exposures were performed at these wavelengths., 6562aaTwo exposures were performed at these wavelengths., 6570aaTwo exposures were performed at these wavelengths., 6578aaTwo exposures were performed at these wavelengths., 6586aaTwo exposures were performed at these wavelengths., 6594aaTwo exposures were performed at these wavelengths., 6602 |
| [S II]6716,6731 | 6714, 6722, 6730, 6738, 6746 |
| continuum | 6656aaTwo exposures were performed at these wavelengths. |
Note. — These are the observed wavelengths at the center of our field of view.
Because of the relatively low spectral resolution, H and [N II]6548,6583 were blended in H+[N II] band. We fitted these lines pixel by pixel with the transmission curve of the Fabry-Perot interferometer (Airy function: Bland & Tully, 1989) and decomposed them (see Matsubayashi et al. 2009). Better wavelength sampling than that of the previous observation enables us to find the best velocity center. We fitted the emission line fluxes at each velocity, from 100 km s-1 to 700 km s-1, and selected the velocity for which the fitting residual is the smallest. For line decomposition, we assumed that the [N II]6548 flux is one-third of [N II]6583 flux, and that the velocity centers of H and [N II]6548,6583 are same.
The velocity dispersion is fixed to 0 km s-1 because it is much smaller than the spectral resolution of the instrument. This assumption is reasonable, since the observed velocity dispersion of H at the cap is small (100 km s-1; Devine & Bally 1999). The same fitting was performed for the [S II] band data. However, the [S II]6716/[S II]6731 cannot be determined well, because the wavelength difference between these two lines is smaller than the spectral resolution in this observation. Therefore we only use the total flux of [S II]6716,6731 in this study. Our 1 detection limit in H surface brightness is estimated to be 6.5 10-18 erg cm-2 s-1 arcsec-2 or an emission measure of roughly 1 Rayleigh (3.3 cm-6 pc) at a temperature of 104 K. We adopt a distance of 3.63 Mpc to M82 (Freedman et al., 1994).
3. RESULTS
Figure 2 (a) displays the continuum surface brightness map of the central part of the M82 cap. Only stars in the Galaxy and distant galaxies are detected. The number counts are consistent with the freely available GalaxyCount program which provides source statistics for any window function down to 28 AB mag (Ellis & Bland-Hawthorn, 2007). The relative positions of objects in our image coincide with those of Devine & Bally (1999) and SDSS DR7 (Abazajian et al., 2009). In contrast, we cannot detect continuum emission from the cap. The upper limit in surface brightness at 6656 Å is 23.7 mag arcsec-2 (AB, 5), which corresponds to stellar mass of approximately 3 107 using the cap size as 0.5 kpc2 and mass-to-luminosity ratio at solar metallicity, star-formation history of SSP, and an age of 1 Gyr estimated from the Bruzual & Charlot (2003) model. This fact indicates that the cap is not a dwarf galaxy (Lehnert et al., 1999).
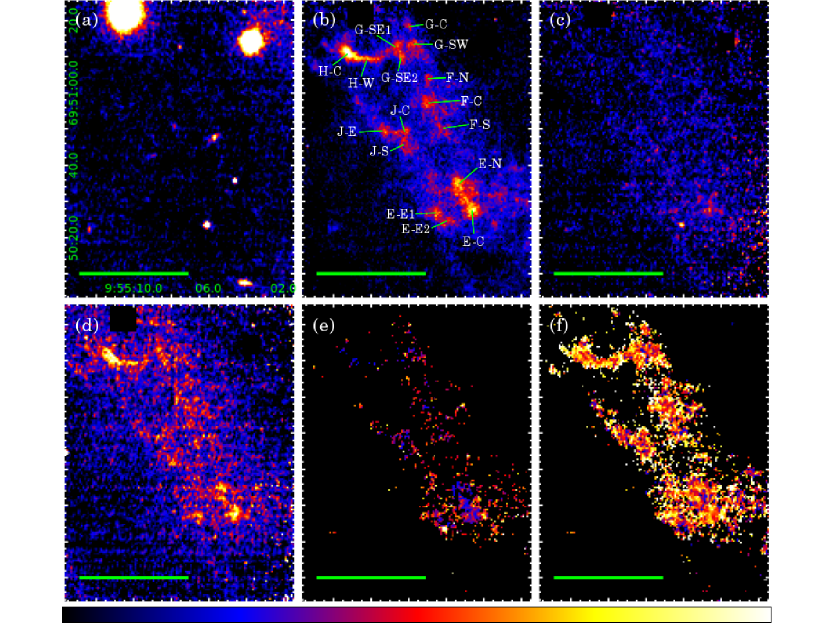
In the H intensity map (Figure 2 (b)), clumpy and filamentary structures in the cap are clearly detected. Our H map is roughly consistent with that of Devine & Bally (1999), but bright knots C and D identified by them are not confirmed in our H image; instead these are detected in our continuum image. The H image of Devine & Bally (1999) is clearly contaminated by continuum emission. Knots C and D are not related to the cap, and appear to be more distant disk galaxies. Our high resolution (= 0″.9) H map enables us to resolve some bright H knots. The typical size of H knots is 5″–10″, which corresponds to 90–180 pc at the distance of M82.
We renamed the H knots after Devine & Bally (1999), as shown in the H image (Figure 2 (b)). The H flux and luminosity of the brightest knot H-C in 5″ 5″ aperture are 1.7 10-15 erg cm-2 s-1 and 2.8 1036 erg s-1, respectively. The electron density and mass of the brightest knot H-C are estimated as 1.0 cm-3 and 9 10, respectively, where indicates the filling factor of the knot. They are estimated from its H luminosity, size (5″ = 90 pc), and the H recombination rate = 8.7 10-14 cm3 s-1 (Osterbrock & Ferland, 2006), with the assumption of spherical symmetry and a completely ionized gas. The observed H flux at each knot is displayed in Table 2. The total H flux of the cap region in our field of view is 7.3 10-14 erg cm-2 s-1. This flux is about half of that estimated by Devine & Bally (1999) and Lehnert et al. (1999) (1.3 10-13 erg cm-2 s-1) consistent with the fact that about half of the cap region falls within our field of view.
| Knot ID | H flux | [N II]6583/H | [S II]6716,6731/H |
|---|---|---|---|
| (10-16 erg cm-2 s-1) | |||
| E-C | 4.3 0.1 | 0.34 0.03 | 0.63 0.06 |
| E-N | 4.0 0.1 | 0.22 0.03 | 0.60 0.06 |
| E-E1 | 3.3 0.1 | 0.32 0.04 | 0.63 0.08 |
| E-E2 | 2.8 0.1 | 0.27 0.04 | 0.45 0.08 |
| F-C | 3.2 0.1 | 0.18 0.03 | 0.55 0.07 |
| F-N | 2.6 0.1 | 0.20 0.04 | 0.60 0.09 |
| F-S | 2.5 0.1 | 0.20 0.05 | 0.55 0.08 |
| G-C | 2.3 0.1 | 0.21 0.05 | 0.56 0.10 |
| G-SE1 | 3.1 0.1 | 0.11 | 0.63 0.08 |
| G-SE2 | 3.1 0.1 | 0.12 0.04 | 0.62 0.08 |
| G-SW | 2.9 0.1 | 0.18 0.04 | 0.52 0.08 |
| H-C | 5.7 0.1 | 0.06 | 0.55 0.04 |
| H-W | 3.3 0.1 | 0.10 | 0.66 0.07 |
| J-C | 2.8 0.1 | 0.24 0.04 | 0.55 0.09 |
| J-E | 2.9 0.1 | 0.12 | 0.46 0.07 |
| J-S | 2.6 0.1 | 0.17 0.04 | 0.50 0.08 |
Note. — The aperture sizes are 2″.25 2″.25. Uncertainties are in 1 levels, while upper limits are in 3 .
Figures 2 (c), (d), (e), and (f) displays [N II]6583 intensity, [S II]6716,6731 intensity, [N II]/H ratio, and [S II]/H ratio maps of a part of the M82 cap, respectively. The [S II] flux map is generally similar to the H map. All counterparts of H knots are also found in the [S II] map. [S II]/H flux ratios are almost constant among these knots, 0.45–0.66. The [N II] flux map is quite different from the H flux map. Knots E-C and E-E are clearly detected in [N II], but the counterparts of the other knots, even the H brightest knot H-C, are barely detected. The observed [N II]/H flux ratios of knots E-C and E-E1 are the largest and peak at 0.33. [N II]/H and [S II]/H line ratios at these knots are summarized in Table 2 and plotted in Figure 3. Small [N II]/H and [S II]/H ratios are consistent with the previous result of non-detection of forbidden lines at the cap (Devine & Bally, 1999). We do not find correlations between the H flux, [N II]/H and [S II]/H ratios.
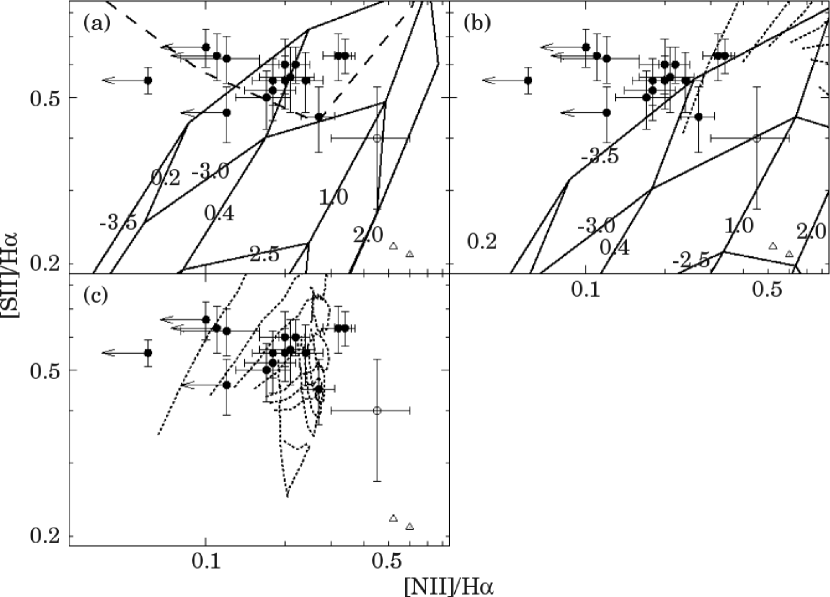
We compare the [N II]/H and [S II]/H ratios of the cap with those at other regions in M82. The emission line ratios at a radius of 1 kpc from M82’s center (Shopbell & Bland-Hawthorn, 1998; Yoshida et al., 2011), and in the circumnuclear regions (O’Connell & Mangano, 1978; Smith et al., 2006), are also plotted in Figure 3. We find an interesting trend of the line ratios with galactic radius. The [N II]/H ratio tends to decrease, while the [S II]/H ratio tends to increase with distance from the M82 nucleus. This fact suggests that some parameters, such as metallicity and shock velocity, gradually change, if the ionization source is the same in these regions. In Figure 3, the line ratios of the M82 starburst regions and the cap are significantly different. Therefore, dust reflection of the M82 starburst regions, suggested by strong UV emission (Hoopes et al., 2005), is not the dominant emission mechanism in optical wavelength.
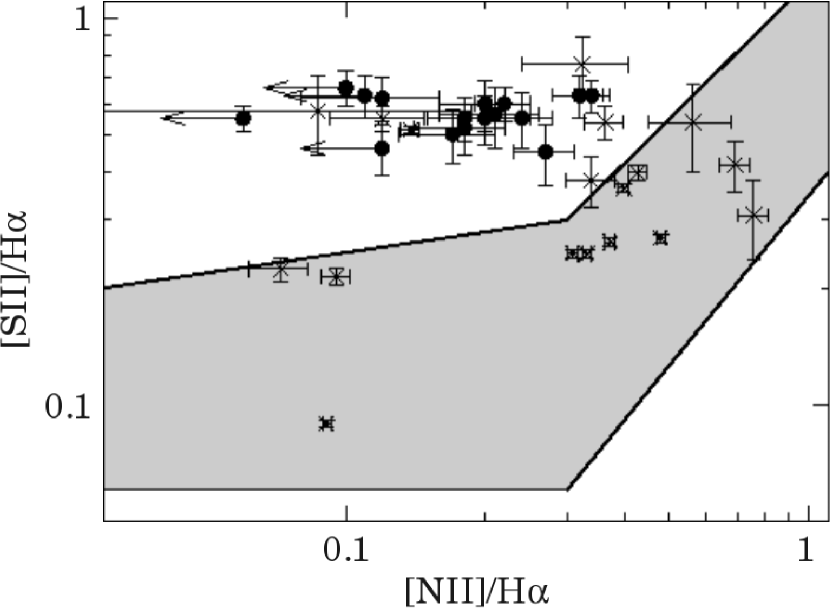
Figure 4 compares the observed [N II]/H and [S II]/H ratios of the M82 cap with those of H II regions (Jansen et al., 2000), blue compact galaxies (Kong et al., 2002), LINERs (Ho et al., 1997), and very extended ionized gas (EIG) in the Coma cluster (Yoshida et al., 2012). We find that the line ratios of the M82 cap are similar to those of some EIG knots which have larger [S II]/H ratios than the main sequence of star-forming galaxies. This fact suggests that the emission line ratios of the M82 cap are not peculiar, and that the M82 cap and EIGs in the Coma cluster are ionized by the same mechanism.
4. DISCUSSION
First we discuss the dominant ionization source of the M82 cap. The observed [N II]/H and [S II]/H line ratios fall within the range of star-forming galaxies (e.g., Liang et al. 2006) and diffuse ionized gas (e.g., Moustakas & Kennicutt 2006). The ionization source of star-forming galaxies is UV photons from massive stars (e.g., Kewley et al. 2001), whereas there are some possible sources for diffuse ionized gas and EIG, such as photoionization, shock (e.g., Allen et al. 2008), and turbulent mixing layers (e.g., Slavin et al. 1993). In the case of turbulent mixing layers, the H emitting ionized gas should exist at the boundary of the hot gas, but they appear to be spatially coincident; thus, we rule out this model. In order to reveal the ionization source of the cap, we compare the observed line ratios with theoretical values for photoionization and shock models.
4.1. Photoionization
Photoionization of the cap by the M82 nuclear starburst region was suggested by Lehnert et al. (1999). They calculated the number of ionizing photons at the cap region, and found that there are enough ionizing photons relative to that estimated from H luminosity. This model assumes that ionizing photons are not strongly absorbed or scattered by interstellar matter between the M82 starburst regions and the cap region, presumably because the wind phenomenon has cleared the sight line of obscuring matter.
The observed [N II]/H and [S II]/H ratios (Table 2) are similar to those of H II galaxies (e.g. Liang et al. 2006), and the observed ratios do not exceed the maximum starburst line defined by Kewley et al. (2001), unless the [O III]5007/H ratio is larger than 3. But the observed [S II]/H ratio is roughly equal to the largest value of 40,000 SDSS star-forming galaxies (Liang et al., 2006) making UV photoionization less probable.
In order to clarify whether photoionization can produce the observed larger [S II]/H ratios, we calculated emission line ratios with a Cloudy photoionization model (Ferland et al., 1998). We used two electron densities for the calculation: 1 cm-3 for the cap, and 2000 cm-3 for the M82 center (O’Connell & Mangano, 1978; Smith et al., 2006). Due to its secondary nature, we assume that the nitrogen abundance scales with metallicity () as and that the stellar metallicity () is the same as (see Nagao et al. 2011). The SED of the stars is taken from Leitherer et al. (1999).
Figure 3 (a) indicates that most of the observed line ratios at the M82 cap are reproduced by the photoionization model of ionization parameter = 10-3.5–10-3.0 and metallicity 0.4 . represents the dimensionless ratio of the ionizing photon density to the electron density. To constrain the ionization parameter of the M82 cap, we follow the Lehnert et al. (1999) condition: the dimension of 3.7 3.7 kpc2, electron density of 4.3 10 cm-3, where indicates the filling factor of ionized gas averaged over the whole M82 cap, and the number of ionizing photons at the cap of 2 1050 photon s-1. The calculated ionization parameter is consistent with that estimated from emission line ratios, if we assume . The larger distance from the ionization source than for typical H II regions leads to smaller ionization parameter and larger [S II]/H ratios.
The number of the ionizing photons which each knot receives is almost the same, and the ionization parameter depends on the knot electron density only. The calculated line ratios whose electron densities are smaller than 10 cm-3 are almost the same. For these reasons, we can consider that the difference in line ratios among the knots in the cap is explained by the difference in the electron density and/or metallicity, as seen in Figure 3 (a). Although the lower density model cannot reproduce the ratios at the central regions, log = and = 2.0 of the higher density model fits the observed ratios (Figure 3 (b)).
However, taking account of the escape fraction of ionizing photons, we find that this picture cannot be correct. Lehnert et al. (1999) uses H surface brightness averaged over the projected length of the M82 cap for the calculation of the escape fraction of ionizing photons. Since the required escape fraction is only 3 %, they considered that the M82 starburst regions can provide enough ionizing photons for the M82 cap. Meanwhile, our high resolution image reveals that M82 cap is patchy and its filling factor is much smaller than 1 (Figure 2 (b)). This means that the H surface brightness of the brightest knot H-C must be explained by the ionizing photon flux from the M82 starburst region. Knot H-C is smaller and denser than the whole M82 cap, and therefore much larger escape fraction is required. We estimate the required escape fraction of ionizing photons from the M82 starburst regions. We assume that the knots are spherical symmetric (Figure 2). Then we can use the same calculation method as Bland-Hawthorn & Maloney (1999, 2002). The H surface brightness of knot H-C is 1 10-16 erg cm-2 s-1 arcsec-2 in 2″.25 2″.25 aperture (Table 2).
Since the surface brightness of 6 10-18 erg cm-2 s-1 arcsec-2 corresponds to 1 Rayleigh at the H wavelength, the H emission measure of the knot H-C is 16.5 Rayleigh. The required number of ionizing photons is 3.7 107 cm-2 s-1 at the distance of M82, using the H recombination rate = 8.7 10-14 cm3 s-1 (Osterbrock & Ferland, 2006). Whereas the ionizing photon flux from the nuclear starburst region is 1054 photons s-1 (McLeod et al., 1993), and 6 107 cm-2 s-1 at the distance of knot H-C from the M82 nuclear starburst region. Thus the required escape fraction for knot H-C is 60 %. This escape fraction is an order of magnitude larger than what has been measured in the Galaxy (6 %: Bland-Hawthorn & Maloney 1999) and dwarfs to date (3 %: Zastrow et al. 2011; Barger et al. 2012). In passing, we note that 3D simulations of UV radiative transfer in superwinds indicate that higher values are possible in extreme cases (Yajima et al., 2009). Thus, it is quite unlikely that the M82 cap clouds are ionized by photons from the M82 starburst regions. We consider shock ionization to be a more likely explanation, as we discuss in the next section.
4.2. Shock ionization
In order to explain the H emission in the cap, Lehnert et al. (1999) first suggested that the M82 superwind can drive a shock into the underlying gas cloud. The gas metallicity, which is presently unknown, is likely to fall in the range 0.1–1 depending on whether the gas is infalling or entrained with the wind flow. The threshold metallicity for infalling gas at the present epoch appears to be close to 0.1 in all observations of the Local Universe to date (Ryan-Weber et al., 2009). We regard this value as a lower limit because the outer H I envelope in the M81 group appears to be material stripped from the outer disk of one or more galaxies (Chynoweth & Langston, 2007). The cap is unlikely to be entrained gas from the disk because dense material is broken up very quickly by Rayleigh-Taylor instabilities (Cooper et al., 2009), as observed in the wind filaments close to the disk.
We compare the observed line ratios with those calculated from a fast shock model ( 200 km s-1) of Allen et al. (2008). The [N II]/H ratios in the shock model are larger than 0.3, while the observed values are mostly less than 0.3 (Figure 3 (b)). But this may reflect the lower expected metallicity in the cap. Fast shocks in a low metallicity gas may be able to explain the observed [N II]/H ratios. The computed [N II]/H ratios fall in the range 0.1 to 0.3, which is similar to the observed values. But if fast shock excitation is dominant, the observed [N II]/H ratios should correlate with [S II]/H, because both ratios increase in lock step with an increase in shock velocity (Figure 3 (c)); however, no such correlation between these ratios is found. A more compelling argument against fast shocks is the kinematically ‘cold’ line emission observed across the ‘cap’ region, an issue we return to below. Thus fast shocks are unlikely to be the dominant ionization source of the cap today.
Next we compare the observed ratios with those calculated from slow to intermediate shock models, i.e., 40 km s 130 km s-1, given by Shull & McKee (1979) (Figure 3 (a)). In this shock velocity range, [N II]/H ratios increase as shock velocity increases, while [S II]/H ratios neither increase nor decrease monotonically. In Figure 3 (a), the observed points at the cap knots are distributed along the line of slow shock model. The calculated [N II]/H and [S II]/H ratios are 0.10 and 0.58 at = 60 km s-1, and 0.27 and 0.44 at = 80 km s-1, respectively. Therefore, shock velocities of 60 km s-1 and 80 km s-1 can also explain the observed [N II]/H and [S II]/H ratios. Model comparisons for shock velocities higher than 80 km s-1 are ruled out.
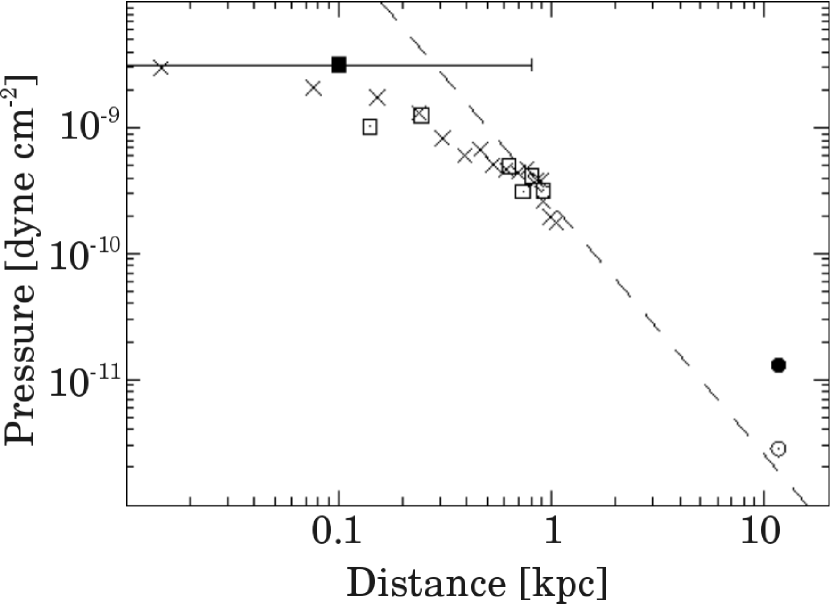
The superwind is powered by kinetic energy from some combination of stellar winds, radiation pressure and supernovae in the M82 starburst region. Here we examine whether the momentum is enough to produce the observed shock. We compare the inferred range of shock velocities (40–80 km s-1) with the superwind velocity of a spherically-symmetric model for M82 by Chevalier & Clegg (1985). Their model fits well with the observed thermal pressure profile of M82 within 1 kpc, and the pressure profiles at the larger radii than 0.5 kpc are consistent with the dependence expected for ram pressure (Heckman et al., 1990). Using their model, the gas density, wind velocity, and ram pressure at the distance of M82 cap are estimated as 4 10-6 cm-3, 5600 km s-1, and 2.1 10-12 dyne cm-2, respectively. Since the observed electron density is 1.0 cm-3 at the knot H-C, the thermal pressure of ionized gas is calculated as dyne cm-2 with the assumption of K. This indicates that the model ram pressure and the observed thermal pressure are well balanced, and the observed pressure follows law even at the distance of the M82 cap, 11.6 kpc (Figure 5). Furthermore, given that some of the shock motion is expected to generate local turbulent motions of the same order (Bland-Hawthorn et al., 2007), the measured narrow emission line widths ( km s-1 FWHM, Devine & Bally 1999) are consistent with a slow shock. Therefore, it is quite likely that the cap clouds are ionized by a slow shock produced by the M82 superwind.
Future deep observations of the M82 cap, e.g., [O I]6300, will enable us to directly confirm its dominant ionization source. In the case of a slow shock, the [O I]/H ratio larger than 0.1 is to be expected (Shull & McKee, 1979), while a smaller ratio is evidence for photoionization by massive stars (e.g., Kewley et al. 2001).
4.3. Hot gas heating
Diffuse X-ray emission was detected at the M82 cap (Devine & Bally, 1999; Lehnert et al., 1999; Tsuru et al., 2007). The electron density, temperature, and thermal pressure of hot gas are cm-3, 9 K, and 1.3 dyne cm-2, respectively, where is the filling factor of hot gas. However, a slow shock is not the main heating mechanism, because these can only heat to K. Additionally, thermal pressures of ionized and hot gas are inconsistent at the M82 cap, though they are consistent at the M82 center (Heckman et al., 1990; Strickland & Heckman, 2007). Hence, another heating source for hot gas is required.
A reasonable explanation for the hot gas is found when considering a 2-component shock model. An H I cloud in isolation develops a core-halo structure where the core is dense and the halo is relatively diffuse (Field, 1965; Sternberg et al., 2002). In this interpretation, the X-ray emission is produced by the superwind triggering a shock in the diffuse gas surrounding the knots in the cap (see Lehnert et al. 1999). To produce gas with K requires a fast shock whose shock velocity is 820 km s-1. But the 2-component shock by the same superwind cannot explain the discrepancy between the thermal pressures of these gas phases.
A 2-component shock by different superwinds from the M82 starburst region may be the case for the M82 cap. In this model, the slow shock by the present superwind ionizes the cap clouds, while hot gas observed today was produced by a fast shock driven by a past superwind outburst. What is important is that the cooling timescales of these gas phases are drastically different: yr and yr for ionized and hot gas, respectively (Osterbrock & Ferland, 2006; Lehnert et al., 1999). The history of this model is as follows: yrs ago, a fast shock driven by a past superwind produced hot ionized gas; after yrs, the ionized gas cooled while the hot gas continued to emit X-rays, and now the slow shock ionizes the cap clouds again to produce the H and X-ray emission from the cap.
5. Concluding Remarks
It is undoubtedly true that the physics of superwinds is complicated. However, we are able to deduce some basic properties of the wind. As discussed by Sharp & Bland-Hawthorn (2010), there is a well determined series of events that lead to a superwind taking hold. We believe that the new observations support the developing paradigm.
When a critical surface density of dense molecular clouds is reached in the galaxy, massive stars are born. These stars evolve rapidly and their strong UV radiation fields produce a warm gaseous medium that encircles the remaining molecular clouds. After a few million years, the cores of the most massive stars collapse leading to multiple supernova explosions. This huge impulse of mechanical energy heats the diffuse medium to extremely high temperatures (K) where it expands to form a powerful superwind. (If the mechanical energy or UV radiative energy were entirely absorbed by the dense gas, most of the energy would simply be re-radiated as IR emission.) The hot flowing gas entrains cooler gas from the disk with the flow; we know this because of well defined rotation of the entrained filaments about the wind axis (Greve, 2004). The entrained gas is very clumpy because it is mostly entrained from the surviving dense clouds in the disk (Cooper et al., 2008).
M82 is engulfed by a large H I cloud complex and some of this material appears to be accreting onto the dwarf close to the minor axis (Chynoweth & Langston, 2007). The cap material is almost certainly supplied by infalling gas. The cap ionization almost certainly arises from the expanding superwind interacting with infalling gas. The spatial coincidence of the H and X-ray emission may be explained with the model of a 2-component shock by different M82 superwinds. Further constraints on the cap may come from UV absorption line spectroscopy using distant quasars as a background light source. The expected warm-hot medium should be visible in low to intermediate ionization states of C, N, O, Ne and Fe, even for gas in a non-equilibrium state (Gnat & Sternberg, 2004). Our new highly resolved observations show that the cap is very clumpy presumably as a consequence of the wind-cloud interaction. Our expectation is that the cap will be disrupted in a shock crossing time of about Myr.
The fact that the outer cap is presently ionized by local shocks, and not by nuclear UV radiation, supports the findings of Sharp & Bland-Hawthorn (2010). Unlike AGN-driven wind filaments which are all found to be ionized by nuclear UV radiation, the starburst wind filaments are ionized by local shocks far from the nucleus. This is easily understood in terms of a ‘starburst’ because the hot young stars must evolve to supernovae before the wind gets going, and therefore few remain to ionize gas clouds in the direction of the flow. We fully anticipate that future deep optical, UV and X-ray imaging and spectroscopy will reveal further details about the cap region, and in turn about the nature of the superwind in M82.
References
- Abazajian et al. (2009) Abazajian, K. N., Adelman-McCarthy, J. K., Agüeros, M. A., et al. 2009, ApJS, 182, 543
- Allen et al. (2008) Allen, M. G., Groves, B. A., Dopita, M. A., Sutherland, R. S., & Kewley, L. J. 2008, ApJS, 178, 20
- Barger et al. (2012) Barger, A, Haffner, M & Bland-Hawthorn, J. 2012, AJ, in press
- Bland & Tully (1988) Bland, J., & Tully, R. B. 1988, Nature, 334, 43
- Bland & Tully (1989) Bland, J., & Tully, R. B. 1989, AJ, 98, 723
- Bland-Hawthorn (1995) Bland-Hawthorn, J. 1995, IAU Colloq. 149: Tridimensional Optical Spectroscopic Methods in Astrophysics, 71, 72
- Bland-Hawthorn & Maloney (1999) Bland-Hawthorn, J., & Maloney, P. R. 1999, ApJ, 510, L33
- Bland-Hawthorn & Maloney (2002) Bland-Hawthorn, J., & Maloney, P. R. 2002, Extragalactic Gas at Low Redshift, 254, 267
- Bland-Hawthorn et al. (2007) Bland-Hawthorn, J., Sutherland, R., Agertz, O., & Moore, B. 2007, ApJ, 670, L109
- Bruzual & Charlot (2003) Bruzual, G., & Charlot, S. 2003, MNRAS, 344, 1000
- Cappi et al. (1999) Cappi, M., Persic, M., Bassani, L., et al. 1999, A&A, 350, 777
- Chevalier & Clegg (1985) Chevalier, R. A., & Clegg, A. W. 1985, Nature, 317, 44
- Chynoweth & Langston (2007) Chynoweth, K. M., & Langston, G. 2007, Bulletin of the American Astronomical Society, 39, 905
- Cooper et al. (2008) Cooper, J. L., Bicknell, G. V., Sutherland, R. S., & Bland-Hawthorn, J. 2008, ApJ, 674, 157
- Cooper et al. (2009) Cooper, J. L., Bicknell, G. V., Sutherland, R. S., & Bland-Hawthorn, J. 2009, ApJ, 703, 330
- Devine & Bally (1999) Devine, D., & Bally, J. 1999, ApJ, 510, 197
- Ellis & Bland-Hawthorn (2007) Ellis, S. C., & Bland-Hawthorn, J. 2007, MNRAS, 377, 815
- Ferland et al. (1998) Ferland, G. J., Korista, K. T., Verner, D. A., et al. 1998, PASP, 110, 761
- Field (1965) Field, G. B. 1965, ApJ, 142, 531
- Freedman et al. (1994) Freedman, W. L., Hughes, S. M., Madore, B. F., et al. 1994, ApJ, 427, 628
- Gnat & Sternberg (2004) Gnat, O., & Sternberg, A. 2004, ApJ, 608, 229
- Greve (2004) Greve, A. 2004, A&A, 416, 67
- Ho et al. (1997) Ho, L. C., Filippenko, A. V., Sargent, W. L. W., & Peng, C. Y. 1997, ApJS, 112, 391
- Heckman et al. (1990) Heckman, T. M., Armus, L., & Miley, G. K. 1990, ApJS, 74, 833
- Hoopes et al. (2005) Hoopes, C. G., Heckman, T. M., Strickland, D. K., et al. 2005, ApJ, 619, L99
- Jansen et al. (2000) Jansen, R. A., Fabricant, D., Franx, M., & Caldwell, N. 2000, ApJS, 126, 331
- Kewley et al. (2001) Kewley, L. J., Dopita, M. A., Sutherland, R. S., Heisler, C. A., & Trevena, J. 2001, ApJ, 556, 121
- Kong et al. (2002) Kong, X., Cheng, F. Z., Weiss, A., & Charlot, S. 2002, A&A, 396, 503
- Lehnert et al. (1999) Lehnert, M. D., Heckman, T. M., & Weaver, K. A. 1999, ApJ, 523, 575
- Leitherer et al. (1999) Leitherer, C., Schaerer, D., Goldader, J. D., et al. 1999, ApJS, 123, 3
- Liang et al. (2006) Liang, Y. C., Yin, S. Y., Hammer, F., et al. 2006, ApJ, 652, 257
- Lynds & Sandage (1963) Lynds, C. R., & Sandage, A. R. 1963, ApJ, 137, 1005
- McCarthy et al. (1987) McCarthy, P. J., van Breugel, W., & Heckman, T. 1987, AJ, 93, 264
- McKeith et al. (1995) McKeith, C. D., Greve, A., Downes, D., & Prada, F. 1995, A&A, 293, 703
- McLeod et al. (1993) McLeod, K. K., Rieke, G. H., Rieke, M. J., & Kelly, D. M. 1993, ApJ, 412, 111
- Matsubayashi et al. (2009) Matsubayashi, K., Sugai, H., Hattori, T., et al. 2009, ApJ, 701, 1636
- Moustakas & Kennicutt (2006) Moustakas, J., & Kennicutt, R. C., Jr. 2006, ApJ, 651, 155
- Nagao et al. (2011) Nagao, T., Maiolino, R., Marconi, A., & Matsuhara, H. 2011, A&A, 526, A149
- Nakai et al. (1987) Nakai, N., Hayashi, M., Handa, T., et al. 1987, PASJ, 39, 685
- O’Connell & Mangano (1978) O’Connell, R. W., & Mangano, J. J. 1978, ApJ, 221, 62
- Osterbrock & Ferland (2006) Osterbrock, D. E., & Ferland, G. J. 2006, Astrophysics of gaseous nebulae and active galactic nuclei, 2nd. ed. by D.E. Osterbrock and G.J. Ferland. Sausalito, CA: University Science Books, 2006
- Oke (1990) Oke, J. B. 1990, AJ, 99, 1621
- Ryan-Weber et al. (2009) Ryan-Weber, E. V., Pettini, M., Madau, P., & Zych, B. J. 2009, MNRAS, 395, 1476
- Sharp & Bland-Hawthorn (2010) Sharp, R. G., & Bland-Hawthorn, J. 2010, ApJ, 711, 818
- Shopbell & Bland-Hawthorn (1998) Shopbell, P. L., & Bland-Hawthorn, J. 1998, ApJ, 493, 129
- Shull & McKee (1979) Shull, J. M., & McKee, C. F. 1979, ApJ, 227, 131
- Slavin et al. (1993) Slavin, J. D., Shull, J. M., & Begelman, M. C. 1993, ApJ, 407, 83
- Smith et al. (2006) Smith, L. J., Westmoquette, M. S., Gallagher, J. S., et al. 2006, MNRAS, 370, 513
- Sternberg et al. (2002) Sternberg, A., McKee, C. F., & Wolfire, M. G. 2002, ApJS, 143, 419
- Strickland & Heckman (2007) Strickland, D. K., & Heckman, T. M. 2007, ApJ, 658, 258
- Sugai et al. (2010) Sugai, H., Hattori, T., Kawai, A., et al. 2010, PASP, 122, 103
- Tsuru et al. (2007) Tsuru, T. G., Ozawa, M., Hyodo, Y., et al. 2007, PASJ, 59, 269
- Walter et al. (2002) Walter, F., Weiss, A., & Scoville, N. 2002, ApJ, 580, L21
- Westmoquette et al. (2009a) Westmoquette, M. S., Smith, L. J., Gallagher, J. S., III, et al. 2009, ApJ, 696, 192
- Westmoquette et al. (2009b) Westmoquette, M. S., Gallagher, J. S., Smith, L. J., et al. 2009, ApJ, 706, 1571
- Yajima et al. (2009) Yajima, H., Umemura, M., Mori, M., & Nakamoto, T. 2009, MNRAS, 398, 715
- Yoshida et al. (2011) Yoshida, M., Kawabata, Koji S., & Ohyama, Y. 2011, PASJ, 63, 493
- Yoshida et al. (2012) Yoshida, M., Yagi, M., Komiyama, Y., et al. 2012, ApJ, 749, 43
- Zastrow et al. (2011) Zastrow, J., Oey, M. S., Veilleux, S., McDonald, M., & Martin, C. L. 2011, ApJ, 741, L17