T-Cyg1-12664: A low-mass chromospherically active eclipsing binary in the Kepler field
Abstract
The eclipsing binary T-Cyg1-12664 was observed both spectroscopically and photometrically. Radial velocities of both components and ground-based VRI light curves were obtained. The Kepler’s R-data and radial velocities for the system were analysed simultaneously. Masses and radii were obtained as 0.6800.021 M⊙ and 0.6130.007 R⊙for the primary and 0.3410.012M⊙ and 0.8970.012R⊙ for the secondary star. The distance to the system was estimated as 12714 pc. The observed wave-like distortion at out-of-eclipse is modeled with two separate spots on the more massive star, which is also confirmed by the Ca ii K and H emission lines in its spectra. Locations of the components in the mass-radius and mass-effective temperature planes were compared with the well-determined eclipsing binaries’ low-mass components as well as with the theoretical models. While the primary star’s radius is consistent with the main-sequence stars, the radius of the less massive component appears to be 2.8 times larger than that of the main-sequence models. Comparison of the radii of low-mass stars with the models reveals that the observationally determined radii begin to deviate from the models with a mass of 0.27 and suddenly reaches to maximum deviation at a mass of 0.34 . Then, the deviations begin to decrease up to the solar mass. The maximum deviation seen at a mass of about 0.34 is very close to the mass of fully convective stars as suggested by theoretical studies. A third star in the direction of the eclipsing pair has been detected from our VRI images. The observed infrared excess of the binary is most probably arisen from this star which may be radiated mostly in the infrared bands.
keywords:
stars: binaries: eclipsing – stars: fundamental parameters – stars: binaries: spectroscopic – stars: late-type — stars: chromospheric activity1 Introduction
Transit events for the T-Cyg1-12664 were detected during regular operations of the Trans-Atlantic Exoplanet Survey network (TrES) for detecting the rare objects, such as transiting extrasolar planets and gravitational microlenses. Devor et al. (2008) made identification and classification of 773 eclipsing binaries found in the TrES-survey. They have also estimated the absolute properties of these systems by a joint analysis of their light curves, colors and theoretical isochrones. T-Cyg1-12664 is classified as a long-period single-lined eclipsing binary in their catalog, following a systematic analysis of the light curves within 10 fields of the TrES survey. This binary was originally thought to have an 8.2-day orbital period because all of the eclipses observed in the r-passband of TrES have almost equal depths. This indicates that the system should be consisted of very similar components.
Later on T-Cyg1-12664 was observed by the Kepler satellite in both long and short cadence and identified as KIC 10935310 in the Kepler Input Catalog. A very shallow secondary eclipse is revealed by these observations. Detailed descriptions of the characteristics of these observations can be found in Slawson et al. (2011). The shallow secondary eclipse with respect to the primary minimum and the orbital period of about 4-day are indicative of the existence of a low mass star in the system. Therefore, we included T-Cyg1-12664 into our observing program on the low-mas stars. In this paper we present the results of analyses of the data gathered by Kepler and as well as our ground-based spectroscopic and photometric observations and TrES. We point out the special location of the components in the parameter space and offer to use it as a benchmark object for future theoretical studies of low-mass stellar objects.
2 Data acquisition
2.1 Spectroscopy
Optical spectroscopic observations of the T-Cyg1-12664 were obtained with the Turkish Faint Object Spectrograph Camera (TFOSC)111http://tug.tug.tubitak.gov.tr/rtt150_tfosc.php attached to the 1.5 m telescope in July, 2010, under good seeing conditions. Further details on the telescope and the spectrograph can be found at http://www.tug.tubitak.gov.tr. The wavelength coverage of each spectrum was 4000-9000 Å in 12 orders, with a resolving power of / 7 000 at 6563 Å and an average signal-to-noise ratio (S/N) was 120. We also obtained high S/N spectra of two M dwarfs GJ 740 (M0 V) and GJ 182 (M0.5 V) for use as templates in derivation of the radial velocities (Nidever et al., 2002).
The electronic bias was removed from each image and we used the ’crreject’ option for cosmic ray removal. Thus, the resulting spectra were largely cleaned from the cosmic rays. The echelle spectra were extracted and wavelength calibrated by using Fe-Ar lamp source with help of the IRAF echelle package, see Tonry & Davis (1979).
2.2 Photometric identification and follow-up observations
T-Cyg1-12664 was first identified as a likely low-mass eclipsing binary candidate in the Devor et al. (2008)’s catalog, following a systematic analysis of the light curves (TrES; Alonso et al. 1996). The light curves of the survey consist of 5 240 -band photometric measurements (depicted in Fig. 7) binned to a 9-minute cadence. The calibration of the TrES images, the identification of stars and the extraction of the light curves are described by Dunham et al. (2004).
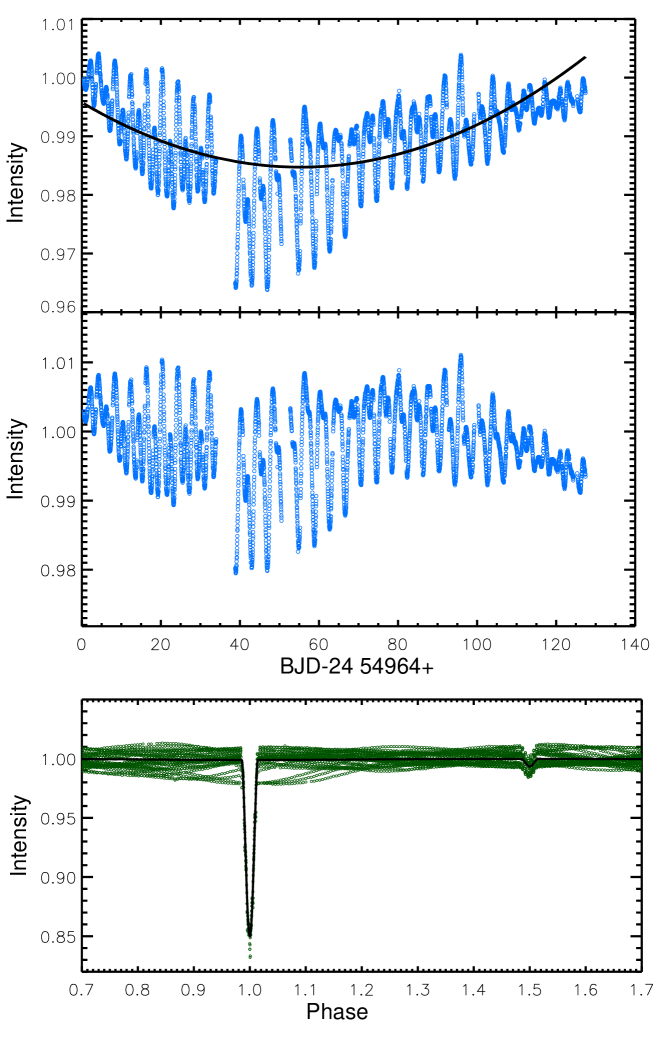
T-Cyg1-12664 was observed as KIC 10935310 between 24 54 953.0 - 24 55 370.7 by the satellite. The short-cadence observations comprise 135 and 170 data points obtained in the Quarters 1 and 3, and the long-cadence data encompass 2 651 and 2 752 data points in the Quarters 0 and 2, respectively. The uncorrected flux measurements are plotted against time in Fig. 1. The times of the data are expressed in the barycentric Julian day (BJD) time-scale. The light curves of eclipsing binaries obtained by satellite have discontinuities with variable amplitudes due to one safe mode and four spacecraft attitude tweaks in Q2. Therefore, one encounters with some problems, especially variability in the baseline flux, when creating a complete light curve of a system. This may be occurred from either systematic effects (focus drifts, safe modes), intrinsic stellar variability (chromospheric activity, pulsations), or extrinsic contamination by a third light (a variable source that contributes light in the aperture of the object of interest). For these complications and other substantial data issues see the ”Kepler Data Characteristics Handbook” (Christiansen et al., 2011). The main Kepler pipeline conveys two kinds of photometric data: calibrated and corrected. Calibrated data are gained by performing pixel-level calibration that corrects for the bias, dark current, gain, nonlinearity, smear and flat field, and applies aperture photometry to reduced data. Corrected data are the result of detrended data which corrects degraded cadence due to data unorthodox and removes variability.
The original data of T-Cyg1-12664 and their detailed descriptions can be found in Slawson et al. (2011). Most notable for a chromospherically active star where spot modulation causes a significant baseline variability with an amplitude of the same order as the depth of the secondary eclipse in the light curves. Fig. 1 shows the uncorrected flux measurements plotted versus the BJD. These light curves clearly show variations on a time scale of about 4 days, due to the eclipse, superimposed on a small amplitude light fluctuations. In Fig.2 (top panel) we plot the data against the BJD, excluding the eclipses. The light variations on a short time-scale have a peak-to-peak amplitude of about 0.020 in flux units. A second-order polynomial fit to the data at out-of-eclipse was obtained and subtracted from all of the fluxes, including eclipses. The remaining data after removal of the eclipses are plotted in the middle panel of Fig.2 which show again a variation with a cycle of about 90 days and a peak-to-peak amplitude of about 0.007 in flux units. The full data including eclipses are plotted in the bottom panel of Fig.2. The distortions on the light curve with changing amplitude are clearly seen.
In order to provide ground-based observations of the system in different passbands, we used SI 1100 CCD Camera222http://www.specinst.com/ mounted on the 1 m telescope at the TÜBİTAK National Observatory, Turkey. Further details on the telescope and the instruments can be found in Cakirli et al. (2010). Differential aperture photometry was performed to obtain the light curves in the V-, R-, and I-bandpass. We iteratively selected comparison and check stars, namely GSC 3562 396 and GSC 3561 2134. The typical residuals for each filter vary between 0.003 and 0.007 mag in differential magnitudes depending on the atmospheric conditions. The ground-based R-passband light curve is shown in the sixth panel from top-to-bottom of Fig. 7.

3 Analysis
3.1 Spectral classification
We have used our spectra to reveal the spectral type of the primary component of T-Cyg1-12664. For this purpose we have degraded the spectral resolution from 7 000 to 3 000, by convolving them with a Gaussian kernel of the appropriate width, and we have measured the equivalent widths () of photospheric absorption lines for the spectral classification. We have followed the procedures of Hernández et al. (2004), choosing helium lines in the blue-wavelength region, where the contribution of the secondary component to the observed spectrum is almost negligible. From several spectra we measured Å and Å. From the calibration relations –Spectral-type of Hernández et al. (2004), we have derived a spectral type of K5 with an uncertainty of about 1 spectral subclass and an effective temperature of 4 320100 K from the tables of Drilling & Landolt (2000).
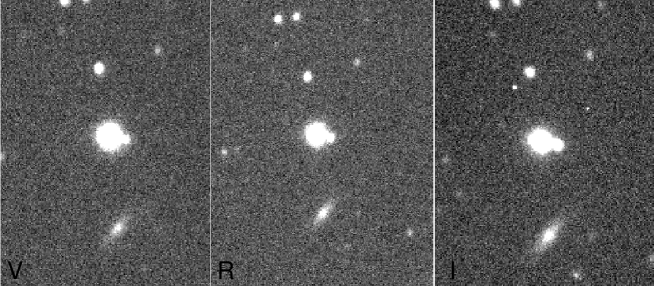
The catalogs USNO, NOMAD and GSC2.3 provide (see Table 1 for additional information) BVRJHK magnitudes for T-Cyg1-12664 with a few tenths of a magnitude uncertainities. Using the USNO B=14.240.20 mag and GSC2.3 V=13.110.30 mag we obtained an observed color of B-V=1.130.36 mag. The color-spectral type relationship of Drilling & Landolt (2000) gives a color of B-V=1.15 mag for a K5-dwarf. Therefore, an interstellar reddening of E(B-V) is ignored. The observed infrared colors of J-H=0.3290.021 and H-K=0.0530.021 are obtained using the JHK magnitudes given in the 2MASS catalog (Cutri et al., 2003). These colors correspond to a main-sequence G42 star which is not consistent with that estimated from the spectra. This difference should be arisen from an additional star in the same direction with the eclipsing binary system. This star should radiate mostly at the infrared to change the color of the binary about one spectral class. Actually, a third star is seen in our CCD images which locates at the same direction with the binary system. A CCD image is shown in Fig.3.
| Source Catalog | Parameter | Value |
|---|---|---|
| 2MASSa | (J2000) | 19:51:39.8 |
| 2MASS | (J2000) | +48:19:55.4 |
| USNO-Bb | mag | 14.24 0.20 |
| GSC2.3c | mag | 13.11 0.30 |
| USNO-B | mag | 13.32 0.20 |
| CMC14d | mag | 13.024 0.035 |
| 2MASS | mag | 11.911 0.015 |
| 2MASS | mag | 11.582 0.015 |
| 2MASS | mag | 11.529 0.015 |
| USNO-B | () | 18 6 |
| USNO-B | () | 6 2 |
| KIC | 10935310 | |
| Kmag | 13.100.21 |
| Minimum time | Cycle number | O-C | Ref. |
| (HJD-2 400 000) | |||
| 53177.8113 | -431 | 0.0011 | 1 |
| 53181.9372 | -430 | -0.0018 | 1 |
| 53206.7121 | -424 | 0.0003 | 1 |
| 53210.8415 | -423 | 0.0009 | 1 |
| 53239.7411 | -416 | -0.0011 | 1 |
| 53243.8718 | -415 | 0.0008 | 1 |
| 54965.5795(63) | 2 | -0.0002 | 2 |
| 54969.7081(75) | 3 | -0.0004 | 2 |
| 54973.8375(64) | 4 | 0.0003 | 2 |
| 54977.9656(10) | 5 | -0.0005 | 2 |
| 54982.0941(28) | 6 | -0.0007 | 2 |
| 54986.2240(31) | 7 | 0.0003 | 2 |
| 54990.3528(23) | 8 | 0.0004 | 2 |
| 54994.4814(15) | 9 | 0.0002 | 2 |
| 55006.8677(14) | 12 | 0.0001 | 2 |
| 55010.9963(13) | 13 | -0.0002 | 2 |
| 55019.2535(25) | 15 | -0.0006 | 2 |
| 55023.3823(30) | 16 | -0.0005 | 2 |
| 55027.5126(41) | 17 | 0.0010 | 2 |
| 55031.6413(32) | 18 | 0.0009 | 2 |
| 55035.7699(22) | 1 | 0.0007 | 2 |
| 55039.8985(7) | 20 | 0.0004 | 2 |
| 55044.0262(47) | 21 | -0.0007 | 2 |
| 55048.1556(8) | 22 | -0.0000 | 2 |
| 55052.2847(61) | 23 | 0.0003 | 2 |
| 55060.5425(42) | 25 | 0.0005 | 2 |
| 55064.6712(29) | 26 | 0.0004 | 2 |
| 55068.8006(74) | 27 | 0.0010 | 2 |
| 55072.9283(8) | 28 | -0.0001 | 2 |
| 55077.0566(6) | 29 | -0.0007 | 2 |
| 55081.1849(61) | 30 | -0.0012 | 2 |
| 55085.3142(9) | 31 | -0.0007 | 2 |
| 55089.4433(4) | 32 | -0.0003 | 2 |
| 55762.4377(4) | 195 | 0.0004 | 3 |
-
Ref:
(1) Devor et al. (2008), (2) , (3) VRI-data
3.2 Period determination
In the TrES observations the shallow secondary eclipse is not detected. Therefore, six times for the primary eclipse were obtained and the first ephemeris was presented by Devor et al. (2008). The secondary eclipse was clearly revealed by the Kepler photometric observations. We determined 27 times for the mid-primary eclipse. In addition, we obtained one time for mid-primary eclipse from the ground-based photometric observations. Since the light curve is distorted, due to chromospheric activity, as large as the depth of the secondary eclipse, no attempt has been made for derivation of the times for the mid-secondary eclipse. In order to measure the times of mid-primary eclipse we used the minimisation method. Very few of the minimum timings are accompanied by an errorbar, so uncertainties were assumed to be nearly equal. Since the times are given as BJD in the Kepler’s data we transformed them into the heliocentric time scales. All times of minimum light of T-Cyg1-12664 were presented in Table 2. The orbital ephemeris given by Devor et al. (2008) was used to determine the cycle numbers and the residuals between the observed and computed times of minima. A straight line was fitted to the resulting cycle numbers and residuals, in the sense observed minus computed times, (Table 2) by minimisation. The resulting ephemeris is obtained as,
| (1) |
where the quantities in the parenthesis are the uncertainties in the final digits of the preceding number. The residuals of the fit are plotted in Fig. 4. New orbital period is longer about 4 s than that found by Devor et al. (2008). Since the O-C residuals are represented by a straight line, although the observations gathered in three small time intervals but with large time spans between them, no substantive evidence is seen for departures from a constant period within six years.

3.3 Radial velocity
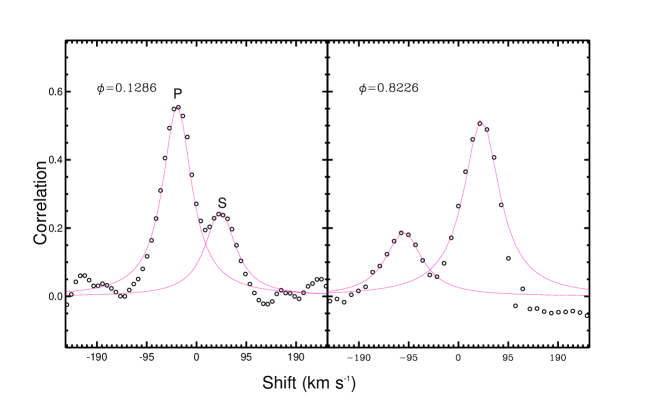
To derive the radial velocities of the components, the 9 TFOSC spectra of the eclipsing binary were cross-correlated against the spectrum of GJ 182, a single-lined M0.5 V star, on an order-by-order basis using the fxcor package in IRAF (Simkin, 1974). The majority of the spectra showed two distinct cross-correlation peaks in the quadrature, one for each component of the binary. Thus, both peaks were fitted independently in the quadrature with a profile to measure the velocity and errors of the individual components. If the two peaks appear blended, a double Gaussian was applied to the combined profile using de-blend function in the task. For each of the 9 observations we then determined a weighted-average radial velocity for each star from all orders without significant contamination by telluric absorption features. Here we used as weights the inverse of the variance of the radial velocity measurements in each order, as reported by fxcor.
We adopted a fit algorithm to resolve cross-correlation peaks near the first and second quadratures when spectral lines are visible separately. Fig. 5 shows examples of cros-correlations obtained by using the largest FWHM at nearly first and second quadratures. The two peaks correspond to each component of T-Cyg1-12664. The stronger peaks in each CCF correspond to the more luminous component which has a larger weight into the observed spectrum.
| HJD 2400000+ | Phase | Star 1 | Star 2 | ||
|---|---|---|---|---|---|
| 55390.47353 | 0.9098 | 22.3 | 4.8 | — | — |
| 55391.36826 | 0.1265 | -35.8 | 3.2 | 58.9 | 5.3 |
| 55392.52267 | 0.4061 | -28.2 | 4.6 | 44.1 | 7.7 |
| 55393.39257 | 0.6168 | 25.5 | 6.6 | -60.8 | 5.8 |
| 55393.56632 | 0.6589 | 35.6 | 6.0 | -82.5 | 4.8 |
| 55394.40416 | 0.8618 | 32.3 | 4.2 | -72.3 | 4.1 |
| 55396.39116 | 0.3431 | -42.2 | 2.2 | 66.6 | 7.1 |
| 55397.54163 | 0.6217 | 25.3 | 7.1 | -67.7 | 8.5 |
| 55398.36226 | 0.8205 | 37.6 | 3.3 | -84.3 | 4.1 |
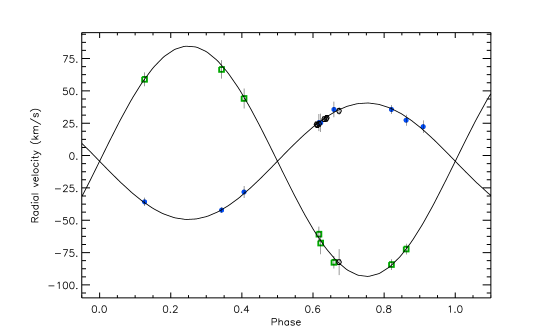
The heliocentric radial velocities for the primary (Vp) and the secondary (Vs) components are listed in Table 3 , along with the dates of observations and the corresponding orbital phases computed with the new ephemeris given in previous section. The velocities in this table have been corrected to the heliocentric reference system by adopting a radial velocity of 14 km s-1for the template star GJ 182. The radial velocities listed in Table 3 are the weighted averages of the values obtained from the cross-correlation of orders #4, #5, #6 and #7 of the target spectra with the corresponding order of the standard star spectrum. The weight has been given to each measurement. The standard errors of the weighted means have been calculated on the basis of the errors () in the velocity values for each order according to the usual formula (e.g. Topping 1972). The values are computed by fxcor according to the fitted peak height, as described by Tonry & Davis (1979). The radial velocities are plotted against the orbital phase in Fig. 6, which also includes the radial velocities measured by Devor (2008).
3.4 Light curve and radial velocities modeling
We used the most recent version of the eclipsing binary light curve modeling algorithm of Wilson & Devinney (1971), as implemented in the phoebe code of Prša & Zwitter (2005), further developed by Wilson (2007) . In order to obtain the physical parameters of the component stars we, in the first step, analysed simultaneously the detrended Kepler’s R-data, plotted in the bottom panel of Fig. 2, and radial velocities shown in Fig. 6. The Wilson-Devinney code needs some input parameters, which depend upon the physical structures of the component stars. The values of these parameters can be estimated from global stellar properties. Therefore, we adopted the linear limb-darkening coefficients from Van Hamme (1993) as 0.635 and 0.602 for the primary and secondary components, respectively, taking into account the effective temperatures and the wavelengths of the observations; the bolometric albedos from Lucy (1967) as 0.5, typical for a convective stellar envelope, the gravity brightening coefficients as 0.32 for both components. The rotational velocities of the components are assumed to be synchronous with the orbital one.
The adjustable parameters in the light and RV curves fitting were the orbital inclination, the surface potentials of the two stars, the effective temperature of the secondary, and the color-dependent luminosity of the hotter star, the zero-epoch offset, semi-major axis of the orbit, the mass-ratio and the systemic velocity. A detached configuration (Mode 2) with coupling between luminosity and temperature was used for solution. The iterations were carried out automatically until convergence, and a solution was defined as the set of parameters for which the differential corrections were smaller than the probable errors. The computed light curve corresponding to the simultaneous light-velocity solution is compared with the observations in the bottom panel of Fig.2 and in Fig.6.
It is obvious from these figures that the observed light curves and radial velocities are reproduced by the best fit theoretical curves shown by solid lines. However, systematic deviations are apparent in the light curve, especially at out-of-eclipses. The light curve of the system is asymmetric in shape and varies with time. The wave-like distortion at out-of-eclipses in the light curves of T-Cyg1-12664 is attributed to the spot or spot groups on the primary star. The amplitudes of these variations exceed sometime the depth of the secondary eclipse. Therefore, we assumed that solar-like activity originates in the K5 star, maculation effects are separable from proximity and eclipse effects, and a cool, circular spot model may represent the parameters of the spotted regions. Due to the very small light contribution of the secondary star, as it is indicated by the preliminary analysis, the K5 star should be responsible for the magnetic activity which will be discussed in Sec.4. The second step was to include spot parameters as adjustable parameters. Using a trial-error method we estimated preliminary parameters for the spots. The shape of the distortion on the light curve depends upon the number of spots, locations and sizes on the star’s surface. The trial-and-error method indicated that distortions could be represented by two cool spots on the primary star. Since the amplitude and shape of the wave-like distortion vary with time we divided the data into ten separate parts with a three-day intervals. The parameters calculated in the first step were taken as input parameters as well as spot parameters. The analysis was repeated and the final parameters and spot parameters are listed in Tables 4 and 5, respectively. The uncertainties assigned to the adjusted parameters are the internal errors provided directly by the Wilson-Devinney code.
We also searched for the light contribution of the third star. Third light is added to the adjustable parameters but this trial is failed. This is because either light contribution of the third star is as small as to be ignored at the R-bandpass or its effect is overcome by the spot effects.
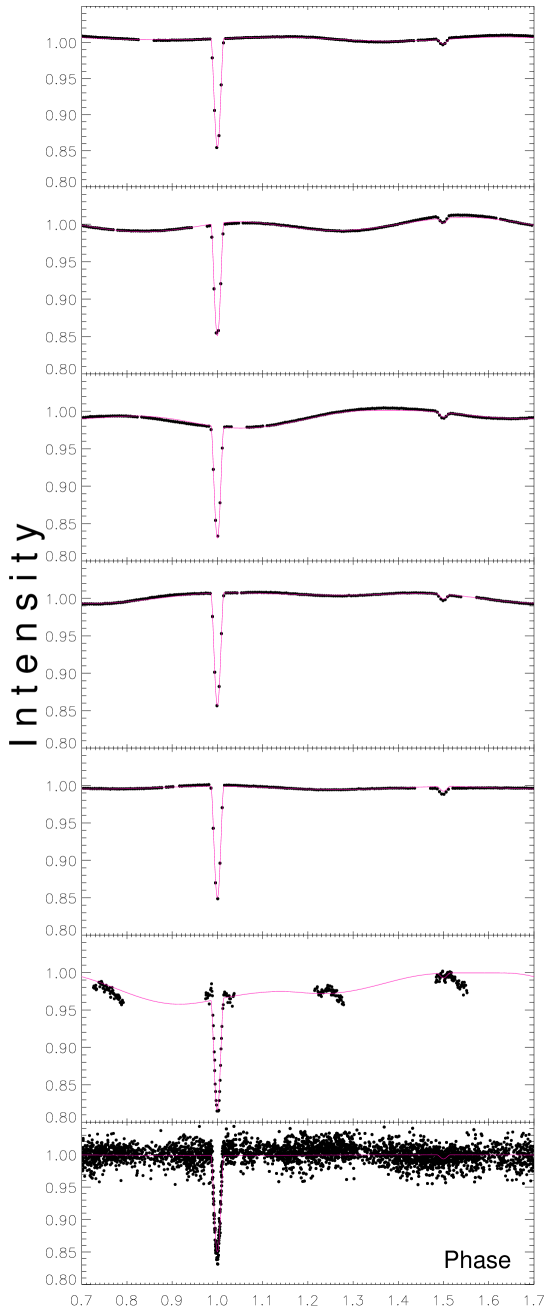
The computed light curves (continuous lines) are compared with the observations in Fig. 7 (five panels from top to bottom) . In the bottom two panels of Fig. 7 we also compare the computed curves with our R-data and the TrES r-passband data. The last two figures are presented only for comparison the observations with the computed curves obtained by the data.
| Parameters | |
|---|---|
| 83.840.04 | |
| 18.3980.076 | |
| 7.3410.049 | |
| T (K) | 4320[Fix] |
| T (K) | 27508 |
| (R⊙) | 10.9040.016 |
| (km s-1) | -4.7640.001 |
| 0.50210.0018 | |
| r1 | 0.05620.0002 |
| r2 | 0.08230.0007 |
| 0.89800.0018 | |
| 0.015 |
| BJD | Spot | (∘) | (∘) | (∘) | / |
|---|---|---|---|---|---|
| 54965-54968 | I | 51.42.5 | 49.11.2 | 12.40.3 | 0.97820.0012 |
| II | 93.41.1 | 220.20.8 | 20.20.4 | 0.99000.0003 | |
| 54982-54985 | I | 14.91.1 | 59.90.3 | 17.30.1 | 0.96100.0006 |
| II | 78.00.6 | 265.50.6 | 16.60.1 | 0.96210.0006 | |
| 55003-55006 | I | 106.81.3 | 115.01.5 | 15.70.2 | 0.97020.0008 |
| II | 91.60.4 | 340.00.7 | 19.90.1 | 0.96310.0005 | |
| 55034-55037 | I | 45.24.1 | 100.21.2 | 18.30.2 | 0.95730.0005 |
| II | 85.725.7 | 260.50.6 | 9.90.1 | 0.97830.0010 | |
| 55079-55082 | I | 97.70.9 | 99.91.3 | 15.20.3 | 0.98800.0006 |
| II | 48.81.3 | 260.01.6 | 16.10.3 | 0.98490.0006 | |
| 55760-55763 | I | 90.710.7 | 30.81.9 | 16.10.2 | 0.88000.0042 |
| II | 135.71.1 | 277.04.4 | 18.30.4 | 0.88000.0066 |
3.5 Absolute parameters
The orbital inclination and mean fractional radii of the components are found to be =83.840.04, r1=0.05620.0002, and r2=0.08230.0007 from the light and radial velocity curves analyses. The separation between the components was estimated to be =10.9040.016 R⊙. The effective temperature of 5770 K and bolometric magnitude of 4.74 mag are adopted for the Sun. The standard deviations of the parameters have been determined by JKTABSDIM333This can be obtained from http://http://www.astro.keele.ac.uk/jkt/codes.html code, which calculates distance and other physical parameters using several different sources of bolometric corrections (Southworth et al. 2005). The best fitting parameters are listed in Table 6 together with their formal standard deviations. The masses of the primary and secondary stars are determined with an accuracy of about 3% and 3.5% , respectively, while the radii with 1 % . We compared the position of the primary star in the age-radius diagram with the evolutionary tracks of Girardi et al. (2000) for solar metallicity. The location of the primary star in the Hertzsprung-Russell diagram is in a good agreement with those of K5 main-sequence stars. We roughly estimate its age as 3.4 Gyr. This indicates that the secondary star should also be on the main-sequence band of the Hertzsprung-Russell diagram.
The light contribution of the primary star is found to be 0.898 for the R-passband. Its apparent visual magnitude is calculated as 13.140.30 mag. The interstellar reddening of E(B-V)=0.0 mag yield a distance to the system as 12613 pc for the bolometric correction of -0.72 mag for a K5 main-sequence star (Drilling & Landolt, 2000). However, the mean distance to the system is estimated as 12814 pc for the the bolometric corrections taken from Girardi et al. (2002). The mean distance to the system was determined as 12714 pc.
3.6 Kinematics
To study the kinematical properties of T-Cyg1-12664, we used the system’s centre-of-mass velocity, distance and proper motion values. The proper motion data were taken from 2MASS catalogue (Skrutskie et al., 2006), whereas the centre-of-mass velocity and distance are obtained in this study. The system’s space velocity was calculated using Johnson & Soderbloms (1987) algorithm. The U, V and W space velocity components and their errors were obtained and given in Table 6. To obtain the space velocity precisely, the first-order galactic differential rotation correction was taken into account (Mihalas & Binney, 1981), and -1.08 and 0.65 km s-1differential corrections were applied to U and V space velocity components, respectively. The W velocity is not affected in this first-order approximation. As for the LSR (Local Standard of Rest) correction, Mihalas & Binney (1981) values (9, 12, 7)⊙ km s-1were used and the final space velocity of T-Cyg1-12664 was obtained as S =17 km s-1. This value is in agreement with space velocities of the young stars (Montes et al., 2001).
| T-Cyg1-12664 | ||
|---|---|---|
| Parameter | Primary | Secondary |
| Mass (M⊙) | 0.6800.021 | 0.3410.012 |
| Radius (R⊙) | 0.6130.007 | 0.8970.012 |
| (K) | 4 320100 | 2 75065 |
| () | 4.6960.006 | 4.0650.011 |
| -0.9280.041 | -1.3810.043 | |
| (km s-1) | 7.510.08 | 10.990.15 |
| Spectral Type | K5V1 | M3V1 |
| (pc) | 12714 | |
| , (mas yr-1) | -186, -62 | |
| (km s-1) | 41, 21, -71 | |

4 Stellar activity
The VRI light curves of T-Cyg1-12664 clearly show wave-like distortions, especially at out-of-eclipse. Such a cyclic variation is common properties of the active binary systems, i.e. RS CVn-type binaries. The amplitude of distortions on the light curves appears to change during the time span of the observations. The minimum and maximum amplitudes are measured as 5.9 and 30.5 mmag, respectively. However, the amplitudes of the wave-like distortion in the ground-based observations are 0.061, 0.042 and 0.033 mag in V-, R- and I-passband light curves, respectively. The effect of distortion is diminishing toward the longer wavelengths as it is expected for a K5 star. As it is evidenced from the top panel of Fig.2 the amplitude of the distortion increases up to about BJD 2455014 and then decreases again. A preliminary cycle for distortion is estimated to be about 127 days. The wave-like distortion has been represented by two spots located on the K5 star. The spot parameters are already given in Table 5. They are located at latitudes between 15 and 135 degrees, mostly in 40-100 degrees. It seems that they are located at longitudes of 90 and 270 degrees separated about 180 degrees. This result indicates that there are two active regions on the primary star. Such active longitude belts are common in chromospherically active stars (Eaton & Hall, 1979), (Uchida & Sakurai, 1985). The amplitude of the distortion is increased when the spots are located at latitudes about 90 and 107 degrees. The spots appears to be cooler about 140 K than the effective temperature of the primary star. In addition, the mean brightness level at the maxima, i.e. (MaxI+MaxII)/2, of the system varies of about 8 mmag with a cycle of about 90 days. The mean brightness has reached two local maxima and minima (see Fig. 2 middle panel).
The mostly used indicator of the stellar activity is Ca ii emission lines. In Fig. 8 the Ca ii - K (3933.68 Å) and Ca ii - H (3968.49 Å) emission lines for primary are shown. In the spectrum of the system hydrogen absorption lines are usually shallow which is another indicator of the stellar activity.
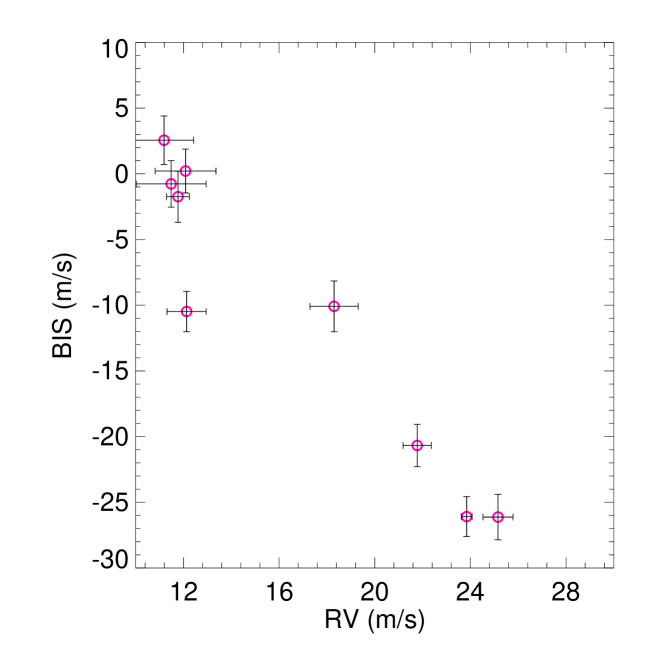
We also carried out a line bisector (BIS) analysis to enable us to find out whether the light curves and line profile variations may be attributed to starspots. It is a method describing quantitatively the tiny asymmetry or subtle changes in the line profiles. It is easily done by marking the middle of horizontal cuts of profile in the different line depths. The line connecting such points (called bisector) is then zoomed in horizontal (wavelength or radial velocity) direction. The characteristic shapes of bisector are reported in the literature (see for example (Queloz et al., 1998); (Martínez Fiorenzano et al., 2005)); i) anti-correlation, which indicates that the radial velocity variations are due to stellar activity (by active regions at the stellar surface like spots or plages), ii) lack of correlation, which indicates the Doppler reflex motion around the centre-of- mass due to the other bodies orbiting the star, iii) correlation, which, as pointed out by Martínez Fiorenzano et al. (2005), indicates that the radial velocity variations are due to light contamination from an unseen stellar companion.
As shown in Fig. 9, there is an anti-correlation between BIS and radial velocity, with a reliable correlation coefficient. This result suggests that the radial velocity variations of T-Cyg1-12664 are due to stellar activity variations (e.g. spots on photosphere).
| Object | Star | Mass/ | Radius/ | Teff/K | P | Refs | |||||||
|---|---|---|---|---|---|---|---|---|---|---|---|---|---|
| CM Dra | A | 0.2310 | 0.0009 | 0.2534 | 0.0019 | 3130 | 70 | 1.276 | 1 | ||||
| B | 0.2141 | 0.0008 | 0.2398 | 0.0018 | 3120 | 70 | |||||||
| YY Gem | A | 0.5992 | 0.0047 | 0.6194 | 0.0057 | 3820 | 100 | 0.820 | 2 | ||||
| B | 0.5992 | 0.0047 | 0.6194 | 0.0057 | 3820 | 100 | |||||||
| CU Cnc | A | 0.4349 | 0.0012 | 0.4323 | 0.0055 | 3160 | 150 | 2.794 | 3 | ||||
| B | 0.3992 | 0.0009 | 0.3916 | 0.0094 | 3125 | 150 | |||||||
| GU Boo | A | 0.6101 | 0.0064 | 0.6270 | 0.0160 | 3920 | 130 | 0.492 | 4 | ||||
| B | 0.5995 | 0.0064 | 0.6240 | 0.0160 | 3810 | 130 | |||||||
| TrES-Her0-07621 | A | 0.4930 | 0.0030 | 0.4530 | 0.0600 | 3500 | … | 1.137 | 5 | ||||
| B | 0.4890 | 0.0030 | 0.4520 | 0.0500 | 3395 | … | |||||||
| 2MASS J05162881+2607387 | A | 0.7870 | 0.0120 | 0.7880 | 0.0150 | 4200 | … | 2.619 | 6 | ||||
| B | 0.7700 | 0.0090 | 0.8170 | 0.0100 | 4154 | … | |||||||
| UNSW-TR 2 | A | 0.5290 | 0.0350 | 0.6410 | 0.0500 | … | … | 2.144 | 7 | ||||
| B | 0.5120 | 0.0350 | 0.6080 | 0.0600 | … | … | |||||||
| NSVS 06507557 | A | 0.6560 | 0.0860 | 0.6000 | 0.0300 | 3960 | 80 | 0.520 | 8 | ||||
| B | 0.2790 | 0.0450 | 0.4420 | 0.0240 | 3365 | 80 | |||||||
| NSVS 02502726 | A | 0.7140 | 0.0190 | 0.6740 | 0.0600 | 4300 | 200 | 0.560 | 9 | ||||
| B | 0.3470 | 0.0120 | 0.7630 | 0.0050 | 3620 | 205 | |||||||
| T-Lyr1-17236 | A | 0.6795 | 0.0107 | 0.6340 | 0.0430 | 4150 | … | 8.430 | 10 | ||||
| B | 0.5226 | 0.0061 | 0.5250 | 0.0520 | 3700 | … | |||||||
| 2MASS J01542930+0053266 | A | 0.6590 | 0.0310 | 0.6390 | 0.0830 | 3730 | 100 | 2.639 | 11 | ||||
| B | 0.6190 | 0.0280 | 0.6100 | 0.0930 | 3532 | 100 | |||||||
| GJ 3236 | A | 0.3760 | 0.0170 | 0.3828 | 0.0072 | 3310 | 110 | 0.770 | 12 | ||||
| B | 0.2810 | 0.0150 | 0.2992 | 0.0075 | 3240 | 110 | |||||||
| SDSS-MEB-1 | A | 0.2720 | 0.0200 | 0.2680 | 0.0090 | 3320 | 130 | 0.410 | 13 | ||||
| B | 0.2400 | 0.0220 | 0.2480 | 0.0080 | 3300 | 130 | |||||||
| BD -22 5866 | A | 0.5881 | 0.0029 | 0.6140 | 0.0450 | … | … | 2.211 | 14 | ||||
| B | 0.5881 | 0.0029 | 0.5980 | 0.0450 | … | … | |||||||
| NSVS 01031772 | A | 0.5428 | 0.0027 | 0.5260 | 0.0028 | 3615 | 72 | 0.368 | 15 | ||||
| B | 0.4982 | 0.0025 | 0.5088 | 0.0030 | 3513 | 31 | |||||||
| NSVS 11868841 | A | 0.8700 | 0.0740 | 0.9830 | 0.0300 | 5260 | 110 | 0.602 | 8 | ||||
| B | 0.6070 | 0.0530 | 0.9010 | 0.0260 | 5020 | 110 | |||||||
| GJ 2069A | A | 0.4329 | 0.0018 | 0.4900 | 0.0800 | … | … | 2.771 | 16 | ||||
| B | 0.3975 | 0.0015 | 0.3300 | 0.0400 | … | … | |||||||
| 2MASS J04463285+1901432 | A | 0.4700 | 0.0500 | 0.5700 | 0.0200 | 3320 | 150 | 0.630 | 18 | ||||
| B | 0.1900 | 0.0200 | 0.2100 | 0.0100 | 2910 | 150 | |||||||
| NSVS 6550671 | A | 0.5100 | 0.0200 | 0.5500 | 0.0100 | 3730 | 60 | 0.193 | 19 | ||||
| B | 0.2600 | 0.0200 | 0.2900 | 0.0100 | 3120 | 65 | |||||||
| IM Vir | A | 0.9810 | 0.0120 | 1.0610 | 0.0160 | 5570 | 100 | 1.309 | 20 | ||||
| B | 0.6644 | 0.0048 | 0.6810 | 0.0130 | 4250 | 130 | |||||||
| RXJ0239.1 | A | 0.7300 | 0.0090 | 0.7410 | 0.0040 | 4645 | 20 | 2.072 | 21 | ||||
| B | 0.6930 | 0.0060 | 0.7030 | 0.0020 | 4275 | 15 | |||||||
| ASAS J045304-0700.4 | A | 0.8452 | 0.0056 | 0.848 | 0.005 | 5324 | 200 | 1.6224 | 22 | ||||
| B | 0.8390 | 0.0056 | 0.833 | 0.005 | 5105 | 200 | |||||||
| ASAS J082552-1622.8 | A | 0.703 | 0.003 | 0.694 | 0.007 | 4230 | 200 | 1.52852 | 22 | ||||
| B | 0.687 | 0.003 | 0.699 | 0.011 | 4280 | 200 | |||||||
| ASAS J093814-0104.4 | A | 0.771 | 0.033 | 0.772 | 0.012 | 4360 | 200 | 0.897442 | 23 | ||||
| B | 0.768 | 0.021 | 0.769 | 0.013 | 4360 | 200 | |||||||
| ASAS J212954-5620.1 | A | 0.833 | 0.017 | 0.845 | 0.012 | 4750 | 150 | 0.702430 | 23 | ||||
| B | 0.703 | 0.013 | 0.718 | 0.017 | 4220 | 180 | |||||||
| T-Cyg1-12664 | A | 0.680 | 0.021 | 0.613 | 0.007 | 4320 | 100 | 4.12879779 | This study | ||||
| B | 0.341 | 0.012 | 0.897 | 0.012 | 2750 | 65 | |||||||
-
Ref:
(1) Morales et al. (2009a), (2) Torres & Ribas (2002), (3) Ribas (2003), (4) López-Morales & Ribas (2005), (5) Creevey et al. (2005), (6) Bayless & Orosz (2006), (7) Young et al. (2006), (8) Çakırlı & Ibanoǧlu (2010), (9) Çakırlı & Ibanoǧlu & Güngör (2009), (10) Devor et al. (2008), (11) Becker et al. (2008), (12) Irwin et al. (2009), (13) Blake et al. (2008), (14) Shkolnik et al. (2008), (15) López-Morales et al. (2006), (16) Delfosse et al. (1999), (17) Beatty et al. (2007), (18) Hebb et al. (2006), (19) Dimitrov & Kjurkchieva (2010) ,(20) Morales et al. (2009b), (21) López-Morales (2007), (22) Hełminiak & Konacki (2011), (23) Hełminiak et al. (2011)
5 Oversized Stars in the Low-Mass Eclipsing Binaries
Abt (1963) and Duquennoy, Mayor and Halbwachs (1991) report that binary stars are more common than single stars at masses above that of the Sun. In contrary, Reid & Gizis (1997) and Delfosse et al. (1999) suggest that binaries are not very common in low-mass stars, although approximately 75 % of all stars in our Galaxy are low-mass dwarfs with masses smaller than 0.7 . Due to the low binary fractions and their faintness very few low-mass eclipsing binary systems have been observed so far both photometrically and spectroscopically, yielding accurate physical parameters. Recently in a pioneer study, Ribas (2003, 2006) collected the available masses and radii of the low-mass stars and compared with those obtained by stellar evolutionary models. Even small numbers of the sample, a total of eight double-lined eclipsing binaries whose masses and radii are determined with an accuracy of better than 3 %, the comparison evidently revealed that the observed radii are systematically larger than the models. However, the effective temperatures are cooler than the theoretical calculations, being the luminosities in agreement with those of single stars with the same mass. This discrepancy between the models and observations has been explained by Mullan and MacDonald (2001), Torres et al. (2006), Ribas (2006) and Lopez-Morales (2007) and others by the high level magnetic activity in the low-mass stars. They suggest that stellar activity may be responsible for the observed discrepancy through inhibition of convection or effects of a significant spot coverage. However, Berger et al. (2006) compared the interferometric radii of low-mass stars with those estimated from theory and find a correlation between an increase in metallicity and larger-than-expected radius, i.e. the larger radii are caused by differences in metallicity.
The number of double-lined low-mass eclipsing binaries having precise photometric and spectroscopic observations is now reached to 26. Combining the results of the analysis of both photometric and spectroscopic observations accurate masses, radii, effective temperatures and luminosities of the components have been obtained. In Table 7 we list absolute parameters for the low-mass stars with their standard deviations. In Fig. 10 we show positions of the T-Cyg1-12664 components in the mass-radius (M-R) and mass - effective temperatures (M-Teff) planes relative to those of the well-determined low-mass stars in the eclipsing binary systems. Theoretical M-R diagrams for a zero-age main-sequence stars with [M/H]=0 taken from the Baraffe et al. (1998) are also plotted for comparison.
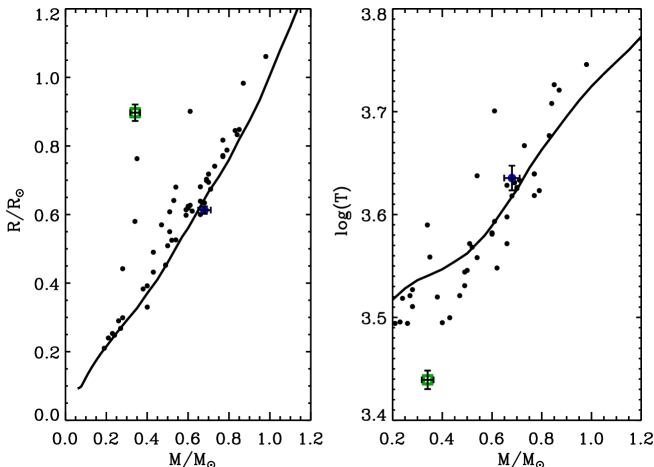
A low-mass star has a convective envelope with a radiative core. The depth of the convective zone is about 0.28 R for a star with a mass about 0.9 , and gradually increases to about 0.41 R for a 0.4 star. Stars are thought to be fully convective below about 0.35 . Therefore, the internal structure of such a low-mass star with a deep convective zone is tightly dependent on the mixing length parameter, . Cakirli et al. (2010) compared locations of the low-mass stars in the M-R and M-Teff diagrams with the theoretical calculations for various parameters. Convection is modelled by mixing length theory (Böhm-Vitense 1981) with the ratio of mixing length to pressure scale height (i.e. ). Theoretical models show that there is no significant separation in the M-R relation for the stars below about 0.6 , depending on the mixing length parameter. For masses above this value a separation is revealed. However, as the parameter increases the computed effective temperature gets higher. A separation is clearly seen even for the masses below 0.6 . Empirical parameters of the low-mass stars were also plotted in the same planes. This comparison clearly exposes that the discrepancies in radii and effective temperatures could not be explained only by changing parameter as it is obvious in M-R and M-Teff relations. On the other hand Demory et al. (2009) showed that there is no significant correlation between metallicity and radius of the single, low-mass stars. An alternative explanation remains to be the magnetic activity responsible for the observed larger radii but cooler effective temperatures. As demonstrated by Mullan & MacDonald (2001) and Chabrier et al. (2007) magnetic fields change the evolution of low-mass stars. Due to the high magnetic activity in the fast-rotating dwarfs their surfaces are covered by dark spot(s) or spot groups. Spot coverage in active dwarfs yields larger radii and lower effective temperatures. The secondary component of T-Cyg1-12664 appears to be the mostly deviated star from the normal main-sequence stars in the M-R plane. The empirical relation between the mass and radius of low mass stars clearly shows that the stars with masses below 0.27 follow theoretical M-R relation. Thereafter a slight deviation begins from theoretical expectations and the largest deviation occurs for stars with a mass of about 0.34 . Then, the deviations begin to decrease up to the solar mass. The maximum deviation seen at a mass of 0.34 which is very close to the mass of 0.35 fully convective stars as suggested by theoretical studies (Reiners & Basri, 2009) .
6 Discussion
We obtained multi-band ,VRI light curves and spectra of T-Cyg1-12664. We analyzed the Kepler’s R-data consisting of 5708 observations and radial velocities simultaneously. The light contribution of the secondary star /(+)=0.031 and 0.102 were obtained for the V-, and R-bandpass, respectively. This result indicates that the light contribution of the less massive component is very small, indicating its effect on the color at out-of-eclipse is very limited for the shorter wavelengths. Kepler’s R-data clearly show that there is a wave-like distortion on the light curve. Both the amplitude and the shape of these distortions vary with time. These distortions are modelled by two separate spots on the primary star, indicating two active longitude belts. In addition a sine-like variation in the mean normalized light of the system with a peak-to-peak amplitude of 0.007 in light units has been revealed. Extracting light contribution of the secondary star to total light and adopting various bolometric contributions for a K5V star we estimated a distance of 12714 pc for the system.
Comparison of the theoretical models shows that the secondary star has a radius of 2.8 times larger than that expected for its mass. It is located amongst the largest deviated low-mass stars from the mass-radius relation of the zero-age main-sequence stars. However, its effective temperature seems to be the lowest with respect to the models for solar composition. The mass of the secondary star is obtained with an accuracy of about 3.5 % which is very close to the mass of 0.35 which represents stars passing from partially convective envelope to the fully convective ones.
Acknowledgments
We thank to TÜBİTAK National Observatory (TUG) for a partial support in using RTT150 and T100 telescopes with project numbers 10ARTT150-483-0, 11ARTT150-123-0 and 10CT100-101. We also thank to the staff of the Bakırlıtepe observing station for their warm hospitality. We thank the referee for a timely and useful report. The following internet-based resources were used in research for this paper: the NASA Astrophysics Data System; the SIMBAD database operated at CDS, Strasbourg, France; TÜBİTAK ULAKBİM Süreli Yayınlar Kataloǧu-TURKEY; and the ariv scientific paper preprint service operated by Cornell University. We are grateful to the anonymous referee, whose comments and suggestions helped to improve this paper.
References
- Baldwin et al. (1991) Abt H. A., 1963, ApJS, 8, 99
- Alonso et al. (1996) Alonso, A., Arribas S., and Martinez-Roger, C., 1996, AA, 313, 873
- Baraffe et al. (1998) Baraffe I., Chabrier G., Allard F., Hauschildt P., 1998, A&A, 337, 403
- Bayless & Orosz (2006) Bayless A. J., Orosz J. A., 2006, ApJ, 651, 1155
- Beatty et al. (2007) Beatty T. G., et al., 2007, ApJ, 663, 573
- Becker et al. (2008) Becker A. C., et al., 2008, MNRAS, 386, 416
- Berger et al. (2006) Berger D. H., et al., 2006, ApJ, 644, 475
- Blake et al. (2008) Blake C. H., Torres G., Bloom J. S., Gaudi B. S., 2008, ApJ, 684, 635
- (9) Böhm-Vitense, E. 1981, ARA&A, 19, 295
- Cakirli et al. (2010) Cakirli O., Ibanoglu C., Dervisoglu A., 2010, RevMxAA, 46, 363
- Çakırlı & Ibanoǧlu (2010) Cakirli O., Ibanoglu C., 2010, MNRAS, 401, 1141
- Çakırlı & Ibanoǧlu & Güngör (2009) Cakirli O., Ibanoglu C., Güngör C., 2009, NewA, 14, 496
- Abt (1963) Chabrier G., Gallardo J. & Baraffe I., 2007, A&A, 472, 17
- Christiansen et al. (2011) Christiansen, J., et al. 2011, Kepler Data Characteristics Handbook, KSCI-19040-001, available at http://archive.stsci.edu/kepler/documents.html
- Creevey et al. (2005) Creevey O. L., et al., 2005, ApJ, 625, L127
- Cutri et al. (2003) Cutri R. M., et al., 2003, The IRSA 2MASS All-Sky Point Source Catalog, NASA/IPAC Infrared Science Archive. http://irsa.ipac.caltech.edu/applications/Gator/
- Delfosse et al. (1999) Delfosse X., Forveille T., Mayor M., Burnet M., Perrier C., 1999, A&A, 341, L63
- Demory et al. (2009) Demory B.-O., et al., 2009, A&A, 505, 205
- Devor (2008) Devor, J., 2008, PhD Thesis, Harvard Uninersity
- Devor et al. (2008) Devor J., Charbonneau D., O’Donovan F. T., Mandushev G., Torres G., 2008, AJ, 135, 850
- Dimitrov & Kjurkchieva (2010) Dimitrov D. P., Kjurkchieva D. P., 2010, MNRAS, 866
- Drilling & Landolt (2000) Drilling J. S., Landolt A. U., 2000, Allen’s astrophysical quantities, 4th ed. Edited by Arthur N. Cox. ISBN: 0-387-98746-0. Publisher: New York: AIP Press; Springer, 2000, p.381
- Dunham et al. (2004) Dunham, E. W., Mandushev, G. I., Taylor, B. W., & Oetiker, B. 2004, PASP, 116, 1072
- Duquennoy, Mayor, & Halbwachs (1991) Duquennoy A., Mayor M., Halbwachs J.-L., 1991, A&AS, 88, 281
- Eaton & Hall (1979) Eaton J.A. & Halll, D.S., 1979, ApJ, 227, 907
- Evans et al. (2002) Evans, D. W., Irwin, M. J., & Helmer, L. 2002, AAP, 395, 347
- Girardi et al. (2000) Girardi L., Bressan A., Bertelli G., Chiosi C., 2000, A&AS, 141, 371
- Girardi et al. (2002) Girardi L., Bertelli G., Bressan A., Chiosi C., Groenewegen M. A. T., Marigo P., Salasnich B., Weiss A., 2002, A&A, 391, 195
- Hebb et al. (2006) Hebb L., Wyse R. F. G., Gilmore G., Holtzman J., 2006, AJ, 131, 555
- Hełminiak & Konacki (2011) Hełminiak K. G., Konacki M., 2011, A&A, 526, A29
- Hełminiak et al. (2011) Hełminiak K. G., et al., 2011, A&A, 527, A14
- Hernández et al. (2004) Hernández J., Calvet N., Briceño C., Hartmann L., Berlind P., 2004, AJ, 127, 1682
- Irwin et al. (2009) Irwin J., et al., 2009, ApJ, 701, 1436
- Johnson & Soderbloms (1987) Johnson, D. R. H., & Soderbloms, D. R., 1987, AJ, 93, 864
- López-Morales & Ribas (2005) López-Morales M., Ribas I., 2005, ApJ, 631, 1120
- López-Morales et al. (2006) López-Morales M., Orosz J. A., Shaw J. S., Havelka L., Arevalo M. J., McIntyre T., Lazaro C., 2006, astro, arXiv:astro-ph/0610225
- López-Morales (2007) López-Morales M., 2007, ApJ, 660, 732
- Lucy (1967) Lucy L. B., 1967, Z. Astrophys., 65, 89
- de Jager & Nieuwenhuijzen (1987) de Jager C., Nieuwenhuijzen H., 1987, AA, 177, 217
- Martínez Fiorenzano et al. (2005) Martínez Fiorenzano A. F., Gratton R. G., Desidera S., Cosentino R., Endl M., 2005, A&A, 442, 775
- Mihalas & Binney (1981) Mihalas, D., & Binney, J., 1981. in Galactic Astronomy, 2nd edition, Freeman, San Fransisco, p.181
- Monet et al. (2003) Monet, D. G., et al. 2003, AJ, 125, 984
- Morrison et al. (2001) Morrison, J. E., Röser, S., McLean, B., Bucciarelli, B., & Lasker, B. 2001, AJ, 121, 1752
- Morales et al. (2009a) Morales J. C., et al., 2009a, ApJ, 691, 1400
- Morales et al. (2009b) Morales J. C., Torres G., Marschall L. A., Brehm W., 2009b, ApJ, 707, 671
- Mullan & MacDonald (2001) Mullan D. J., MacDonald J., 2001, ApJ, 559, 353
- Nidever et al. (2002) Nidever D. L., Marcy G. W., Butler R. P., Fischer D. A., and Vogt S. S., 2002, ApJS, 141, 503
- Prša & Zwitter (2005) Prša A., Zwitter T. 2005, ApJ, 628, 426P
- Popper (1980) Popper D. M., 1980, Ann. Rev. AA, 18, 115
- Queloz et al. (1998) Queloz D., Allain, S., Mermilliod, J.-C., Bouvier, J., & Mayor, M., 1998, A&A, 335, 183
- Reiners & Basri (2009) Reiners A., Basri G., 2009, AA, 496, 787
- Reid & Gizis (1997) Reid I. N., Gizis J. E., 1997, AJ, 114, 1992
- Ribas (2003) Ribas I., 2003, A&A, 398, 239
- Ribas (2006) Ribas I., 2006, Ap&SS, 304, 89
- Shkolnik et al. (2008) Shkolnik E., Liu M. C., Reid I. N., Hebb L., Cameron A. C., Torres C. A., Wilson D. M., 2008, ApJ, 682, 1248
- Simkin (1974) Simkin, S. J., 1974, A&A, 31, 129
- Skrutskie et al. (2006) Skrutskie, M. F., et al. 2006, AJ, 131, 1163
- Slawson et al. (2011) Slawson R. W., et al., 2011, AJ, 142, 160
- Southworth et al. (2005) Southworth J., Smalley B., Maxted P. F. L., Claret A. & Etzel P. B. 2005, MNRAS, 363, 529
- Tonry & Davis (1979) Tonry, J., & Davis M., 1979, AJ 84, 1511
- Topping (1972) Topping J., 1972, ”Errors of Observation and Their Treatment”, (Chapman and Hall Ltd.), p.89
- Torres & Ribas (2002) Torres G., Lacy C. H., Marschall L. A., Sheets H. A., & Mader J. A., 2006, ApJ, 640, 1018
- Uchida & Sakurai (1985) Uchida Y. & Sakurai T., 1985, in Unstable current systems and plasma instabilitiesin astrophysics, ed. M.R.Kundu and G.D. Holman (Dordrecht: Reidel) in IAU 107th Symp., 281
- Young et al. (2006) Young T. B., Hidas M. G., Webb J. K., Ashley M. C. B., Christiansen J. L., Derekas A., Nutto C., 2006, MNRAS, 370, 1529
- van Hamme (1993) van Hamme, W. 1993 AJ, 106, 2096
- Wilson (2007) Wilson R. E., 2007, in IAU Symp. 240, ed. by W.I. Hartkopf, E.F.Guinan & P.Harmanec (Cambridge Univ. Press), 188
- Wilson & Devinney (1971) Wilson R.E. & Devinney E.J., 1971, ApJ, 166, 605
- Montes et al. (2001) Montes D., López-Santiago J., Gálvez M. C., Fernández-Figueroa M. J., De Castro E., Cornide M., 2001, MNRAS, 328, 45