Analysis of Helioseismic Power-Spectrum Diagram of A Sunspot
Abstract
The continuous high spatial-resolution Doppler observation of the Sun by Solar Dynamics Observatory / Helioseismic and Magnetic Imager allows us to compute helioseismic – power-spectrum diagram using only oscillations inside a sunspot. Individual modal ridges can be clearly seen with reduced power in the – diagram constructed by use of 40-hour observation of a stable and round sunspot. Comparing with the – diagram obtained from a quiet-Sun region, inside the sunspot the -mode ridge gets more power reduction than -mode ridges, especially at high wavenumber. The -mode ridges all shift toward lower-wavenumber (or higher-frequency) areas for a given frequency (or wavenumber), implying an increase of phase velocity beneath the sunspot. This probably results from acoustic waves’ travel across the inclined magnetic field of the sunspot penumbra. Line-profile asymmetries exhibited in the -mode ridges are more significant in the sunspot than in quiet Sun. Convection inside the sunspot is also highly suppressed, and its characteristic spatial scale is substantially larger than the typical convection scale of quiet Sun. These observational facts demand a better understanding of magnetoconvection and interactions of helioseismic waves with magnetic field.
keywords:
Sun: helioseismology; Sun: oscillations; Sun: sunspots1 Introduction
Analysis of helioseismic power-spectrum diagrams, also known as – diagrams, obtained from solar oscillation signals, is a useful way to derive solar atmospheric properties, interior structures, and subsurface dynamics (e.g. \openciterho97; \opencitesch98). While many global-scale properties of the Sun were inferred by analyzing – diagrams obtained from the global-scale observations, some local-scale properties were derived by analyzing – diagrams obtained from oscillations in local areas, known as ring-diagram analysis [Hill (1998)]. Solar areas containing active regions have been studied using ring-diagram techniques to infer interior structures [Basu, Antia, and Bogart (2004), Baldner, Bogart, and Basu (2011)] and subsurface flow fields [Haber et al. (2004), Komm et al. (2005)] of active regions. However, the – diagrams used in these analyses are largely composed of oscillations outside of sunspots rather than those inside sunspots, hence represent properties of large areas instead of properties of confined sunspot areas. Other local helioseismology techniques, e.g., time-distance helioseismology [Duvall et al. (1993b), Kosovichev, Duvall, and Scherrer (2000), Gizon et al. (2009)], also need to apply filters over – diagrams although not to analyze the – diagrams directly.
Despite the scientific interest and importance of constructing – diagrams using only oscillations inside sunspots, this has not been successfully achieved due to either poor spatial resolution or limited temporal coverage. \inlinecitepen93 attempted to compute – diagrams of two sunspots using observations from Mees Solar Observatory, but were not able to obtain distinct modal ridges. Using Hinode Ca H observations, \inlinecitenag07 studied acoustic power maps inside a sunspot, but did not analyze its – diagram due to the short temporal coverage. Employing Hankel’s decomposition, \inlinecitebra87 analyzed the – diagrams made from acoustic waves traveling into and out from sunspots separately, but these diagrams were not computed using oscillations observed directly inside sunspots. SOHO/MDI [Scherrer et al. (1995)] full-disk data did not have sufficient spatial resolution to construct – diagrams using only signals inside sunspots, while its high-resolution data lacked sufficient coverage time. The Helioseismic and Magnetic Imager [Scherrer et al. (2012), Schou et al. (2012)] onboard Solar Dynamics Observatory (SDO/HMI) provides continuous observations of the Sun with a high spatial resolution and steady temporal cadence, and this allows us to perform a – diagram analysis for sunspots. In this article, we report some interesting properties found in the – diagram of a sunspot. We introduce our data-analysis procedure in Section 2, and present our analysis results in Section 3. We discuss these results in Section 4, and give conclusions in Section 5.
2 Data Analysis
sec2
SDO/HMI has continuous observations of the full solar disk except during some short eclipse periods, with a temporal cadence of 45 seconds and a spatial resolution of 1.0 arcsec. Dopplergrams observed by HMI, primarily used for helioseismology studies as recently demonstrated by \inlinecitezha12, are used in this study. The sunspot located inside NOAA AR 11092 is selected for the – power-spectrum analysis. This sunspot, as displayed in Figure \irefspot, was located at the latitude of N, and remained stable and round in shape during the period of analysis. Magnetic field surrounding this sunspot was relatively simple. A period of 40 hours, covering 16:00 UT 2 August through 08:00UT 4 August, 2010, is selected for analysis, and this is roughly corresponding to the sunspot’s central meridian crossing, from East of the central meridian to West of it. This 40-hour period is then divided into five eight-hour segments, and each data segment is analyzed separately. The results obtained from each segment are then averaged to give the final results. Every eight-hour data segment is tracked with the sunspot’s rotation speed as given by Howard (1990), and is remapped using Postel’s projection with the remapping center at the sunspot center and with a sampling resolution of pixel-1, slightly oversampling in most areas except near the solar-disk center.
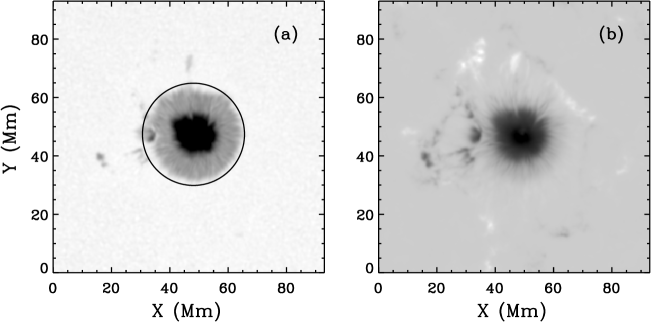
Fourier transform is used to convert data from space – time domain to Fourier domain, and – diagram is constructed in the three-dimensional Fourier domain. To avoid possible complications of Fourier analysis due to the irregular shape of the sunspot boundary, we choose to use the oscillations inside a circular boundary as denoted by the black circle in Figure \irefspota. When performing Fourier transforms, we keep the entire box size unchanged as shown in Figure \irefspot and fill up the area outside of the circle with zeroes, and this is a normal practice known as zero-padding in Fourier analysis. The area near the boundary of the inside and outside of the circle is tapered with a cosine bell to avoid sharp transition that may give spurious signals. For the – diagram made following the above procedure, the power at low-wavenumber areas gets contaminated due to the small box size and the circular structure with data surrounded by zeroes. Thus, we do not take signals lower than rad Mm-1 into the analysis that follows.
To better understand the analysis results, it is useful to do similar analyses over quiet-Sun regions for comparison. Here, we select a piece of quiet Sun that has a same disk location and a same temporal duration as the analyzed sunspot covering the period of 16:00 UT 17 August through 08:00UT 19 August, 2010, fifteen days after the sunspot analysis period. The exactly same analysis procedures are applied on these data segments, and results are used as references to compare with the results from the sunspot.
3 Results
sec3
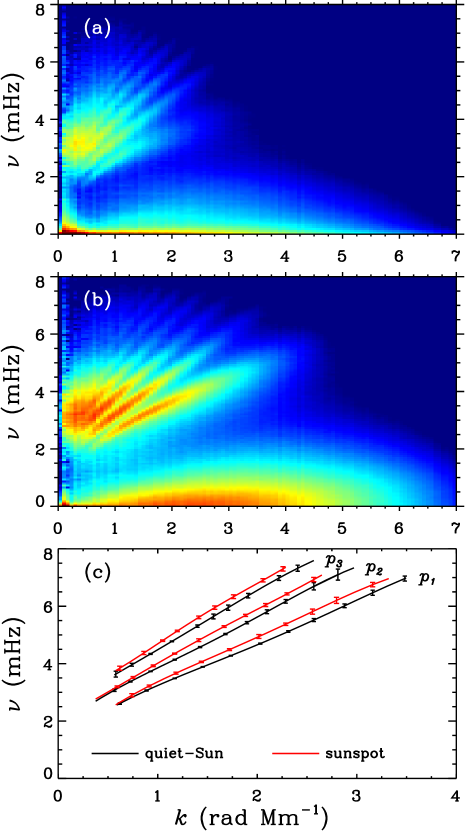
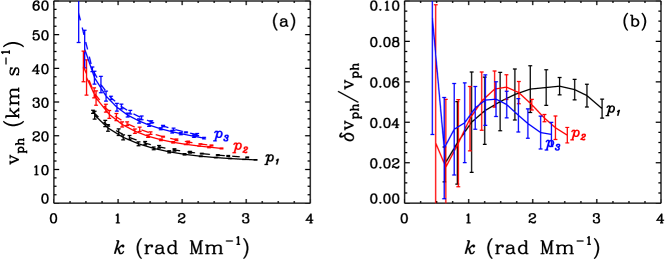
Figure \irefkwa and b display the – diagrams calculated from the sunspot region and the quiet-Sun region, respectively. Individual modal ridges can be clearly seen in both diagrams. As expected, the helioseismic power of each ridge is much weaker in the diagram obtained from the sunspot than that from the quiet-Sun. Compared with the -mode (acoustic mode) power reductions for the sunspot, the power reduction in the -mode (surface-gravity mode) ridge is more substantial, and the length of this ridge seems more shortened due to the higher power reduction at higher wavenumber. For both – diagrams, we fit the modal ridges by peak-finding to better illustrate how the location of each individual ridge obtained from the sunspot differs from that obtained from the quiet-Sun region. The fitting results are shown in Figure \irefkwc. It is difficult to get a reliable fitting for the -mode ridge of the sunspot. The three fitted modal ridges obtained from the sunspot all shift to the lower wavenumber (or alternatively speaking, higher frequency) side relative to the ridges obtained from the quiet Sun for a given frequency (or wavenumber). The shift amount is not uniform along each individual ridge, and the largest shift is up to 0.3 mHz.
Based on the fitted modal ridges shown in Figure \irefkwc, we calculate phase velocity along each ridge of both diagrams and display the results in Figure \irefphva. The derived phase velocity in the sunspot region is often larger than in the quiet-Sun region by up to 3 km s-1. Figure \irefphvb shows the phase-velocity perturbation for the sunspot relative to the quiet-Sun region for each modal ridge. The calculated , although large in error bars, mostly fall in range of 0.02 to 0.06.
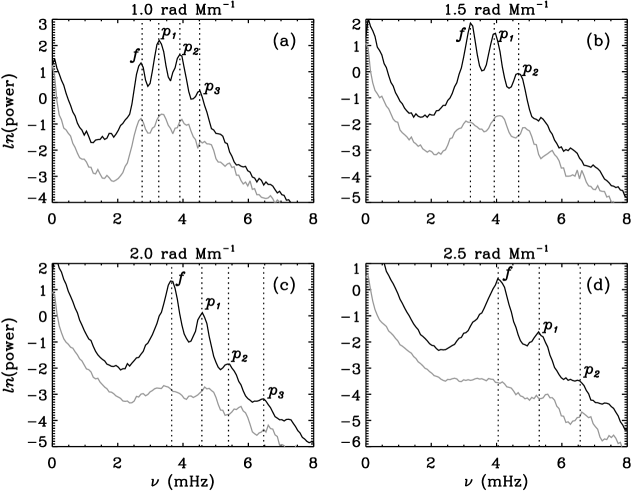
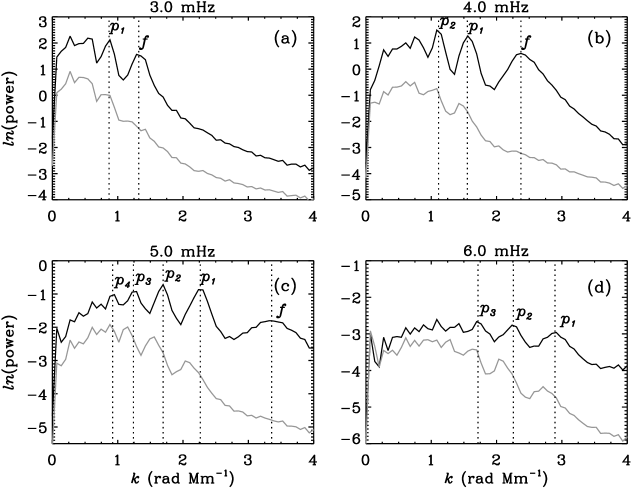
Comparisons of the ridge shape and location at selected frequencies are displayed in Figure \irefkw_cut, where the curves are obtained by averaging a 0.2-mHz wide band in the – diagrams of Figure \irefkwa and b. Figure \irefkw_cut again shows that the helioseismic power of the -mode ridge is more suppressed in the sunspot. All of the -mode ridges show clear shifts toward lower wavenumber, and the shifts are more significant in higher frequencies. The amount of ridge shift can be as large as half of the ridge-width for , , and ridges at the frequency of 5.0 and 6.0 mHz, as can be seen in Figure \irefkw_cutc and d. It can also be found in Figure \irefkw_cut that the modal ridge line-profile asymmetry is more significant in the power spectrum from the sunspot than from the quiet-Sun region. It is well known that the modal ridges obtained from Doppler observations exhibit line-profile asymmetries [Duvall et al. (1993a)], and this asymmetry is believed to be caused by correlated noise [Nigam et al. (1998), (10)]. It is not immediately clear whether the more prominent line-profile asymmetries in sunspots can be explained by more substantial correlated noise observed in these areas. On the other hand, recent studies (e.g. \opencitecho09) found that the power absorption and local suppression of acoustic waves inside sunspots increase with wavenumber, and the more prominent line-profile asymmetry may possibly be due to this effect.
Figure \irefkw_vcut shows comparisons of ridge shapes and locations at some selected wavenumbers. For each given wavenumber, the – ridges all display shifts toward higher frequency, and the amount of shift can also be up to half of the ridge width. The significant line-profile asymmetry is also clear in the -mode ridges obtained from the sunspot region. For the -mode ridge, it seems that the ridge shifts toward lower frequency in panels (c) and (d) of Figure \irefkw_vcut, but that may just be due to the enhancement of background noises near these frequencies.
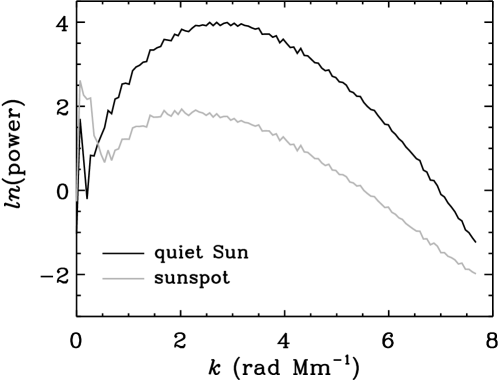
It is also interesting to compare convection power of the sunspot and the quiet-Sun region. The convection powers, primarily below 1.5 mHz, can be seen in the lower part of panels (a) and (b) of Figure \irefkw. Following procedures employed by \inlinecitecho92 and \inlinecitegeo07, we calculate convection power as a function of wavenumber by integrating power below the straight line separating oscillation power and convection power, i.e. , where is in unit of mHz and in unit of rad Mm-1. Figure \irefkw_conv shows the comparison of convection powers obtained from both – diagrams. Not surprisingly, convection is greatly suppressed inside the sunspot. The location of the convection peak is also shifted toward lower wavenumber in the power spectrum obtained from the sunspot relative to that from the quiet Sun. For the quiet Sun, convection peaks at wavenumber of approximately 2.7 rad Mm-1 that is corresponding to a characteristic spatial scale of 2.3 Mm, presumably representing the scale of solar granules. For the sunspot, convection peaks at approximately 1.9 rad Mm-1, corresponding to a characteristic spatial scale of 3.3 Mm, over 40% larger than the typical convection scale estimated for the quiet Sun. This is consistent with the result of time – distance analysis of a sunspot observed by Hinode Ca H line [Zhao, Kosovichev, and Sekii (2010)] in that the convection scale is larger inside sunspots than in quiet Sun, but different in the convection cell sizes inside the sunspot, which was reported as 4 – 5 Mm in that study. The difference in sizes obtained from these two studies may be due to the different spectral line formation heights. The reason of why the convection cell size appears larger inside the sunspot is not clear, but it is possible that magnetic field suppresses convection more strongly in smaller scales and leaves larger-scale convection more prominent. And also, we cannot completely rule out the possibility of that the penumbral filament, which is typically larger than granules, leaks into our analysis of convection power inside the sunspot.
4 Discussion
sec4
4.1 Possible Measurement Uncertainties
We have constructed the – power-spectrum diagram using only oscillations inside a sunspot observed by SDO/HMI. Distinct - and -mode ridges are clearly seen, and this demonstrates that resonant oscillations exist inside the sunspot, primarily inside the sunspot penumbra. It is not clear how much scattered light, the light scattered into the dark sunspot umbra from the brighter surrounding areas, plays a role in our computed – diagram. It is estimated that in an HMI-observed sunspot umbra, the scattered light composes approximately of the light intensity (T. Duvall, private communication, 2012). However, the power spectrum seen in Figure \irefkwa is mainly from the sunspot penumbra, and this is clear from two experiments that we have performed. One is to mask out all oscillations in the umbra, and the other is to enhance the oscillations in the umbra to the same amplitude as the oscillations in the penumbra. In both experiments, the – diagram is not much different from the one shown in Figure \irefkwa except in very low- area, where results are already deemed not useful due to the selection of a small area and zero-padding. Therefore, the effect of scattered light to the computed – diagram of the sunspot is believed negligible in the diagram area that we are interested in. We also attempted to construct a – diagram by using only oscillations signals inside the sunspot umbra, but were not able to detect distinct modal ridges, probably due to the small size of the umbra and its weak oscillation amplitude.
The uncertainties in determining Doppler velocities inside the sunspot may also have some effects in the – diagram constructed in this study. \inlinecitenor06 discussed the sensitivity of the line Fe I 6173Å to magnetic field, and \inlinecitecou12 examined the uncertainties of deriving Doppler velocities, particularly inside active regions, using different methods. The uncertainties in Doppler velocities may cause some uncertainties in power measurements but are not expected to play a significant role in shifting the locations of modal ridges found in this study.
4.2 Implications for Sunspot Subsurface Structure
It is interesting to understand why the -mode ridges shift toward lower wavenumber (or higher frequency). \inlinecitesch08 explored the wave motions with the presence of inclined magnetic field inside sunspot penumbra, and \inlinecitefel10 discussed the wave mode conversions in the magnetized plasma by using 3D MHD simulations. More recently, \inlinecitekit11 showed through MHD simulations that vertical magnetic field would introduce some acoustic frequency shifts toward higher frequency, but an inclined magnetic field would shift the frequency more substantially. This is consistent with our observation of modal-ridge shifts toward higher frequency in the sunspot, where the sunspot penumbra, the region with strong inclined magnetic field, contributes most to our computed – diagram. It is possible that the modal-ridge shift is due to that part of the acoustic waves converts to fast magnetoacoustic waves when passing the magnetic field beneath the sunspot, and the phase velocity of fast magnetoacoustic wave is determined by:
| (1) |
where , , and are sound speed, Alfvén speed, and angle between directions of wave-vector and magnetic field, respectively. The observed power spectrum is an aggregate from different depths beneath the sunspot, so in principle, it is possible to invert the observed power spectrum for the interior magnetic-field distribution although this inversion procedure is considerably complicated.
The relative change in phase velocity shown in Figure \irefphvb may provide some information beneath the sunspot. The small values of , which falls in a range of , together with Equation (\irefeq1) suggests that the averaged and inside the sunspot is small, where is the sound-speed change inside the sunspot relative to the quiet Sun. If and , from Equation (\irefeq1), we have
| (2) |
The observed value of gives a constraint on the value of averaged , and that is . It is noted that is averaged over the three-dimensional sunspot region weighted with a kernel, which is proportional to the mode energy density though the mode energy density inside the sunspot is unknown. Unlike which is always positive, could be positive or negative beneath the sunspot. Since and , where is the adiabatic index and the ratio of gas pressure to magnetic pressure. is smaller than near the surface if is not too small. Thus, most of contribution to could be from . Another possible contribution to , which is not shown in Equation (\irefeq1), is the change in the mode cavity, although it could be smaller than that in Equation (\irefeq2). The upper turning point inside the sunspot is deeper than in the quiet Sun, thus its contribution to is positive.
An interesting phenomenon shown in Figure \irefphvb is that has a general trend for each : it first increases and then decreases with . This could be explained by Equation (\irefeq2). It is generally believed that is significant only near the surface. Since the mode of higher penetrates less deeply into the solar interior, averaged increases with . On the other hand, the mode of higher propagates less vertically near the surface, and the magnetic field inside the sunspot penumbra has a large horizontal component near the surface. This leads to that a decrease of with , or averaged increases with . Therefore, averaged increases with while averaged decreases with . This yields a maximum of or at some .
4.3 Relevance to Earlier Studies
Recent power-spectral analysis by \inlinecitesch11 showed that the modal ridges obtained from the sunspot vicinity, where acoustic halos are detectable, shift to higher-wavenumber areas relative to the quiet Sun. That shift is in a direction opposite to what we find inside the sunspot area in this study. It seems that the modal ridges shift toward lower wavenumber in areas where acoustic power gets reduced, and shift toward higher wavenumber in areas where acoustic power gets enhanced. Moreover, the phase velocity becomes faster in the sunspot penumbra possibly implying the presence of faster magnetoacoustic waves, and phase velocity becomes slower in the sunspot vicinity possibly implying a presence of slower magnetoacoustic waves in the area. It is interesting to note that in that same study by \inlinecitesch11, the modal-ridge lines showed less line-asymmetry than in the quiet-Sun region, again in an opposite sense to what is found inside a sunspot in this study. This is also a curious phenomenon, but it is not clear whether these opposite line-asymmetry trends are related to the different atmospheric heights of sunspot penumbra and sunspot vicinity, or related to the faster and slower magnetoacoustic waves discussed above.
The modal-ridge shift observed inside the sunspot may complicate the interpretation of the measured travel-time shifts or phase shifts in sunspot areas with an application of phase-velocity filter or a modal-ridge filter. Because these filters choose parameters based on quiet-Sun areas, the power ridges of sunspots may not be filtered in the same way as the power ridges of quiet-Sun areas due to that the modal ridges of sunspots are systematically located on lower-wavenumber (or higher-frequency) side. However, we believe the effect may not be significant, as \inlinecitezha10 showed that the measurements with and without using phase-speed filters gave results in a good qualitative agreement. This observed modal-ridge shift in sunspot regions may not have an effect in the ring-diagram derived subsurface properties in active regions, such as given by \inlinecitebal11, because acoustic power of the sunspot contributed little to the power spectrum used to do ring-diagram analysis that usually analyzes a much larger area than a sunspot.
5 Conclusion
sec5
By use of 40 hours of continuous SDO/HMI Doppler observations of a stable sunspot, we construct a – power-spectrum diagram that shows distinct modal ridges with suppressed helioseismic power. More notably, comparing with the – diagram obtained from a quiet-Sun region, the -mode ridge in the diagram of the sunspot gets more suppressed in power than -mode ridges, especially at high wavenumber. All -mode ridges shift toward lower-wavenumber (or higher-frequency) area for a given frequency (or wavenumber). The phase velocity computed from our fitted -mode ridges shows an increase of inside the sunspot region. Inclined magnetic field in the sunspot penumbra may be responsible for the -mode ridge shifts and the increase of the phase velocity. The line-profile asymmetries in the -mode ridges for the sunspot region are more prominent than the asymmetries observed in quiet Sun, and this may be relevant to the higher power absorption and suppression ratio in higher wavenumbers inside the sunspot. Convection inside the sunspot is also highly suppressed, but exhibits a characteristic spatial scale approximately larger than the typical granulation scale in the quiet Sun. Realistic MHD simulations of magnetoconvection with helioseismic waves included (e.g. \openciterem09) are very useful to understand all of these observed facts inside the sunspot region, and we expect that an analysis similar to what is presented in this study but using numerical simulation data will shed new light in a better understanding of the sunspot subsurface structure.
Acknowledgements
SDO is a NASA mission, and HMI project is supported by NASA contract NAS5-02139. We thank Mark Cheung for useful discussions on convection scales inside sunspots. We also thank the anonymous referee for useful comments to improve the quality of this paper.
References
- Baldner, Bogart, and Basu (2011) Baldner, C.S., Bogart, R.S., Basu, S.: 2011, J. Phys. Conf. Ser. 271, 012006.
- Basu, Antia, and Bogart (2004) Basu, S., Antia, H.M., Bogart, R.S.: 2004, ApJ 610, 1157.
- Braun, Duvall, and LaBonte (1987) Braun, D.C., Duvall, T.L. Jr., LaBonte, B.J.: 1987, ApJ 319, L27.
- Chou et al. (1992) Chou, D.-Y., Chen, C.-S., Ou, K.-T., Wang, C.-C.: 1992, ApJ 396, 333.
- Chou et al. (2009) Chou, D.-Y., Yang, M.-H., Zhao, H., Liang, Z.-C., Sun, M.-T.: 2009, ApJ 706, 909.
- Couvidat et al. (2012) Couvidat, S., Rajaguru, S.P., Wachter, R., Sankarasubramanian, K., Schou, J., Scherrer, P.H.: 2012, Sol. Phys. 278, 217. ADS:2012SoPh..278..217C, doi:10.1007/s11207-011-9927-y
- Duvall et al. (1993a) Duvall, T.L. Jr., Jefferies, S.M., Harvey, J.W., Osaki, Y., Pomerantz, M. A.: 1993a, ApJ 410, 829.
- Duvall et al. (1993b) Duvall, T.L. Jr., Jefferies, S.M., Harvey, J.W., Pomerantz, M. A.: 1993b, Nature 362, 430.
- Felipe, Khomenko, and Collados (2010) Felipe, T., Khomenko, E., Collados, M.: 2010, ApJ 719, 357.
- (10) Georgobiani, D., Stein, R.F., Nordlund, Å.: 2003, ApJ 596, 698.
- Georgobiani et al. (2007) Georgobiani, D., Zhao, J., Kosovichev, A.G., Benson, D., Stein, R.F., Nordlund, Å.: 2007, ApJ 657, 1157.
- Gizon et al. (2009) Gizon, L., Schunker, H., Baldner, C.S., Basu, S., Birch, A.C., Bogart, R.S., Braun, D.C., Cameron, R., Duvall, T.L., Hanasoge, S.M., et al.: 2009, Space Sci. Rev. 144, 249.
- Haber et al. (2004) Haber, D.A., Hindman, B.W., Toomre, J., Thompson, M.J.: 2004, Sol. Phys., 220, 371. ADS:2004SoPh..220..371H, doi:10.1023/B:SOLA-0000031405-52911-08.
- Hill (1998) Hill, F.: 1988, ApJ 333, 996.
- Howard (1990) Howard, R.F.: 1990, Sol. Phys., 126, 299. ADS:1990SoPh..126..299H, doi:10.1007/BF00153052.
- Kitiashvili et al. (2011) Kitiashvili, I.N., Kosovichev, A.G., Mansour, N.N., Wray, A.A.: 2011, Sol. Phys., 268, 283. ADS:2011SoPh..268..283K, doi:10.1007/s11207-010-9679-0.
- Komm et al. (2005) Komm, R., Howe, R., Hill, F., González Hernández, I., Toner, C., Corbard, T.: 2005, ApJ 631, 636.
- Kosovichev, Duvall, and Scherrer (2000) Kosovichev, A.G., Duvall, T.L. Jr., Scherrer, P.H.: 2000, Sol. Phys. 192, 159. ADS:2000SoPh..192..159K, doi:10.1023/A:1005251208431.
- Nagashima et al. (2007) Nagashima, K., Sekii, T., Kosovichev, A.G., Shibahashi, H., Tsuneta, S., Ichimoto, K., Katsukawa, Y., Lites, B., Nagata, S., Shimizu, T., et al.: 2007, PASJ 59, S631.
- Nigam et al. (1998) Nigam, R., Kosovichev, A.G., Scherrer, P.H., Schou, J.: 1998, ApJ 495, L115.
- Norton et al. (2006) Norton, A.A., Graham, J.P., Ulrich, R.K., Schou, J., Tomczyk, S., Liu, Y., Lites, B.W., López Ariste, A., Bush, R.I., Socas-Navarro, H., Scherrer, P.H.: 2006, Sol. Phys. 239, 69. ADS:2006SoPh..239…69N, doi:10.1007/s11207-006-0279-y.
- Penn and LaBonte (1993) Penn, M.J., LaBonte, B.J.: 1993, ApJ 415, 383.
- Rempel et al. (2009) Rempel, M., Schüssler, M., Cameron, R.H., Knölker, M.: 2009, Science 325, 171.
- Rhodes et al. (1997) Rhodes, E.J., Jr., Kosovichev, A.G., Schou, J., Scherrer, P.H., Reiter, J.: 1997, Sol. Phys. 175, 287. ADS:1997SoPh..175..287R, doi:10.1023/A:1004963425123.
- Scherrer et al. (1995) Scherrer, P.H., Bogart, R.S., Bush, R.I., Hoeksema, J.T., Kosovichev, A.G., Schou, J., Rosenberg, W., Springer, L.; Tarbell, T.D., Title, A., et al.: 1995, Sol. Phys. 162, 129. ADS:1995SoPh..162..129S, doi:10.1007/BF00733429.
- Scherrer et al. (2012) Scherrer, P.H., Schou, J., Bush, R.I., Kosovichev, A.G., Bogart, R.S., Hoeksema, J.T., Liu, Y., Duvall, T.L. Jr., Zhao, J., Title, A.M., et al.: 2012, Sol. Phys. 275, 207. ADS:2012SoPh..275..207S, doi:10.1007/s11207-011-9834-2
- Schou et al. (1998) Schou, J., Antia, H.M., Basu, S., Bogart, R.S., Bush, R.I., Chitre, S.M., Christensen-Dalsgaard, J., di Mauro, M.P., Dziembowski, W.A., Eff-Darwich, A., et al.: 1998, ApJ 505, 390.
- Schou et al. (2012) Schou, J., Scherrer, P.H., Bush, R.I., Wachter, R., Couvidat, S., Rabello-Soares, M.C., Bogart, R.S., Hoeksema, J.T., Liu, Y., Duvall, T.L. Jr., et al.: 2012, Sol. Phys. 275, 229. ADS:2012SoPh..275..229S, doi:10.1007/s11207-011-9842-2.
- Schunker and Braun (2011) Schunker, H., Braun, D.C.: 2011, Sol. Phys. 268, 349. ADS:2011SoPh..268..349S, doi:10.1007/s11207-010-9550-3.
- Schunker et al. (2008) Schunker, H., Braun, D.C., Lindsey, C., Cally, P.S.: 2008, Sol. Phys. 251, 341. ADS:2008SoPh..251..341S, doi:10.1007/s11207-008-9142-7.
- Zhao et al. (2012) Zhao, J., Couvidat, S., Bogart, R.S., Parchevsky, K.V., Birch, A.C., Duvall, T.L. Jr., Beck, J.G., Kosovichev, A.G., Scherrer, P.H.: 2012, Sol. Phys. 275, 375. ADS:2012SoPh..275..375Z, doi:10.1007/s11207-011-9757-y.
- Zhao, Kosovichev, and Sekii (2010) Zhao, J., Kosovichev, A.G., Sekii, T.: 2010, ApJ 708, 304.