Observable Vortex Properties in Finite Temperature Bose Gases
Abstract
We study the dynamics of vortices in finite temperature atomic Bose-Einstein condensates, focussing on decay rates, precession frequencies and core brightness, motivated by a recent experiment (Freilich et al. Science 329, 1182 (2010)) in which real-time dynamics of a single vortex was observed. Using the ZNG formalism based on a dissipative Gross-Pitaevskii equation for the condensate coupled to a semi-classical Boltzmann equation for the thermal cloud, we find a rapid nonlinear increase of both the decay rate and precession frequency with increasing temperatures. The increase, which is dominated by the dynamical condensate-thermal coupling is also dependent on the intrinsic thermal cloud collisional dynamics; the precession frequency also varies with the initial radial coordinate. The integrated thermal cloud density in the vortex core is for the most part independent of the position of the vortex (except when it is near the condensate edge) with its value increasing with temperature. This could potentially be used as a variant to the method of Coddington et al. (Phys. Rev. A 70, 063607 (2004)) for experimentally determining the temperature.
pacs:
03.75.Kk, 67.85.-dI Introduction
The existence of quantised vortices in Bose-Einstein condensates (BECs) is a feature of the superfluid nature of these systems (Barenghi et al., 2001). Since the first experimental realisation of vortices in BECs Matthews et al. (1999); Madison et al. (2001); Abo-Shaeer et al. (2001), there have been numerous investigations into the nature of their dynamics (see e.g. Fetter and Svidzinsky (2001)), ranging from their nucleation as a result of rotation (Sinha and Castin, 2001) (see also (Fetter, 2009) and references therein), to the effect of the inhomogeneous density on the velocity of a vortex (Sheehy and Radzihovsky, 2004; Jezek and Cataldo, 2008; Mason and Berloff, 2008), to the decay of a single vortex induced by sound emission (Vinen, 2001; Leadbeater et al., 2001, 2003; Parker et al., 2004, 2012), and the formation and structure of vortices in multicomponent (Mueller and Ho, 2002; Kasamatsu et al., 2003; Woo et al., 2007; Hsueh et al., 2011) and spinor BECs (Isoshima and Machida, 2002; Mizushima et al., 2002; Lovegrove et al., 2012). Vortices are now routinely created in a variety of ways, including stirring the condensate using a laser beam Madison et al. (2000); Raman et al. (2001), letting a soliton decay via the snake instability Anderson et al. (2001), phase imprinting Leanhardt et al. (2002), and by a rapid quench through the transition temperature for the onset of Bose-Einstein condensation (i.e. the Kibble-Zurek mechanism) Weiler et al. (2008); Freilich et al. (2010). These techniques have opened the door to the study of more complicated configurations, for instance, the motion of vortex dipoles Neely et al. (2010); Freilich et al. (2010), the formation of multiply charged vortices Leanhardt et al. (2002); Shin et al. (2004), vortex lattices (Hodby et al., 2001; Abo-Shaeer et al., 2002, 2001; Madison et al., 2001) and, more recently, the creation of a small tangle of vortices Henn et al. (2009, 2010); Shiozaki et al. (2011); Seman et al. (2011). The lifetime of vortex structures created in the laboratory can range up to several seconds. The reason for their eventual demise is thought to be thermal dissipation (Rosenbusch et al., 2002; Abo-Shaeer et al., 2002). At finite temperature, atom-atom interactions cause the vortex to lose energy; this results in the vortex spiralling out of a harmonically trapped condensate (see Fig. 3, top.); thus, the lifetime of a vortex is severely reduced with increasing temperature (Jackson et al., 2009). Earlier work on finite temperature vortex dynamics has confirmed this effect (Fedichev and Shlyapnikov, 1999; Schmidt et al., 2003; Duine et al., 2004; Wild and Hutchinson, 2009; Jackson et al., 2009; Wright et al., 2009, 2010; Rooney et al., 2010; rooney_neely_12, ). Along with the decay, the precession frequency of a singly-charged, harmonically trapped vortex has also been found to vary with temperature (Isoshima et al., 2004; Jackson et al., 2009; Wild and Hutchinson, 2009).
The motivation behind our work is twofold. Firstly we revisit the problem of vortex decay rate and precession frequency, using the only implementable model to date which includes the full thermal cloud dynamics (Zaremba et al., 1999); other approaches typically only include the dynamics up to a cutoff within classical field theory (which is more suitable in the fluctuation-dominated regime, very close to - see, for example, (Blakie et al., 2008)). Our study is motivated by a recent experiment (Freilich et al., 2010) which followed the motion of a single vortex in a harmonically trapped condensate using a new imaging technique. Secondly, we are interested in revisiting the experimental proposal of Coddington et al. (Coddington et al., 2004) regarding the use of finite temperature effects on vortex core ‘brightness’ as a possible tool for thermometry; at low temperatures it is difficult to accurately extract the temperature of a system of bosons, and since the mean-field felt by the thermal cloud in the region of the vortex core is much less than anywhere else in the condensate, the vortex core was said to act as a ‘thermal-atom concentration pit’ (Coddington et al., 2004). Virtanen et al. (Virtanen et al., 2001) have theoretically investigated the core brightness over a small range of temperatures, for a central vortex using the Hartree-Fock Bogoliubov theory within the ‘Popov’ approximation (Griffin, 1996), and found it to increase with temperature, as expected. We revisit this problem, using a fully dynamical theory Zaremba et al. (1999); Griffin et al. (2009), and determine the dependence of core contrast on both the radial component of the vortex and the temperature.
Our approach is based on the formalism of Zaremba, Nikuni and Griffin (ZNG) (Zaremba et al., 1999; Griffin et al., 2009), where the Gross-Pitaevskii equation (GPE) is generalised by the inclusion of the thermal cloud mean field, and a dissipative/source term which is associated with a collision term in a semi-classical Boltzmann equation for the thermal cloud. This approach has previously been used to successfully describe the damping of condensate collective modes (Williams and Griffin, 2001; Jackson and Zaremba, 2001; Jackson and Zaremba, 2002a, b; Jackson and Zaremba, 2003) and macroscopic excitations (Jackson et al., 2007a, b; Jackson et al., 2009) in the mean-field dominated regime at finite temperature; the method reduces to the damped two-fluid equations of 4He in the hydrodynamic limit (Zaremba et al., 1999; Nikuni et al., 1999; Nikuni and Griffin, 2001a, b; Nikuni and Griffin, 1998; Nikuni, 2002; Griffin and Zaremba, 1997; Nikuni and Griffin, 2004; Zaremba et al., 1998). This is the only model implemented to date which self-consistently accounts for all collisional dynamics of the system and is suited to elevated temperatures excluding the region of critical fluctuations.
The plan of this article is the following. In Section II we briefly review the ZNG equations (with some further details in Appendix A) and apply them to the problem of vortex decay at finite temperatures. Following the procedure of Jackson et al. (Jackson et al., 2009), we extract a decay rate for various temperatures for a fixed number of condensate atoms, and analyse the effect of collisions on the decay rate. In Section III, we use the same parameters to assess how increasing temperature affects the precession frequency of a vortex. In particular in Sec III.1 we extract precession frequencies of vortices for the parameters of the Freilich et al. (Freilich et al., 2010) experiment, where the total number of atoms are fixed. In Section IV we investigate vortex core brightness, and how it changes with radial position and temperature, and conclude by summarising our findings in Section V.
II Background, theory and motivation
In typical vortex experiments, the vortex core size is smaller than the wavelength of the light used to image it. As a result, to make the vortex visible it is necessary to expand the condensate (Madison et al., 2000). However, as a consequence of this expansion, the condensate is destroyed, requiring successive reproducible runs to observe time evolution of the vortex.
Freilich et al. (Freilich et al., 2010) developed an imaging technique, which involves the repeated extraction and expansion of approximately of the condensate atoms, thus enabling a series of images of the same condensate containing the vortex to be created. This technique allowed the precession frequency of the vortex to be measured.
We will now briefly discuss the ZNG equations and the advantages of using such a model before presenting our results.
II.1 The ZNG formalism
An extensive review of the ZNG formalism and its derivation can be found elsewhere (Zaremba et al., 1999; Griffin et al., 2009). Here it suffices to briefly outline the methodology. The formalism is based on the following closed set of equations (where the explicit dependence on and t is suppressed for convenience),
| (1) |
| (2) |
Here, is the condensate wavefunction and is a phase-space distribution function. Eq. (1) is a finite temperature generalisation of the usual Gross-Pitaevskii equation which is modified by the addition of a thermal cloud mean-field potential , and a dissipative/source term . It is coupled to the quantum Boltzmann equation (QBE, Eq. (2)) for the thermal cloud phase-space distribution. The condensate density is written as , is the external trapping potential, and the interaction strength between the atoms is , where is the -wave scattering length and is the atomic mass. The thermal cloud density is recovered from the phase-space distribution function via an integration over all momenta, and is the mean-field potential acting on the thermal atoms. The quantities and are collision integrals (definitions of these terms can be found in Appendix A). describes the redistribution of thermal atoms as a result of collisions between two thermal atoms, i.e. the usual Boltzmann equation collision integral, while , which is closely related to the dissipation term , describes the change in the phase-space distribution function as a result of particle-exchanging thermal atom-condensate collisions. Although other methods have been put forward for finite temperature vortex dynamics, to the best of our knowledge, this is the only method that self-consistently accounts for the redistribution of thermal particles and its effect this has on the condensate dynamics (Proukakis and Jackson, 2008).
II.2 Vortex Decay
Equations (1) and (2) have previously been used to study finite temperature vortex dynamics by Jackson et al. Jackson et al. (2009). In that work, the authors show that the decay rate of a vortex increases rapidly with increasing temperature. In these simulations, the system size was fixed to a constant total number of atoms, ; by increasing the temperature of the system, the number of thermal atoms increased and consequently the condensate size decreased. As both of these variations affect the vortex dynamics, in order to isolate the effect of increasing thermal atom number, in this work we instead initially perform simulations at different temperatures for a fixed number of condensate atoms, 87Rb atoms. By fixing the number of condensate atoms, the total number of atoms, increases with temperature, . As a result, the critical temperature, , for the onset of Bose-Einstein condensation is a function of in these simulations. We estimate by means of the ideal gas expression (note that, for atoms, the value of the critical temperature is nK).
The geometry is a fully three-dimensional (3D) harmonic trap, with trapping frequencies, Hz and Hz (Jackson et al., 2009). The purpose of the significantly tighter trapping frequency in the axial direction is to ensure that the vortex remains relatively straight along its length, as shown in Fig. 1 (left). This figure contains 3D isosurface plots of the condensate (left) and thermal cloud (right) densities. We have chosen a high density surface of the thermal cloud in order to show how the noncondensate atoms fill the vortex core and concentrate around the edges of the condensate.
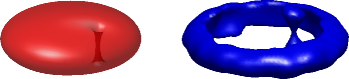
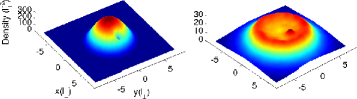
Figure 2, shows the densities of both components integrated along the direction. The relatively flat profile of integrated thermal density in Fig. 2 (right), illustrates how the thermal cloud surrounds the condensate, with the regions of highest concentration of noncondensate atoms corresponding to the condensate edge as well as position of the vortex (these are the areas where the thermal cloud feels the lowest mean-field repulsion from the condensate).
We extract the decay rate, , for vortices of different initial positions, by fitting the vortex radial variable to an exponential, , where is the initial vortex position. Results corresponding to three temperatures are plotted in Fig. 3, where trajectories are also shown. We express the vortex radial coordinate in terms of the Thomas-Fermi radius which is defined as , where is the chemical potential.
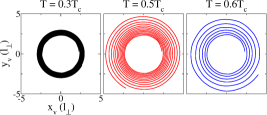
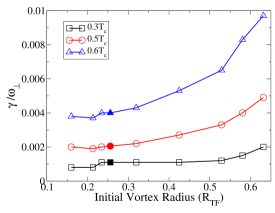
Increasing the temperature from to increases the decay rate significantly, in agreement with previous findings Fedichev and Shlyapnikov (1999); Duine et al. (2004); Jackson et al. (2009); Cox and Stamp (2012). It is also apparent that at all temperatures, moving the vortex initial radial coordinate away from the centre and closer to the condensate edge () results in an increase in vortex decay rate, . This feature is notably more pronounced at the higher temperatures, and is caused by the higher thermal cloud density towards the edge of the condensate (the maximum thermal cloud density occurs at the position ) which arises because of the weaker mean-field repulsion. We now discuss the effect of the individual collision terms of the QBE, Eq. (2), on the vortex decay rate as well as on the precession frequency of a vortex. We measure the precession frequency of a vortex as the inverse time it takes for one oscillation of the trap, calculated by averaging the oscillation time over the first three oscillations.
II.2.1 Effect of collisions on the vortex decay rate
We can carry out numerical simulations with the full QBE of Eq. (2), however, we can also simulate the effect of the thermal cloud with a combination of these collision terms, or without their inclusion at all.
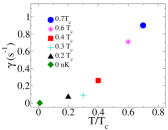
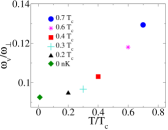
In this way, we can determine the contributions to the vortex decay rate coming from different collisional processes. Fig. 4 gives the results of vortex decay rate, , and precession frequency, for a vortex having an initial radial offset from the trap centre of , for various temperatures. The filled circles show the results for the full QBE simulation. Results are also shown for when the thermal-thermal, , collisions are neglected but the particle-exchanging, , collisions are included (magenta squares), and vice versa (blue pluses, consequently, when the dissipative/source term will also be zero). In the case when both of these terms are neglected (open, green circles), the QBE is propagated in time according to free streaming terms (left hand side of Eq. (2)), which ensures that the value of the phase-space distribution function remains the same along a trajectory in phase-space. We have also obtained results for a static thermal cloud (red stars), in which the mean-field of the equilibrium thermal cloud density (obtained in the absence of a vortex) is included in the solution of the GPE.
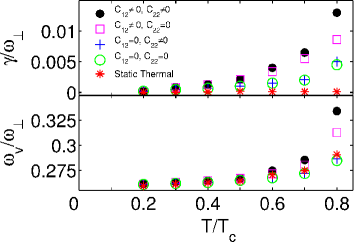
These results highlight the crucial role of all collision processes in determining the actual decay rate and precession frequency of a vortex.
Focussing initially on the decay rate (Fig. 4, top), we see that the largest contribution to vortex decay comes from the particle exchanging, , collisions. When the collisions are not included, the decay rate is reduced significantly. The thermal-thermal, , collisions have a noticeable effect only when they are included together with the particle-exchanging, , collisions. This implies that collisions affect the decay rate indirectly through a modification of the collision rates.
For the precession frequency of a vortex (Fig. 4, bottom), we see increasing values with increasing temperature, with the effect of the inclusion/absence of the different collision terms being more apparent at the higher temperatures. The largest influence on the precession frequency again arises from the particle-exchanging, , collisions - an effect which is intuitive since these collisions cause the vortex to lose energy and move out of the condensate radially.
To summarise, our analysis demonstrates the importance of including the full dynamics of the thermal cloud, i.e. all of the collision terms of the QBE when modelling vortex dynamics. All further results quoted have been simulated with all collision terms included in the propagation of Eq. (2). In the next section, we analyse further the dependence of the vortex precession frequency on temperature, as well as with increasing vortex radial coordinate.
III Precession frequency of a vortex
Our motivation for investigating further the effect of finite temperature on vortex precession arises from the development of a novel imaging technique (Freilich et al., 2010), enabling real-time vortex dynamics to be observed. To first understand the effect of the initial vortex position on its subsequent precession, we begin our analysis by extracting the precession frequencies for vortices having various different initial positions for a fixed temperature (Fig. 5 inset). The simulations are again carried out using the trapping parameters quoted in Sec. II.2 and a fixed number of condensate atoms, for various temperatures.
In the inset of Fig. 5 we plot the precession frequency as a function of vortex radial coordinate, , for initial positions in the range at the temperature .
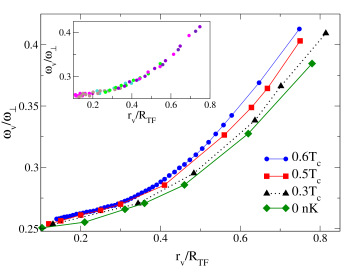
The general increase of the precession frequency with increasing vortex radial coordinate, , is apparent. The fact that all the points appear to lie on a common curve confirms numerically an important anticipated feature of vortex dynamics: the frequency of vortex precession depends on the instantaneous radial position and not on the history of how the vortex arrived at that position. We can therefore average over all the points to generate a representative curve for the frequency as a function of radial coordinate. This curve is shown in the main part of Fig. 5 (blue dots). Similar simulations were performed for the other temperatures displayed in Fig. 5. Fewer points are shown as these fully capture the investigated behaviour of the frequencies. It is clear that the precession frequency also increases with temperature as found for a particular value of , Fig. 4 (bottom).
Up until this point in this paper we have focussed on systems with a fixed , however, since experiments routinely conserve , all remaining simulations of this paper will be performed with a fixed total atom number, and variable condensate atom number.
In the experiment of Freilich et al. (Freilich et al., 2010) and in subsequent experimental runs by the group, the observed precession frequencies in a data set typically averaged a few () percent higher (Hall, 2011) than those predicted for a zero temperature, Thomas-Fermi condensate in an axisymmetric trap (Fetter and Svidzinsky, 2001; Fetter, 2009, 2010; Lundh and Ao, 2000). In the next section we will continue our analysis on vortex precession frequencies for parameters of this experiment at both zero and finite temperature, in order to investigate the origin of this deviation. We will begin by briefly remarking on the procedure of the experiment before presenting our results for those parameters.
III.1 Experimental Parameters of Freilich et. al (Freilich et al., 2010)
Vortices arise in this experiment during evaporation via the Kibble-Zurek mechanism (Kibble, 1976; Zurek, 1985; Anglin and Zurek, 1999; Svistunov, 2001); the procedure for imaging is as follows: approximately of the condensate atoms are outcoupled along the -axis so that they are no longer confined by the trap, and they therefore, fall with gravity (along ). This proportion expands and the position of the vortex can be resolved and measured. This leaves the remaining of the atoms trapped in the condensate and the vortex continues to precess in this slightly depleted condensate. At a later time, this process is repeated and the position of the vortex at that time also measured. The result is a series of images of vortex position which means that the real time dynamics of the vortex can be assessed. For the data presented in Ref. (Freilich et al., 2010) there was no discernible thermal cloud and the temperature was estimated to be .
As a result of this technique, a single vortex was observed for approximately ms hal , in a series of snapshots. Using these images, the precession frequency of the vortex line could be measured and the observed frequencies were found to average, in a typical data set, a few percent () higher (Hall, 2011) than those expected for the geometry and condensate parameters, given by the following equation:
| (3) |
which uses the Thomas-Fermi approximation for the shape of the condensate. This experiment was conducted in a disk shaped condensate with a total atom number of 87Rb atoms (we use for our simulations). The trapping frequencies are as follows: Hz, and , where , therefore, the aspect ratio is similar to that used in the previous section, ensuring that the vortex stays relatively straight throughout its motion.
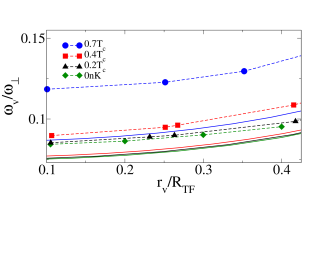
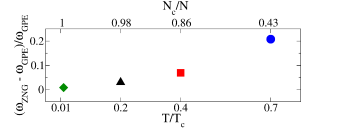
Fig. 6 (top) shows the ZNG results (dashed lines) for precession frequency as a function of vortex position for various temperatures (increasing from bottom to top) and the predictions of Eq. (3) for each temperature (solid lines). The bottom part of this plot gives the relative difference between the ZNG results for these temperatures and the corresponding zero temperature prediction obtained by solving the Gross-Pitaevskii equation. We solve the GPE for the number of atoms in condensate according to ZNG. We note that if we were to solve the GPE for the total number of atoms, the discrepancy between these results would be over for .
For a large condensate, it is natural to approximate using Thomas-Fermi theory via the expression of Eq. (3), however, comparison of the zero temperature GPE results with the prediction of Eq. (3), reveals that this prediction consistently underestimates the value of precession frequency. We find the relative difference between these results to be in the range for the parameters shown.
With increasing temperature, the ZNG results increasingly deviate from those obtained using the GPE for the same number of condensate atoms, therefore, the difference between the ZNG results and the predictions of Eq. (3) also increases with temperature (this behaviour is in rough agreement with the experimental observations (Hall, 2011)), and is approximately at the highest temperature of . Clearly, the TF formula (Eq. (3)) is inherently approximate and should be used with care.
A summary of the results of our simulations for the experimental parameters is shown in Fig. 7. The data for the decay rate, , and precession frequency, , are all obtained with an initial vortex radial position .
IV Vortex core brightness
The temperature of a system of bosons is commonly extracted by fitting a Gaussian profile to the high energy tails of the velocity distribution of the atoms (Ensher et al., 1996). These atoms are associated with the high energy, noncondensed atoms in the system and can be described by a Maxwell-Boltzmann velocity distribution. A limitation of this procedure is that it becomes difficult to accurately extract the temperature at low temperatures when the thermal cloud density is low. Since the thermal cloud density is relatively high in the region of the vortex core, a vortex acts as a ‘thermal-atom concentration pit’ (Coddington et al., 2004). This led Coddington et al (Coddington et al., 2004) to suggest that measuring the density in the core region could be a possible tool for determining the temperature of the system.
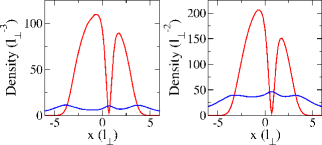
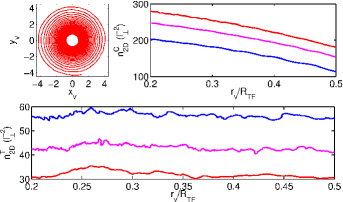
To perform a quantitative analysis of the thermal cloud density in the core, termed vortex core brightness (Coddington et al., 2004), we revert, for computational speed and efficiency, to a smaller system of atoms with a fixed total atom number of Rb atoms. Fig. 8 shows the condensate and thermal cloud local densities (left), and the densities integrated along the direction (right) in a harmonic trap with trapping frequencies Hz and , at a temperature of . For both of these quantities, the vortex core appears as a dip in the condensate density with a corresponding peak in the thermal cloud density. An interesting property of the integrated thermal cloud profile is that throughout the extent of the condensate, the integrated thermal cloud density is relatively uniform, except for the peak that still emerges in the region of the vortex core.
In Ref. (Coddington et al., 2004), the vortex core brightness was defined as
| (4) |
where is the observed atom density, integrated along the line of sight at the core centre (see Fig. 8 right) and is the projected integrated density at this point based on a smooth fit of the overall atom cloud. We extract the integrated thermal density, , at the central point of the vortex following this during its motion, which we refer to as . We calculate the projected integrated density, , at the same point as follows; we first run a simulation for the same parameters in the absence of a vortex and extract the integrated condensate density, henceforth denoted by , at the given position. The value of is then obtained by the addition of the integrated thermal cloud density in the vortex core, , with the projected integrated condensate density at that point, , i.e. .
We use the trapping parameters defined in Sec. II.2 and above, noting here again that we fix the total number of atoms in the system to be consistent with routine experimental procedures.
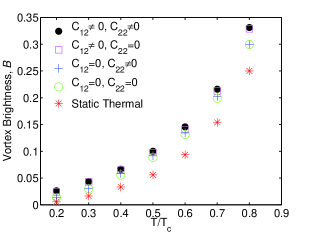
In Fig. 9 we plot vortex brightness, , at the vortex position for various temperatures. We see a clear trend in increasing brightness with increasing temperature for all approximations of the QBE, however, the value of the brightness is largest when the full QBE solved. We note again the importance of solving the full thermal cloud collisional dynamics in order to avoid underestimating the effect of the thermal cloud on vortex properties.
More detailed information is provided in Fig. 10. This figure shows the dependence of the integrated condensate (top row, right) and thermal cloud (bottom) densities along the vortex trajectory (top row, left). The initial vortex position is and the temperature is . We also display densities for two other, higher temperatures. There is a clear trend of increasing integrated thermal cloud density with temperature. On the other hand, as one would expect, the projected condensate density decreases with increasing temperature. Furthermore, as the vortex moves radially outwards, the integrated condensate density decreases whereas, the integrated thermal density stays relatively constant (except near the edge of the condensate, not shown here).
The results presented here indicate that core brightness, , may indeed be a good candidate for extracting temperature of a condensate containing a vortex. However, in order to make the method quantitative, one would have the take into account the dependence of on the radial position of the vortex. Since remains practically constant throughout the motion of the vortex through the condensate (Fig. 10 (bottom)), our analysis suggests that this quantity itself may provide a better measure of the temperature of the system.
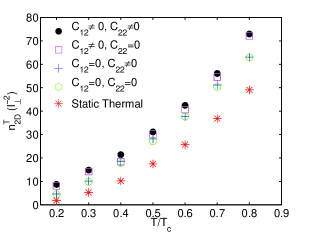
We therefore extract the value of for a range of temperatures in Fig. 11. For completeness, we also consider the effect of the various collisional approximations. We see that the sensitivity to the collision processes included is much less than that of the vortex decay rate or precession frequency (see Fig. 4).
V Conclusion
In summary, we have investigated observable properties of vortices at finite temperature, including decay rate, precession frequency and vortex core brightness, using a model which accounts for all collision processes between the atoms. Particle-exchanging collisions between the condensate and thermal cloud provide the dominant contribution, while thermal-thermal collisions further affect these particularly at temperatures in the region . While the decay rate of a vortex is dependent on initial vortex position, the precession frequency of a vortex is instead a function of the instantaneous vortex position; both quantities increase with increasing temperature. Furthermore, we have investigated the vortex precession frequency for the experimental parameters of Freilich et al. Science 329, 1182 (2010), and found that even at low temperatures, there is a deviation from the predictions of a Thomas-Fermi analysis. This deviation increases with temperature and can be as large as and should be detectable in future experiments.
We also found that the integrated thermal cloud density in the region of the vortex core remains relatively constant as the vortex spirals towards the edge of the condensate. This observation suggests that the integrated thermal density is perhaps a better probe of the temperature than total vortex brightness previously proposed by Coddington et al. Phys. Rev. A 70 063607 (2004).
VI Acknowledgements
We gratefully acknowledge D.S. Hall for providing us with experimental details and for useful suggestions during the course of this work; we also thank T.M. Wright for useful discussions. AJA, CFB and NNP acknowledge funding from the EPSRC (Grant number: EP/I019413/1). EZ gratefully acknowledges funding from NSERC of Canada.
Appendix A The mean-field potential and collision integrals
Within the ZNG formalism, the thermal excitations are assumed to be semiclassical moving in a HF potential, i.e. an excitation with momentum possesses energy where the effective potential, is defined as
| (5) |
The quantities and appearing in Eq. (2) are collision integrals. describes the redistribution of thermal atoms as a result of collisions between thermal atoms while describes the change in the phase-space distribution function as a result of particle-exchanging thermal-condensate collisions. These are respectively defined as
and
| (7) | |||||
The delta functions in these expressions enforce conservation of energy and momentum. In particular those in the term take into account that the condensate atoms have energy , and momentum , where is the condensate chemical potential.
If the condensed and noncondensed components are in diffusive equilibrium, . When they are out of equilibrium, this term acts to transfer atoms between the condensate and thermal cloud. This exchange results in the source term of Eq. (1),
| (8) |
The effects of in the kinetic equation together with in the generalised GPE ensure that the total particle number is conserved.
References
- Barenghi et al. (2001) C. Barenghi, R. Donnelly, W. Vinen (Eds.), Quantized Vortex Dynamics and Superfluid Turbulence (Springer, Berlin, 2001).
- Matthews et al. (1999) M. R. Matthews, B. P. Anderson, P. C. Haljan, D. S. Hall, C. E. Wieman, and E. A. Cornell, Phys. Rev. Lett. 83, 2498 (1999).
- Madison et al. (2001) K. W. Madison, F. Chevy, V. Bretin, and J. Dalibard, Phys. Rev. Lett. 86, 4443 (2001).
- Abo-Shaeer et al. (2001) J. R. Abo-Shaeer, C. Raman, J. M. Vogels, and W. Ketterle, Science 292, 476 (2001).
- Fetter and Svidzinsky (2001) A. L. Fetter and A. A. Svidzinsky, J. Phys.: Condens. Matter 13, R135 (2001).
- Sinha and Castin (2001) S. Sinha and Y. Castin, Phys. Rev. Lett. 87, 190402 (2001).
- Fetter (2009) A. L. Fetter, Rev. Mod. Phys. 81, 647 (2009).
- Sheehy and Radzihovsky (2004) D. E. Sheehy and L. Radzihovsky, Phys. Rev. A 70, 063620 (2004).
- Jezek and Cataldo (2008) D. M. Jezek and H. M. Cataldo, Phys. Rev. A 77, 043602 (2008).
- Mason and Berloff (2008) P. Mason and N. G. Berloff, Phys. Rev. A 77, 032107 (2008).
- Vinen (2001) W. F. Vinen, Phys. Rev. B 64, 134520 (2001).
- Leadbeater et al. (2001) M. Leadbeater, T. Winiecki, D. C. Samuels, C. F. Barenghi, and C. S. Adams, Phys. Rev. Lett. 86, 1410 (2001).
- Leadbeater et al. (2003) M. Leadbeater, D. C. Samuels, C. F. Barenghi, and C. S. Adams, Phys. Rev. A 67, 015601 (2003).
- Parker et al. (2004) N. G. Parker, N. P. Proukakis, C. F. Barenghi, and C. S. Adams, Phys. Rev. Lett. 92, 160403 (2004).
- Parker et al. (2012) N. G. Parker, A. J. Allen, C. F. Barenghi, and N. P. Proukakis, Phys. Rev. A 86, 013631 (2012).
- Mueller and Ho (2002) E. J. Mueller and T.-L. Ho, Phys. Rev. Lett. 88, 180403 (2002).
- Kasamatsu et al. (2003) K. Kasamatsu, M. Tsubota, and M. Ueda, Phys. Rev. Lett. 91, 150406 (2003).
- Woo et al. (2007) S. J. Woo, S. Choi, L. O. Baksmaty, and N. P. Bigelow, Phys. Rev. A 75, 031604 (2007).
- Hsueh et al. (2011) C.-H. Hsueh, T.-L. Horng, S.-C. Gou, and W. C. Wu, Phys. Rev. A 84, 023610 (2011).
- Isoshima and Machida (2002) T. Isoshima and K. Machida, Phys. Rev. A 66, 023602 (2002).
- Mizushima et al. (2002) T. Mizushima, K. Machida, and T. Kita, Phys. Rev. A 66, 053610 (2002).
- Lovegrove et al. (2012) J. Lovegrove, M. O. Borgh, and J. Ruostekoski, Phys. Rev. A 86, 013613 (2012).
- Madison et al. (2000) K. W. Madison, F. Chevy, W. Wohlleben, and J. Dalibard, Phys. Rev. Lett. 84, 806 (2000).
- Raman et al. (2001) C. Raman, J. R. Abo-Shaeer, J. M. Vogels, K. Xu, and W. Ketterle, Phys. Rev. Lett. 87, 210402 (2001).
- Anderson et al. (2001) B. P. Anderson, P. C. Haljan, C. A. Regal, D. L. Feder, L. A. Collins, C. W. Clark, and E. A. Cornell, Phys. Rev. Lett. 86, 2926 (2001).
- Leanhardt et al. (2002) A. E. Leanhardt, A. Görlitz, A. P. Chikkatur, D. Kielpinski, Y. Shin, D. E. Pritchard, and W. Ketterle, Phys. Rev. Lett. 89, 190403 (2002).
- Weiler et al. (2008) C. Weiler, T. W. Neely, D. R. Scherer, A. S. Bradley, M. J. Davis, and B. P. Anderson, Nature 455, 948 (2008).
- Freilich et al. (2010) D. V. Freilich, D. M. Bianchi, A. M. Kaufman, T. K. Langin, and D. S. Hall, Science 329, 1182 (2010).
- Neely et al. (2010) T. W. Neely, E. C. Samson, A. S. Bradley, M. J. Davis, and B. P. Anderson, Phys. Rev. Lett. 104, 160401 (2010).
- Shin et al. (2004) Y. Shin, M. Saba, M. Vengalattore, T. A. Pasquini, C. Sanner, A. E. Leanhardt, M. Prentiss, D. E. Pritchard, and W. Ketterle, Phys. Rev. Lett. 93, 160406 (2004).
- Hodby et al. (2001) E. Hodby, G. Hechenblaikner, S. A. Hopkins, O. M. Maragò, and C. J. Foot, Phys. Rev. Lett. 88, 010405 (2001).
- Abo-Shaeer et al. (2002) J. R. Abo-Shaeer, C. Raman, and W. Ketterle, Phys. Rev. Lett. 88, 070409 (2002).
- Henn et al. (2009) E. A. L. Henn, J. A. Seman, G. Roati, K. M. F. Magalhães, and V. S. Bagnato, Phys. Rev. Lett. 103, 045301 (2009).
- Henn et al. (2010) E. Henn, J. Seman, G. Roati, K. Magalh es, and V. Bagnato, Journal of Low Temperature Physics 158, 435 (2010).
- Shiozaki et al. (2011) R. Shiozaki, G. Telles, V. Yukalov, and V. Bagnato, Laser Physics Letters 8, 393 (2011).
- Seman et al. (2011) J. Seman, E. Henn, R. Shiozaki, G. Roati, F. Poveda-Cuevas, K. Magalh es, V. Yukalov, M. Tsubota, M. Kobayashi, K. Kasamatsu, et al., Laser Physics Letters 8, 691 (2011).
- Rosenbusch et al. (2002) P. Rosenbusch, V. Bretin, and J. Dalibard, Phys. Rev. Lett. 89, 200403 (2002).
- Jackson et al. (2009) B. Jackson, N. P. Proukakis, C. F. Barenghi, and E. Zaremba, Phys. Rev. A 79, 053615 (2009).
- Fedichev and Shlyapnikov (1999) P. O. Fedichev and G. V. Shlyapnikov, Phys. Rev. A 60, R1779 (1999).
- Schmidt et al. (2003) H. Schmidt, F. Goral, K. Floegel, M. Gajda, and K. Rzazewski, J. Opt. B: Quantum Semiclass 5, S96 (2003).
- Duine et al. (2004) R. A. Duine, B. W. A. Leurs, and H. T. C. Stoof, Phys. Rev. A 69, 053623 (2004).
- Wild and Hutchinson (2009) B. G. Wild and D. A. W. Hutchinson, Phys. Rev. A 80, 035603 (2009).
- Wright et al. (2009) T. M. Wright, A. S. Bradley, and R. J. Ballagh, Phys. Rev. A 80, 053624 (2009).
- Wright et al. (2010) T. M. Wright, A. S. Bradley, and R. J. Ballagh, Phys. Rev. A 81, 013610 (2010).
- Rooney et al. (2010) S. J. Rooney, A. S. Bradley, and P. B. Blakie, Phys. Rev. A 81, 023630 (2010).
- (46) S. J. Rooney, T. W. Neely, B. P. Anderson, A. S. Bradley, arXiv:1208.4421.
- Isoshima et al. (2004) T. Isoshima, J. Huhtamäki, and M. M. Salomaa, Phys. Rev. A 69, 063601 (2004).
- Zaremba et al. (1999) E. Zaremba, T. Nikuni, and A. Griffin, Journal of Low Temperature Physics 116, 277 (1999).
- Blakie et al. (2008) P. B. Blakie, A. S. Bradley, M. J. Davis, R. J. Ballagh, and C. W. Gardiner, Advances in Physics 57, 363 (2008).
- Coddington et al. (2004) I. Coddington, P. C. Haljan, P. Engels, V. Schweikhard, S. Tung, and E. A. Cornell, Phys. Rev. A 70, 063607 (2004).
- Virtanen et al. (2001) S. M. M. Virtanen, T. P. Simula, and M. M. Salomaa, Phys. Rev. Lett. 86, 2704 (2001).
- Griffin (1996) A. Griffin, Phys. Rev. B 53, 9341 (1996).
- Griffin et al. (2009) A. Griffin, T. Nikuni, and E. Zaremba, Bose-condensed gases at finite temperatures (Cambridge University Press, 2009).
- Williams and Griffin (2001) J. E. Williams and A. Griffin, Phys. Rev. A 63, 023612 (2001).
- Jackson and Zaremba (2001) B. Jackson and E. Zaremba, Phys. Rev. Lett. 87, 100404 (2001).
- Jackson and Zaremba (2002a) B. Jackson and E. Zaremba, Phys. Rev. Lett. 88, 180402 (2002a).
- Jackson and Zaremba (2002b) B. Jackson and E. Zaremba, Laser Phys. 12, 93 (2002b).
- Jackson and Zaremba (2003) B. Jackson and E. Zaremba, New Journal of Physics 5, 88 (2003).
- Jackson et al. (2007a) B. Jackson, C. Barenghi, and N. Proukakis, J. Low Temp. Phys. 148, 387 (2007a).
- Jackson et al. (2007b) B. Jackson, N. P. Proukakis, and C. F. Barenghi, Phys. Rev. A 75, 051601 (2007b).
- Nikuni et al. (1999) T. Nikuni, E. Zaremba, and A. Griffin, Phys. Rev. Lett. 83, 10 (1999).
- Nikuni and Griffin (2001a) T. Nikuni and A. Griffin, Phys. Rev. A 63, 033608 (2001a).
- Nikuni and Griffin (2001b) T. Nikuni and A. Griffin, Phys. Rev. A 65, 011601 (2001b).
- Nikuni and Griffin (1998) T. Nikuni and A. Griffin, Journal of Low Temperature Physics 111, 793 (1998).
- Nikuni (2002) T. Nikuni, Phys. Rev. A 65, 033611 (2002).
- Griffin and Zaremba (1997) A. Griffin and E. Zaremba, Phys. Rev. A 56, 4839 (1997).
- Nikuni and Griffin (2004) T. Nikuni and A. Griffin, Phys. Rev. A 69, 023604 (2004).
- Zaremba et al. (1998) E. Zaremba, A. Griffin, and T. Nikuni, Phys. Rev. A 57, 4695 (1998).
- Proukakis and Jackson (2008) N. P. Proukakis and B. Jackson, Journal of Physics B: Atomic, Molecular and Optical Physics 41, 203002 (2008).
- Cox and Stamp (2012) T. Cox and P. C. E. Stamp, ArXiv e-prints (2012), eprint 1207.4237.
- Hall (2011) D. S. Hall, Private communication (2011).
- Fetter (2010) A. L. Fetter, J. Low Temp. Phys. 161, 445 (2010).
- Lundh and Ao (2000) E. Lundh and P. Ao, Phys. Rev. A 61, 063612 (2000).
- Kibble (1976) T. Kibble, J. Phys. A: Math. Gen. 9, 1387 (1976).
- Zurek (1985) W. H. Zurek, Nature 317, 505 (1985).
- Anglin and Zurek (1999) J. R. Anglin and W. H. Zurek, Phys. Rev. Lett. 83, 1707 (1999).
- Svistunov (2001) B. Svistunov, Phys. Lett. A 287, 169 (2001).
- (78) The image at the time ms was of the remnant condensate.
- Ensher et al. (1996) J. R. Ensher, D. S. Jin, M. R. Matthews, C. E. Wieman, and E. A. Cornell, Phys. Rev. Lett. 77, 4984 (1996).