Fluorine variations in the globular cluster NGC 6656 (M22):
implications for internal enrichment timescales111Based on observations taken with ESO telescopes under program 087.0319(A)
Abstract
Observed chemical (anti)correlations in proton-capture elements among globular cluster stars are presently recognized as the signature of self-enrichment from now extinct, previous generations of stars. This defines the multiple population scenario. Since fluorine is also affected by proton captures, determining its abundance in globular clusters provides new and complementary clues regarding the nature of these previous generations, and supplies strong observational constraints to the chemical enrichment timescales. In this paper we present our results on near-infrared CRIRES spectroscopic observations of six cool giant stars in NGC 6656 (M22): the main objective is to derive the F content and its internal variation in this peculiar cluster, which exhibits significant changes in both light- and heavy- element abundances. We detected F variations across our sample beyond the measurement uncertainties and found that the F abundances are positively correlated with O and anticorrelated with Na, as expected according to the multiple population framework. Furthermore, our observations reveal an increase in the F content between the two different sub-groups, -process rich and -process poor, hosted within M22. The comparison with theoretical models suggests that asymptotic giant stars with masses between 4 and 5M⊙ are responsible for the observed chemical pattern, confirming evidence from previous works: the difference in age between the two sub-components in M22 must be not larger than a few hundreds Myr.
Subject headings:
globular clusters: individual (NGC 6656) —stars:abundances —:stars: AGB and post-AGB— stars: Population II —1. Introduction
Although Galactic globular clusters (GCs) display a distribution in their global parameters (e.g., mass, metallicity, concentration, horizontal-branch morphology), the internal variation of elements affected by proton captures (hereafter -capture elements) appears a ubiquitous feature (2009a,b). It is clear that GC stars exhibit large changes in the C, N, O, Na, Mg, and Al abundances, whereas (in archetypical systems at least) internal spreads in iron-peak, heavy - (Ca, Ti) and neutron-capture (-process) elements all remain within observational uncertainties (2009c, 2010a; James et al. 2004; Smith 2008; D’Orazi et al. 2010). The changes in the -capture elements give rise to a clear chemical pattern: depletion in C, O, and Mg abundances always correspond to enhancements in N, Na, and Al (the so-called light-element anticorrelations). This behavior bears the evidence of H burning at high temperature and points to the presence of multiple stellar generations. It is argued that the ejecta from a fraction of first generation of stars (initially C-O-Mg rich, sharing the same chemical composition of field stars at the same metallicity) mix with primordial gas, providing a medium from which the second generation stars (C-O-Mg poor and N-Na-Al rich) formed. We refer the reader to Gratton et al. (2012) for a recent, extensive review on this topic. In this scenario, the H-burning abundance patterns from the first generation stars are imprinted in the second generation and are present from birth. The nature of the stars that enriched the intercluster gas remains uncertain but possible candidates include intermediate-mass asymptotic giant branch (AGB) stars undergoing hot bottom burning (HBB, e.g., D’Antona et al. 1983; Ventura et al. 2001), fast rotating massive stars (e.g., Decressin et al. 2007), massive binaries (de Mink et al. 2009), and novae (Smith & Kraft 1996; Maccarone & Zurek 2012).
Interestingly, this already complex picture is further obfuscated by the presence of some peculiar clusters, such as Centauri (Johnson & Pilachowski 2010; Marino et al. 2011a), NGC 1851 (Yong & Grundahl 2008; 2010a), Terzan 5 (Ferraro et al. 2009), NGC 6715 (M54, 2010b), and NGC 2419 (Cohen et al. 2011, see however Mucciarelli et al. 2012 for a different view). In these GCs, along with changes in -capture elements, internal variations in the heavy element abundances have been detected. Species ranging from the iron-peak (e.g., Fe) to the -process elements (Ba, La) vary stochastically from cluster to cluster beyond what is expected from observational errors.
The metal-poor GC NGC 6656 (M22, [Fe/H]222We use the notation [X/H]=A(X)A(X)⊙, where A(X)=log()+12=1.70 Harris 1996 -updated in 2010) belongs to this class of GCs, and due to its peculiar nature has received extensive attention (Pilachowski et al. 1982; Norris & Freeman 1983; Brown & Wallerstein 1992; Kayser et al. 2008; Marino et al. 2009; Da Costa et al. 2009; Da Costa & Marino 2010; Alves-Brito et al. 2012). Recently, Marino et al. (2011b, hereafter MSK11) presented results from their high-resolution spectroscopic study of 35 giant stars, deriving abundances for iron-peak, , -capture, and neutron-capture elements. This detailed abundance analysis provided a unique opportunity to investigate the chemical enrichment history of M22.
This GC is comprised of two distinct groups of stars, characterised by an offset in metallicity and in -process element content. The first group displays a metallicity of [Fe/H]=1.820.02 with [/Fe]=0.010.01 and the second group has [Fe/H]=1.670.01 with [/Fe]=+0.350.02. Note that the [/Fe] ratios were computed by averaging the abundances of Y, Zr, Ba, La, Nd (see MSK11 for details). Each of these two sub-groups exhibits the classical Na-O and C-N anticorrelations shown by the archetypical GCs. Given that the [Eu/Fe] ratio serves as a neutron-capture (-process) tracer333In the Solar System, 97% of Eu was synthesized via the -process (2000, and references therein). and that enhancements in the -process elements are not accompanied by a similar trend in the [Eu/Fe] ratio, it can be inferred that the dichotomy in the -capture abundances may be due to a first generation of polluters that produced the -process only. One possible scenario, which was advocated by MSK11, is that the -process component activated in stars with masses larger than 25 M⊙ during core He-burning and C-shell phases (Raiteri et al. 1993; Pignatari et al. 2010), may have contributed to the observed abundance patterns. However, in a complimentary study, Roederer et al. (2011) focused on the heavy element content (from Y to Th) of six stars across the two stellar sub-groups, and ruled out the massive star origin. They concluded that the gas from which the second stellar population formed was enriched in -process material from a class of relatively massive AGB stars (M 5 M⊙). In these stars, the production of -process elements is due to the activation of the 22Ne(,n)25Mg neutron source, whereas in their lower-mass counterparts the main neutron source is the 13C(,n)16O reaction (Busso et al. 1999).
Neither of the proposed scenarios provides a comprehensive explanation for all the observed chemical features and we are left with numerous unsolved issues. For example, Roederer et al. (2011) question why the -process dichotomy is only present in M22: if massive AGB stars are the cause of the GC Na-O anticorrelation, then all clusters should present the -process elements correlated with Na and anti-correlated with O, which is not observed (e.g., D’Orazi et al. 2010).
In this paper we turn to an alternative diagnostic. We present fluorine abundances for a sample of six cool giant stars in M22, carefully selected from both sub-stellar groups as defined by MSK11. Fluorine abundances are a powerful tracer of the polluter mass range in M22 because the F production is highly dependent on the stellar mass.
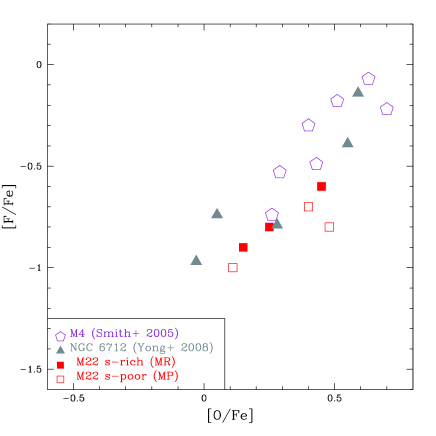
Theoretical models of AGB stars (e.g., Jorissen et al. 1992) predict that F is produced due to the activation of the chain of reactions 18O(p,)15N(,)19F in the He intershell during the recurrent thermal pulses associated with He burning. During the early phases of each thermal pulse, the H-burning ashes are ingested in the convective region developing in the He intershell. These ashes are rich in 13C and 14N and their ingestion in the He-burning layer results in production of 18O due to captures on 14N. At the same time protons are released by the 14N(n,p)14C reaction, with neutrons coming from 13C(,n)16O. After the quenching of each thermal pulse the envelope may sink in mass deep in the He intershell and carry 19F to the convective envelope via a process known as the “third dredge-up” (TDU). The peak of F production in AGB stars is reached for stars of initial masses 2 M⊙ (Lugaro et al., 2004). If the mass of the stars is higher than roughly 5 M⊙, and depending on the metallicity, fluorine is destroyed both via captures in the He intershell, and via proton captures at the base of the convective envelope due to HBB. AGB stars that experience HBB can also destroy O and Mg and produce Na and Al; as a consequence, according to the multiple population scenario, we should expect the abundances of F to be correlated with O (and Mg) and anti-correlated with those of Na (and Al). This prediction was observationally confirmed by Smith et al. (2005) in the intermediate-metallicity GC M4 and by Yong et al. (2008) in NGC 6712.
Other sites have also been suggested for F production: the -process in core-collapse supernovae (Woosley et al. 1990), and core He burning in Wolf-Rayet stars (Meynet & Arnould 2000; Palacios et al. 2005). However, low-mass AGB stars are the only site observationally confirmed (Jorissen et al. 1992; Abia et al. 2010).
2. Observations
Our sample includes six giant stars, for which stellar parameters (Teff, log, [Fe/H] and microturbulence ) along with -capture and -process element abundances were derived by MSK11. We selected three stars belonging to the metal-poor component (MP, also -process poor) and three stars from the metal-rich (MR, -process rich) one. Within each of these sub-groups we also selected both O-rich (Na-poor) and O-poor (Na-rich) stars, spanning a range from [O/Fe]=+0.11 to [O/Fe]=+0.48 dex.
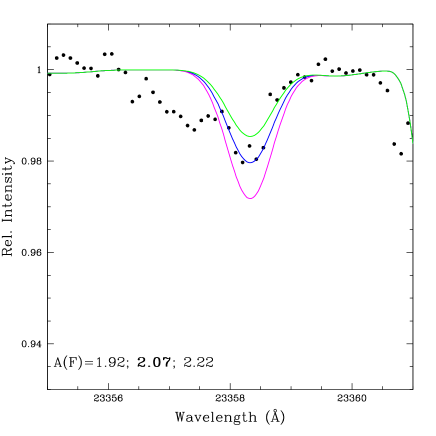
The main objective of our investigation was the determination of the fluorine abundances. Observationally, F (whose only stable isotope is 19F) is difficult to detect spectroscopically; the only atomic lines (the ground-state transitions of F i) that might be revealed lie in the far UV. On the other hand, HF molecular transitions are easily observable in the near-infrared (around 23000 Å). Our analysis focuses on the HF(10) R9 transition, located at 23358.3 Å. Although not being the strongest feature in this wavelength range, this line is considered to be one of the best abundance indicator for F, because it is free of blends (Abia et al. 2009; Lucatello et al. 2011).
| Star | RA | Dec | V | K | Exposures | S/N |
|---|---|---|---|---|---|---|
| (hh:mm:ss) | (o:’:”) | (mag) | (mag) | (s) | ||
| IV-97 | 18:36:41.06 | 23:58:18.9 | 11.043 | 6.759 | 10x90s | 300 |
| III-14 | 18:36:15.10 | 23:54:54.6 | 11.134 | 6.743 | 17x120s | 400 |
| III-15 | 18:36:15.61 | 23:55:01.2 | 11.362 | 7.138 | 8x180s | 300 |
| C | 18:36:10.21 | 23:48:44.0 | 11.309 | 6.737 | 6x180s | 300 |
| III-52 | 18:36:10.18 | 23:54:21.8 | 11.526 | 7.459 | 10x180s | 350 |
| V-2 | 18:36:28.02 | 23:55:01.6 | 11.498 | 7.276 | 14x120s | 350 |
High-resolution, near-infrared spectroscopic observations were carried out in service mode with CRIRES (CRyogenic high-resolution InfraRed Echelle Spectrograph, Kaeufl et al. 2004) located at VLT UT1 on 2011 April, July and August (program: 087.0319(A), PI: VD). In Table 1, we list information on target stars, reporting identifications, magnitudes (see MSK11 for details), exposure times, and S/N ratios per pixel around the HF feature. Note that our selection was limited to the cooler stars in the MSK11’s sample due to our imposed requirement of relatively strong HF lines. We also observed several (hot) early-type stars before and/or after of each target observations, in order to remove telluric contamination from our scientific frames.
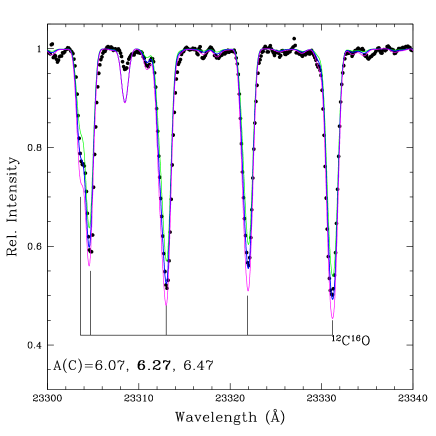
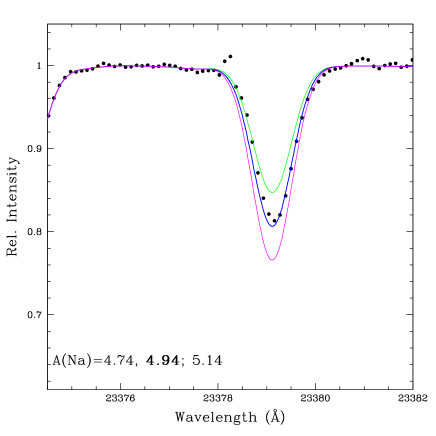
We employed the 0.4 slit and the grating order #24, achieving a resolution of 50,000 and a wavelength coverage from 22948.5 Å to 23410.3 Å. This allowed us to include the HF(10) R9 line, numerous 12C16O vibration/rotation lines (used to derive C abundances) and the Na i line at 23379 Å.
Data reduction was accomplished by means of the CRIRES pipeline (version 2.4), running under the gasgano environment444http://www.eso.org/sci/software/gasgano/, which provides one-dimensional, wavelength calibrated spectra. Telluric feature subtraction, rest-frame translation and continuum normalization were then carried out within IRAF555IRAF is the Image Reduction and Analysis Facility, a general purpose software system for the reduction and analysis of astronomical data. IRAF is written and supported by National Optical Astronomy Observatories (NOAO) in Tucson, Arizona.. An example of our spectra is shown in Figure 1 for star III-52; HF, CO and Na i lines are marked.

3. Abundance analysis
Fluorine abundances were determined through spectral synthesis using the MOOG code (Sneden 1973, 2011 version) and the Kurucz (1993) set of stellar atmosphere models (with no overshooting) as in MSK11’s analysis, from which we retrieved stellar parameters as well as O and -process element abundances. However, had we instead adopted the MARCS grid (Gustafsson et al. 2008), the difference on the resulting abundances would have been less than 0.04 dex.
Concerning the HF feature, we took as excitation potential (EP) =0.227 eV (Decin 2000) and a log=3.971 (Lucatello et al. 2011). This last value is very close to that used in previous studies focusing on F abundance determination in GCs (e.g., Smith et al. 2005; Yong et al. 2008; Alves-Brito et al. 2012), log=3.955 (from Jorissen et al. 1992). On the other hand, our EP is about 0.25 eV lower compared to those works: this difference implies an offset between our abundances and those previously published in the literature of roughly 0.30 dex (see also the discussion in Section 4.1). Furthermore, we derived C abundances. For this purpose, we assumed O values from the optical range given by MSK11, since our spectra did not cover any suitable OH line, whose stronger transitions extend in the band (around 15000Å). The CO line lists come from B. Plez (private communication). Finally, for the Na i line at 23379, atomic parameters (=3.750 eV; log=0.530) were taken from VALD666Vienna Atomic Line Database (www.astro.uu.se/ vald/php/vald.php).
As a first step, we checked our line list on the infra-red atlas of the Arcturus spectrum (Hinkle et al. 1995, available at ftp://ftp.noao.edu/catalogs/arcturusatlas/). Assuming a Teff=4286 K, log=1.67, =1.74 kms-1 and [Fe/H]=0.52 (following Ramírez & Allende Prieto 2011) we obtained an [F/Fe]=0.15777We used as solar fluorine abundances A(F)⊙=4.56 (Anders & Grevesse 1989; Asplund et al. 2005)., to be compared to the value given by Abia et al. (2009) of [F/Fe]=0.10 dex. The difference is completely explained by the higher EP adopted in that study.
Moreover, we inferred a C abundance of A(C)=8.01 (under the assumption that A(O)=8.81, that is [O/Fe]=0.40, with a solar abundance of A(O)⊙=8.93), which is in very good agreement with values of Abia et al. (2009) (i.e., A(C)=8.06) and Ryde et al. (2010) (A(C)=8.08). As for C solar abundance we adopted the value of A(C)⊙=8.56, leading to [C/Fe]=0.03.
Finally, from the Na i feature at 23379Å, we derived A(Na)=6.01 which results in [Na/Fe]=+0.2 dex (setting A(Na)⊙=6.33).
Comparison between synthetic and observed spectra were carried out in a similar way for our sample stars; an example of spectral synthesis is given in Figures 2 and 3 for star C.
The sensitivity of the F abundance to input stellar parameters was evaluated by separately changing effective temperature, surface gravity and microturbulence values. The intensity of the synthetic line of the HF is particularly sensitive to the adopted Teff, the other parameters affecting it at a lower degree (see also Abia et al. 2009; 2011). A change of (Teff)=+70 K, (log)=+0.15, and ()=+0.13 km s-1 (conforming to error estimates given in Table 4 of MSK11) results in a difference in A(F) of +0.10, 0.02 and 0.02 dex, respectively. The variation of the input metallicity in the model atmosphere has instead a negligible effect. These are the typical uncertainties that we then summed in quadrature providing a total error, due to stellar parameters, of 0.11 dex in our [F/H] ratios. Errors due to the best-fit determination (related to the S/N of the spectra and including uncertainties due to the continuum placement) are instead 0.07 dex. However, we caution the reader that this value should be treated as a lower limit, since the impact of the telluric correction on this considerably weak feature is significant (see Section 4).
The total internal error in [F/H] is then obtained adding in quadrature both uncertainties, resulting in 0.13 dex.
Finally, as far as C and Na are concerned, the typical uncertainties are 0.12 and 0.10 dex, respectively.
4. Results
| Star | Teff∗ | ∗ | [Fe/H]∗ | ∗ | [O/Fe]∗ | -rich∗ | [C/Fe] | [F/Fe] | [Na/Fe] |
| (K) | (cms-2) | (kms-1) | |||||||
| IV-97 | 4000 | 0.05 | 1.94 | 2.00 | 0.40 | no | 1.10 | 0.70 | 0.40 |
| III-14 | 4030 | 0.35 | 1.82 | 2.15 | 0.48 | no | 1.10 | 0.80 | 0.30 |
| III-15 | 4070 | 0.40 | 1.82 | 1.85 | 0.11 | no | 1.15 | 1.00 | 0.34 |
| C | 3960 | 0.30 | 1.69 | 2.25 | 0.25 | yes | 0.60 | 0.80 | 0.30 |
| III-52 | 4075 | 0.60 | 1.63 | 1.75 | 0.45 | yes | 0.10 | 0.60 | 0.05 |
| V-2 | 4130 | 0.65 | 1.57 | 1.75 | 0.15 | yes | 0.40 | 0.90 | 0.31 |
| ∗ from MSK11. |
Our results are shown in Table 2, where we report stellar parameters and abundances from MSK11 along with our estimates for F, C, and Na. Even within our quite limited sample (six stars), we found that the F abundance shows a large star-to-star variation, ranging from [F/H]=2.82 dex to [F/H]=2.23 dex (i.e., a factor of 4). The average abundance is [F/H]=2.550.08 (rms=0.20), implying that the amplitude of this change is beyond the measurement uncertainties (see Section 3). Moreover, taking into account the typical errors for O and F abundances, our study suggests that the F variation is comparable with that of O, as also found by Yong et al. (2008) in the GC NGC 6712.


In Figures 4 and 5 we plot [F/H] ratios as a function of [O/H] and [Na/H], respectively. As one can see, F abundances are positively correlated with O: considering the whole sample, the Pearson correlation coefficient results in =0.89, with a probability to be random smaller than 2%. Focusing on the F-Na diagram (Figure 5), there is the hint for a F-Na anticorrelation, but in our small sample the linear correlation coefficient is not statistically meaningful. However, this does not prove the lack of an anticorrelation, because we are dealing with small numbers (only six points), heavily reducing the power of statistical tests. In addition, there is no a priori reason why we should combine the two sub-groups as far as the F-Na plane is concerned, because we do not expect that they must behave in the same way. If we look at each component separately the presence of a F-Na anticorrelation is indeed much more evident (given that we have only three points for each group, it is not meaningful to perform a statistical test separately).
The observed chemical pattern can be explained as the evidence of H-burning at high temperature, via the CNO cycle, which causes the destruction of F, in conjunction with O depletion and Na enhancement. More interestingly, those (anti)correlations are revealed in each of the M22 sub-components (the -rich and -poor groups); the implications of this finding are discussed in detail in Section 5.
Regarding Na, we show both our estimate from near-infrared spectroscopy as well as LTE abundances from the optical range by MSK11 (right and left-hand panels of Figure 5). A difference of ([Na/Fe])=0.310.04 (rms=0.09) dex is found between the two estimates (see Figure 6) where we compare the two measurements; non-LTE effects can totally account for such a discrepancy (e.g., Lind et al. 2011). The total average Na abundance is [Na/Fe]=0.050.13 (rms=0.33); considering separately the two groups we obtain instead a [Na/Fe]s-poor=0.120.23 and [Na/Fe]s-rich=+0.220.08, which implies [Na/Fe]=0.340.17 dex. This value is in good agreement with that derived by MSK11, based on the whole sample of 35 giants, being [Na/Fe]=0.230.07.

Finally, our sample displays an average C abundance of [C/Fe]=0.740.18, with [C/Fe]s-poor=1.120.02 and [C/Fe]s-rich=0.370.14. Thus, on average, -rich stars exhibit larger C abundances, which qualitatively agrees with previous works (e.g., Brown et al. 1990). However, while the difference between the two groups from the optical CH bands derived by MSK11 is [C/Fe]=0.350.13 dex, we achieved a much larger value of [C/Fe]=0.750.10 dex. The same conclusion was reached by Alves-Brito et al. (2012) who found a variation of [C/Fe]=0.780.15 dex, from high-resolution, near-infrared spectroscopy of nine cool giants (see also Section 4.1). The reason of such a difference in C abundance from the optical and from the near-infrared is not clear and no obvious trends with stellar parameters (e.g., temperature, gravity, microturbulence, and/or metallicity) seem to be present. Further investigations are needed to explore this issue.
4.1. Comparison with Alves-Brito et al. (2012)
In a recent paper, Alves-Brito et al. (2012) carried out high-resolution (=50,000), near-infrared (both and bands) spectroscopic observations with Phoenix@Gemini-South of nine red giant branch (RGB) stars in M22. They investigated their F content, presenting also C, N, O, Na and Fe abundances.
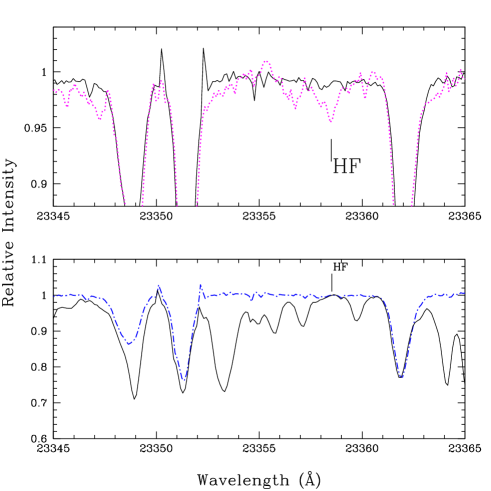
Four of our six stars are in common with that study, namely, III-14, III-15, III-52 and IV-97. For stars III-14 and III-52, those authors inferred [F/Fe]=0.40 and [F/Fe]=0.20 dex, respectively, while we obtained [F/Fe]=0.80 and [F/Fe]=0.60 dex. The adopted EP value can easily justify this divergence, accounting for about 0.30 dex (see Section 3); the source of the remaining 0.1 dex can be ascribed to the continuum placement, which is critical in determining abundances from such a weak line. On the other hand, for stars III-15 and IV-97 Alves-Brito et al. (2012) obtained [F/Fe]=0.28 and [F/Fe]=0.25 dex, entailing discrepancies with our estimates larger than a factor 10. Note that stellar parameters (Teff, log, and ) are the same in both works, as they come from the analysis of MSK11; for the input metallicity, Alves-Brito et al. used instead their own values coming from the IR spectroscopy and showing an offset of +0.13 dex compared to the optical ones. We investigated the nature of this substantial discordance, and attributed it to the telluric feature subtraction. In the upper panel of Figure 7, we directly compare our spectrum for star III-15 (solid line) with that used by Alves-Brito et al. (dotted line). Their spectrum presents stronger features in the vicinity of HF line, features expected from telluric contribution. To completely remove the contamination, Alves-Brito et al. realized that they needed early-type star targets before and/or after each scientific frame but the logistics of their run made this very difficult. We instead could observe such targets: the correction to our data, in turn affects the placing of the continuum and removes many strong features (as shown in the lower panel of Figure 7). As expected, such an effect is significant for the HF feature, due to its intrinsic weakness, but only marginally affects the C and Na abundance determinations (due to the strength of their lines), and hence most of the conclusions of that paper. This is shown in Figure 8, where we plot our [X/Fe] ratio as a function of those from Alves-Brito et al. (2012) for the four stars in common: C and Na are comparable between the two studies, with differences of [C/Fe]=+0.200.17 dex and [Na/Fe]=+0.180.11 dex (in the sense Alves-Brito’s study minus our values); if we take into account the offsets in [Fe/H] and in the adopted solar abundances (they assumed A(C)⊙=8.42 and A(Na)⊙=6.17), those values become [C/Fe]=+0.190.17 and [Na/Fe]=+0.150.11 dex. On the other hand, discrepancies in F are significant and cannot be recovered from the different EP and/or solar abundances, being for the whole sample of [F/Fe]=+0.750.19 dex.

5. Discussion
Our main result is the detection of F variations across our sample significantly larger than the observational uncertainties. As shown in Figures 4 and 5, the changes in the F abundances are correlated with O and anticorrelated with Na. This chemical pattern qualitatively matches the predictions from the multiple population scenario, according to which the stellar ejecta from which second generation stars formed carry the signature of hot H burning causing enhancements in Na (N and Al) and depletions in O and F (C and Mg). The F-O diagram presented in Figure 9 demonstrates that M22 shares a similar behaviour as M4 and NGC6712, the other two GCs for which F has been explored888Cunha et al. (2003) presented F abundances for two giants in Cen. However, they provide an F measurement only for star ROA219, giving an upper limit for star ROA 324. Discussion related to the internal F variation in this peculiar GC is still not possible with the currently available measurements. For this reason we acquired CRIRES spectra of 12 Cen giants; results will be presented in a forthcoming paper (S. Lucatello et al., in preparation)..
Furthermore, the F-O-Na (anti) correlations can be marked separately within each of the two sub-groups enclosed in M22 as clearly illustrated in Figures 4 and 5, where the -process poor and the -process rich stars are labeled with empty and filled symbols, respectively. The same conclusion was drawn by MSK11 when considering the Na-O and C-N planes.
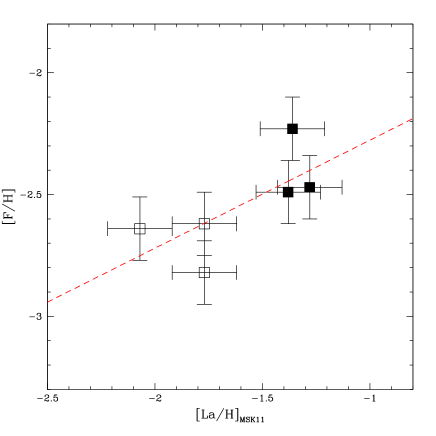
Very interestingly, beyond the internal spread in F characterizing each sub-component, we measured an increase in the F content between the two different stellar generations in M22. The -process-rich group has, on average, larger F abundances than the -process-poor group. This is shown in Figure 10, where we plot our F abundances ([F/H]) as a function of [La/H] from MSK11. There is a positive correlation between the two ratios, suggesting that the polluters responsible for the -process production must account for a simultaneous F production.
There are two classes of objects producing both -process elements and fluorine. The first one is very massive stars (mass roughly 40M⊙). These produce F in the initial phases of core He burning and expel it in the interstellar medium via winds during the Wolf-Rayet phase (Meynet & Arnould 2000). They also produce -process elements during core He and shell C burning (e.g., Pignatari et al. 2010). Production of both F and -process elements in these massive stars depends on the initial CNO abundances and thus decreases with the stellar metallicity. Inclusion of stellar rotation enhances the -process production at low metallicity (Pignatari et al. 2008; 2011); however, it appears to decrease the production of fluorine (Palacios et al. 2005). One problem already stressed by Roederer et al. (2011) when considering these stars is that there is no reason why the SNe that enriched the -process rich group host the component and those that polluted the -process poor do not (see Roederer et al. for details).
The second class of objects producing both F and -process elements are AGB stars (Forestini et al. 1992; Jorissen et al. 1992; Mowlavi et al. 1998; Karakas & Lattanzio 2003; Lugaro et al. 2004, 2012). To get deeper insights into the nature of the candidate AGB stars possibly responsible for the observed abundance trends in M22 we compare our results with the recent set of models by Lugaro et al. (2012). They presented AGB models for masses 0.96.0 M⊙ and metallicity three times lower than that of the cluster under consideration (i.e., [Fe/H]=2.3 dex).
From our data we infer that there is an increase of [F/H]=+0.400.15 dex in the fluorine content between the two groups. This estimate was done by taking into account the F content of the O-rich stars only, because they do not show any depletion due to the HBB. We averaged the F abundances in stars IV-97 and III-14, both belonging to the -poor group, finding a mean value [F/H]=2.630.01 dex. Since we have only one O-rich star in the -rich group, III-52, we chose it as representative of the F abundance for the group, that is [F/H]=2.230.15 dex. The F increase of +0.40 dex is accompanied by a corresponding enhancement in La of [La/H]=0.56 0.18 dex, since the values are [La/H]=1.920.15 dex and [La/H]=1.360.10 dex, respectively, for the two groups.
Comparing these values with the model predictions by Lugaro et al. (2012) we found that AGB stars with masses of 45 M⊙ can well reproduce the observed pattern. Lower-mass AGB models do not fit our observational requirements because they over-produce fluorine. This is true even if we consider that these AGB model predictions are roughly one dex too high to match the observation of carbon-enhanced metal-poor (CEMP) stars by Lucatello et al. (2011). Production of F in the 45 M⊙ mass range depends on the delicate balance between the operation of the TDU and of HBB. These stars suffer HBB and destroy F during the early phases of their AGB evolution, however, toward the end of the evolution, as the mass of the convective envelope decreases, HBB ceases while the TDU is still active resulting in mild F enhancements at the stellar surface. This explains why while the most prolific AGB stars in terms of fluorine production have initial masses around 2 M⊙, F production still occurs at slightly higher masses. On the other hand, more massive AGB models (5 M⊙) experience hotter HBB and thus more efficient F destruction as well as higher temperatures in the thermal pulses activating also 19F(,p)22Ne reactions. This, combined with fewer final TDU episodes when HBB has ceased means that they do not replenish F at the stellar surface.
Interestingly, the same conclusion is drawn by Roederer et al. (2011) by exploring the heavy-element ratios, [/] and [Pb/]. Comparing their abundances with models by Roederer et al. (2010), these authors deduced that the low mass AGBs (3M⊙) cannot account for the observed trend. More importantly, they concluded that a match to the -process element abundances is provided by the 5 M⊙ AGB model, and this is confirmed by checking the models of Lugaro et al. (2012). Furthermore, and very interestingly, these models predict Na and C production in agreement with the observations.
Our result provides a further, independent confirmation to this previous hint: indications from both light (fluorine here) and heavy elements converge toward the AGB stars of the same mass as the best candidate polluters, indicating that the age difference between the two sub-groups in M22 cannot be larger than a few hundreds Myr. It should be mentioned that by analyzing the double sub-giant branch (SGB) of this cluster, Marino et al. (2012) concluded that the age spread can be at most 300 Myr.
The fact that three independent studies, involving different and complementary techniques/approaches, produce the same result is encouraging. However, a comprehensive understanding of the whole picture is still missing. As also stressed by Roederer et al. (2011), if relatively massive AGBs (4-5 M⊙) produced the -process elements, and if these stars are also responsible for the observed -capture element anticorrelations, then it is not explained that an -process enrichment is present in M22 but is not associated with O and Na abundance anomalies, nor it is seen in any other GCs where the Na-O anticorrelations are observed.
On the other hand, it is clear from the observed F abundance trends that we must select slightly more massive AGBs, i.e., 6M⊙ if we wish to explain the light element variations in GCs, since this is the AGB mass range where F and O can be destroyed by HBB resulting in the observed F-O correlation. We might tentatively suggest that perhaps the production of the -process elements in AGB models with initial mass 6M⊙ is less efficient than currently predicted. This could be the result of a stronger mass-loss rate or a less efficient TDU in this mass range than those employed in the models by Lugaro et al. (2012). This possibility is well within model uncertainties and need to be investigated; in a forthcoming paper (D’Orazi et al., in preparation) we will attack these issues, presenting new observations and AGB models and discussing their strength/weakness in reproducing the observed abundance trends in GCs.
Alternatively, we may conclude that massive AGBs are not the inter-cluster polluters; however several lines of evidence point to those stars, such as the need for a Li production between first and second generation stars (as in the case of M4, D’Orazi & Marino 2010; Mucciarelli et al. 2011; Monaco et al. 2012). Further efforts, from both observational and theoretical perspectives, are needed; in particular the lack of a complete set of models for AGB stars and massive rotating stars with different mass and metallicity, following the whole nucleosynthetic path from Li to Pb, still hampers a quantitatively robust comparison between theory and observations.
6. Summary and concluding remarks
We presented fluorine abundances for a sample of six RGB stars belonging to the metal-poor globular cluster M22. The sample was selected to include -process-rich and -process-poor stars, as defined in MSK11. In addition, within each of these cluster sub-components, we targeted both O-rich (Na-poor) and O-poor (Na-rich) stars.
We gathered evidence of the presence of a F-O correlation and of an F-Na anticorrelation. Such chemical pattern, notably revealed in each cluster sub-group, is in agreement with F destruction during the hot H burning: fluorine follows the same trend defined by O, Na, C, N, Mg, Al, as predicted by the multiple population scenario.
Most interestingly, we found that the -process- (metal-) rich component is also characterized by a larger F content than the -process (metal-) poor component. The comparison between our observations and AGB models points to stars with masses around 4-5 M⊙ as responsible for such a trend, corroborating previous hints by Roederer et al. (2011) and Marino et al. (2012), and confirming that the age spread across the two different stellar generations in M22 cannot be larger than a few hundreds Myr.
References
- Abia et al. (2009) Abia, C., Recio-Blanco, A., de Laverny, P., et al. 2009, ApJ, 694, 971
- Abia et al. (2010) Abia, C., Cunha, K., Cristallo, S., et al. 20110, ApJ, 715, L94
- Abia et al. (2011) Abia, C., Cunha, K., Cristallo, S., et al. 2011, ApJ, 737, 8
- Alves-Brito et al. (2012) Alves-Brito, A., Melendez, J., Vasquez, S., Karakas, A.I. 2012, A&A, 540, A3
- Anders & Grevesse (1989) Anders, E., Grevesse, N. 1989, Geochim. Cosmochim. Acta, 53, 197
- Asplund et al. (2005) Asplund, M., Grevesse, N., Sauval, A.J. 2005, in Cosmic Abundances as Records of Stellar Evolution and Nucleosynthesis, ed. T.G. Barnes, III & F.N. Bash, PASP, 25
- Brown et al. (1990) Brown, J.A., Wallerstein, G., Oke, J.B. 1990, AJ, 100, 1561
- Brown & Wallerstein (1992) Brown, J.A., Wallerstein, G. 1992, AJ, 104, 1818
- (9) Burris, D.L., Pilachowski, C.A., Armandroff, T.E., et al. 2000, ApJ, 544, 302
- Busso et al. (1999) Busso, M., Gallino, R., Wasserburg, G.J. 1999, ARA&A, 37, 239
- (11) Carretta, E., Bragaglia, A., Gratton, R.G., et al. 2009a, A&A, 505, 117
- (12) Carretta, E., Bragaglia, A., Gratton, R.G., Lucatello, S. 2009b, A&A, 505, 139
- (13) Carretta, E., Bragaglia, A., Gratton, R.G., D’Orazi, V., Lucatello, S. 2009c, A&A, 508, 695
- (14) Carretta, E., Gratton, R.G., Lucatello, S., et al. 2010a, ApJ, 722, L1
- (15) Carretta, E., Bragaglia, A., Gratton, R.G., et al. 2010b, A&A, 520, 95
- (16) Chiappini, C., Frischknecht, U., Meynet, G., et al. 2011, Nature, 474, 666
- Cohen et al. (2011) Cohen, J.G., Huang, W., Kirby, E.N. 2011, ApJ, 740, 60
- Cunha et al. (2003) Cunha, K., Smith, V.V., Lambert, D.L., Hinkle, K.H. 2003, AJ, 1026, 305
- Da Costa et al. (2009) Da Costa, G.S., Held, E.V., Saviane, I., Gullieuszik, M. 2009, ApJ, 705, 1481
- Da Costa & Marino (2010) Da Costa, G.S., Marino A.F. 2010, PASA, 28, 28
- D’Antona et al. (1983) D’Antona, F., Gratton, R., Chieffi, A. 1983, Memorie della Societá Astronomica Italiana, 54, 173D
- Decin (2000) Decin, L. 2000, Ph.D. Thesis, Catholique University of Leuven Department of Physics and Astronomy
- Decressin et al. (2007) Decressin, T., Meynet, G., Charbonnel, C., Prantzos, N., Ekström, S. 2007, A&A, 464, 1029
- de Mink et al. (2009) de Mink, S.E., Pols, O.R., Langer, N., Izzard, R.G. 2009, A&A, 507, L1
- D’Orazi et al. (2010) D’Orazi, V., Gratton, R.G.., Lucatello, S., et al. 2010, ApJ, 719, L213
- D’Orazi & Marino (2010) D’Orazi, V., Marino, A.F. 2010, ApJ, 716, L166
- Ferraro et al. (2009) Ferraro, F.R., Dalessandro, E., Mucciarelli, A., et al. 2009, Nature, 462, 483
- Forestini et al. (1992) Forestini, M., Goriely, S., Jorissen, A., Arnould, M. 1992, A&A, 261, 157
- Gratton et al. (2012) Gratton, R.G., Carretta, E., Bragaglia, A. 2012, A&ARv, 20, 50
- Gustafsson et al. (2008) Gustaffson, B., Edvardsson, B., Eriksson, K., et al. 2008, A&A, 486, 951
- Harris (1996) Harris, W.E. 1996, AJ, 112, 1487
- Hinkle et al. (1995) Hinkle, K., Wallace, L., Livingston,W. C. 1995, “Infrared atlas of the Arcturus spectrum, 0.9-5.3 microns”, eds. K. Hinkle, L. Wallace, and W. C. Livingston (San Francisco: ASP) ISBN: 1-866733-04-X
- James et al. (2004) James, G., François, P., Bonifacio, P., et al. 2004, A&A, 427, 825
- Johnson & Pilachowski (2010) Johnson, C.I., Pilachowski, C.A. 2010, ApJ, 722, 1373
- Jorissen et al. (1992) Jorissen, A., Smith, V.V., Lambert, D. 1992, A&A, 261, 164
- Kaeufl et al. (2004) Kaeufl, H.-U., et al. 2004, Proc. SPIE, 5492, 1218
- Karakas & Lattanzio (2003) Karakas, A.I., Lattanzio, J.C. 2003, PASA, 20, 279
- Kayser et al. (2008) Kayser, A., Hilker, M., Grebel, E.K., Willemsen, P.G. 2008, A&A, 486, 437
- Kurucz (1993) Kurucz, R. 1993, CD-ROM 13, ATLAS9 Stellar Atmosphere Programs and 2 km/s Grid (Cambridge: SAO), 13
- Lind et al. (2011) Lind, K., Asplund, M., Barklem, P.S., Belyaev, A.K. 2011, A&A, 528, A103
- Lucatello et al. (2011) Lucatello, S., Masseron, T., Johnson, J.A., Pignatari, M., Herwing, F. 2011, ApJ, 792, 40
- Lugaro et al. (2004) Lugaro, M., Ugalde, C., Karakas, A.I., et al. 2004, ApJ, 615, 934
- Lugaro et al. (2012) Lugaro, M., Karakas, A.I., Stancliffe, R.J., Rijs, C. 2012, ApJ, 747, 2
- Maccarone & Zurek (2012) Maccarone, T.J., Zurek, D.R. 2012, MNRAS, 423, 2
- Marino et al. (2009) Marino, A. F., Milone, A. P., Piotto, G., et al. 2009, A&A, 505, 1099
- Marino et al. (2011a) Marino, A. F., Milone, A. P., Piotto, G., et al. 2011a, ApJ, 731, 64
- Marino et al. (2011b) Marino, A. F., Sneden, C., Kraft, R.P., et al. 2011b, A&A, 532, A8 (MSK11)
- Marino et al. (2012) Marino, A.F., Milone, A., Sneden, C., et al. 2012, A&A, 541, 15
- Meynet & Arnould (2000) Meynet, G., Arnould, M. 2000, A&A, 355, 176
- Mowlavi et al. (1998) Mowlavi, N., Jorissen, A., Arnould, M. 1998, A&A, 334, 153
- Monaco et al. (2012) Monaco, L., Villanova, S., Bonifacio, P., et al. 2012, A&A, 539, 157
- Mucciarelli et al. (2011) Mucciarelli, A., Salaris, M., Lovisi, L., et al. 2011, MNRAS, 412, 81
- Mucciarelli et al. (2012) Mucciarelli, A., Bellazzini, M., Ibata, R., et al. 2012, MNRAS, 426, 2889
- Norris & Freeman (1983) Norris, J., Freeman, K.C. 1983, ApJ, 266, 130
- Palacios et al. (2005) Palacios, A., Arnould, M., Meynet, G. 2005, A&A, 443, 243
- Pignatari et al. (2008) Pignatari, M., Gallino, R., Meynet, G., et al. 2008, ApJ, 687, L95
- Pignatari et al. (2010) Pignatari, M., Gallino, R., Heil, M., et al. 2010, ApJ, 710, 1557
- Pilachowski et al. (1982) Pilachowski, C.A., Leep, E.M., Wallerstein, G.J., Peterson, R.C. 1982, ApJ, 263, 187
- Raiteri et al. (1993) Raiteri, C.M., Gallino, R., Busso, M., Neuberger, D., Kaeppeler, F. 1993, ApJ, 419, 207
- Ramírez & Allende Prieto (2011) Ramírez, I., Allende Prieto, C. 2011, ApJ, 743, 135
- Roederer et al. (2010) Roederer, I.U., Cowan, J.J., Karakas, A.I., et al. 2010, 724, 925
- Roederer et al. (2011) Roederer, I.U., Marino, A.F., Sneden, C. 2011, ApJ, 742, 37
- Ryde et al. (2010) Ryde, N., Gustafsson, B., Edvardsson, B., et al. 2010, A&A, 509, 20
- Smith & Kraft (1996) Smith, G.H., Kraft, R.P 1996, PASP, 108, 344
- Smith et al. (2005) Smith, V.V., Cunha, K., Ivans, I.I., et al. 2005, ApJ, 633, 392
- Smith (2008) Smith, G.H. 2008, PASP, 120, 952
- Sneden (1973) Sneden, C. 1973, ApJ, 184, 839
- Ventura et al. (2001) Ventura, P., D’Antona, F., Mazzitelli, I., Gratton, R.G. 2001, ApJ, 550, L65
- Yong & Grundahl (2008) Yong, D., & Grundahl, F. 2008, ApJ, 672, L29
- Yong et al. (2008) Yong, D., Melendez, J., Cunha, K., et al. 2008, ApJ, 689, 1020
- Woosley et al. (1990) Woosley, S.E., Hartmann, D.H., Hoffman, R.D., Haxton, W.C. 1990, ApJ, 356, 272