Heavy-flavor production in LHC pp interactions using the ALICE detector
Measurements of charm and beauty production in pp collisions, using the ALICE detector system, at LHC energies ( and TeV) can test perturbative QCD down to very low Björken-x. They are also critical as a reference to ALICE’s heavy ion program. The ALICE detector system allows measurements not covered by the other LHC experiments in addition to covering complementary regions. A description of the ALICE detector system, in relation to ATLAS and CMS, are presented. Results from both leptonic and hadronic decay channels will be shown along with comparisons to other measurements when available.
Keywords: Hadron-Hardron Scattering, LHC, ALICE experiment, ultra-relativistic heavy ion collisions, heavy flavour production, nuclear modification factor, pp collisions, single muons, single electrons
1 Introduction
The Quark Gluon Plasma (QGP) produced by colliding lead ions together using the Large Hadron Collider (LHC) will get hot enough to produce, from the QCD vacuum, up, down, and quite likely strange quarks [1]. At LHC energies, all quarks can be produced in the initial interactions between the lead ions, specifically the heavier charm, bottom, and top quarks. The production of hadrons containing these quarks can be measured in proton-proton (pp) interactions at equivalent energies. When such quarks or hadrons, created in lead-lead interactions, pass though a QGP their energy and hadronic properties are very likely to be modified by the QGP in ways that can tell us a lot about the properties of the QGP phase of matter.
The presentations of Donald Isenhower and Michael Murray at this conference gave a very good introduction and review of QGP formation and the role of heavy flavor measurements, also see [2]. For a proper understanding of the results from heavy flavor measurements in lead-lead interactions, good measurements of charm production in pp collisions are necessary, preferably with the same instruments having the same acceptance and other systematics. In addition the production cross sections and decay rates of heavy flavored hadrons are of interest on their own. Here we present the most recent results from the A Large Ion Collider Experiment (ALICE) detector on open charm measurements in pp collisions at both and TeV.
2 ALICE Detector
The ALICE detector has been designed specifically to study the properties of the QGP. To this end, it has very good momentum resolution at very low transverse momentum, as low at 80 MeV/c, and very good particle identification. All of this is achieved by taking advantage of the varied capabilities of the 19 different sub-detector types, but at the cost of a limited acceptance and data taking rate. This is in contrast to the other LHC experiments, which are optimized for other measurements. This results in ALICE contributing measurements uniquely in the low momentum region with a significantly better particle identification capability. In this way the measurements of ATLAS and CMS, both in Pb-Pb and pp interactions, are supplemented by those of ALICE into regions not reachable by ATLAS or CMS.
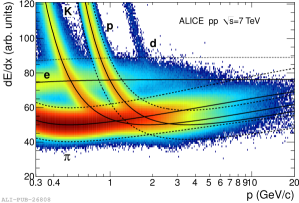
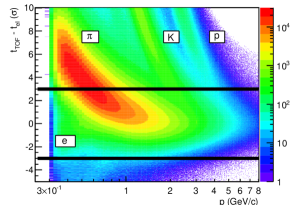
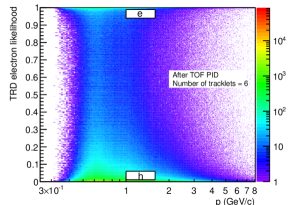
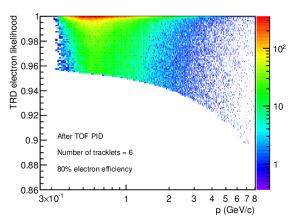
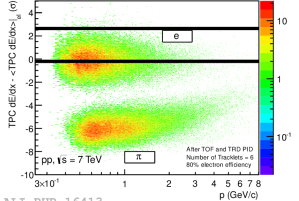
In the analysis presented here, measurements from the sub-detectors listed in Table 1 where used extensively. The V0 and SPD sub-detectors are primarily used for triggering, along with the Trigger chambers. For non- events, those taken without the Tracker, the central barrel Time Projection Chamber (TPC) was the primary track, momentum, and particle identification detector. Figure 1 shows the correlation between the ionization of the TPC gas associated with a track and the track’s momentum. In addition parts of the Inner Tracking System (ITS) where used both for triggering and particle identification. The ITS is made up of 2 inner cylindrical layers of silicon pixel detectors (SPD), which can also be use for triggering, 2 middle cylindrical layers of silicon drift detectors (SDD), and the 2 outer most cylindrical layers of silicon double sided micro-strip detectors (SSD). Other detectors, such as the Time of Flight (TOF), Transition Radiation Detector (TRD), or even the Electromagnetic Calorimeter (EMCal) where used, primarily for electron/positron identification. See Figures 2 & 3 where signals from the TOF and TRD are shown and the result after removing kaons, protons/ant-protons, and deuterons is seen on the TPC ionization vs momentum correlation plot.
Muons are measured in the region . In front of these tracking chambers is a 10 interaction length hadron absorber which lets through muons above about 4 GeV/c. Such muons will trigger the muon trigger chambers which are behind an additional 7.2 interaction length absorber. Between these two absorbers are a series of muon tracking chambers imbedded in a 3 Tm magnetic field to measure these muon’s momentum. Further details of the ALICE detectors can be found in [2].
3 Acceptance and Data selection
This paper presents pp data at 7 and 2.76 TeV taken during 2010 and 2011 respectively. The physical acceptance of the ALICE detectors (relevant to this analysis) is shown in Table 1. During the shutdown between the 2010 and 2011 data taking periods, additional TRD and EMCal super modules were installed.
Data analyzed was taken from minimum bias and -minimum bias runs. The minimum bias trigger required at least 1 signal in the SPD detectors () or one signal in either V0 sub-detector and these signals were required to occur during a beam-beam crossing. The -minimum bias runs have the same requirement with the addition of a signal in the -trigger detector. Van der Meer scans were used to measure the total minimum bias cross section [3]. These cross sections were found to be mb at 7 TeV and mb at 2.76 TeV. The luminosity depends a bit on the specific data selected for analysis and are shown in Figures 5, 6, and 8.
| Sub- | Acceptance | ||
| Detector | Use | ||
| V | Trgr | ||
| V | |||
| SPD | Trgr, Vtx | ||
| T | TOF | ||
| T | |||
| TPC | trk, , PID | ||
| TOF | PID | ||
| TRD | & | ID | |
| & | |||
| EMCal | /hadron ID | ||
| -Tkr | & trk | ||
| -Tgr | Trgr | ||
| † During 2010 Data Taking. | |||
| ‡ During 2011 Data Taking. | |||
For analysis in the central barrel, tracks were required to have at least 70 out of 159 measurements in the TPC with a , and at least one good measurement in the ITS SPD of the ITS. In addition, when TOF timings were used for the PID, the best timings require a signal in one of the T0 sub-detectors (or beam-beam crossing time are tried if no T0 signals).
Acceptance calculations were done using PYTHIA 6.4.21 [4] with the Perugia-0 tune [5]. Events were then passed through a full ALICE simulation matched to the run conditions (AliRoot). AliRoot used the Geant-3 [6] particle transport engine. Where necessary, feed down from B meson decay has been corrected based on a Fixed Order Next to Leading Log (FONLL) [7] calculation.
4 Results
4.1 D meson Measurements
4.1.1 Production cross sections
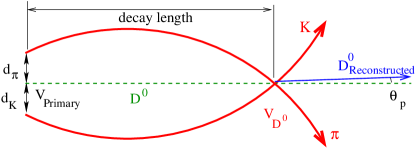
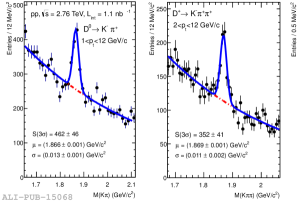
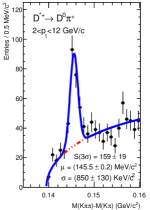
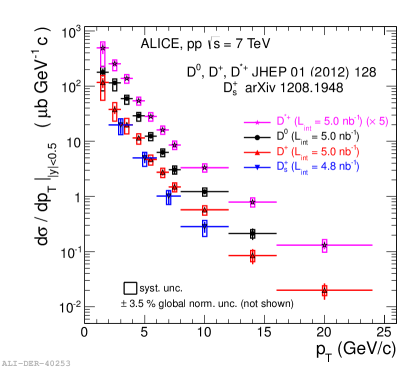
The following decay have been reconstructed, , , , and . Note decays of can also pass these selection but at a rate smaller by a factor of about 100 (due to acceptance, efficiency, and branching ratios). Given the relatively long lifetimes for these D meson decays ( and ) and the very good vertex resolution of ALICE, a selection based on the reconstructed displaced vertex was used to significantly improve the signal to background ratio in these analyses, see Figure 4. Particle Identification was based on signals in the TPC, and TOF, see Figures 1, 2 and 3 above.
Mass plots were then produced from the candidate decay products, for the a mass difference between the 3 decay products () was plotted. The background distributions were fit using a polynomial up to second degree, and a Gaussian distribution for the signals. The yield was then measured as the area in the Gaussian distribution. An example is shown in Figure 5 from the 2.76 TeV pp data set. The dependent cross at 7 TeV is shown in Figure 6. A detailed comparison to FONLL and the General Mass Variable Flavor Number Schema (GM-VFNS) [8] calculation has been done, not shown, and the agreement between these results and both theories are within their theoretical uncertainties [9, 10, 11].
4.1.2 D meson production ratios
Ratios of particle production rates have the advantage that many systematic uncertainties cancel out and can give some insight to differences in production mechanisms. In addition some particle interactions simulations, like PYTHIA [4], use such ratios as inputs to their production simulations. One such ratio is the ratio between spin 1 mesons to spin 0 mesons for charm and heaver mesons (PYTHIA 6.4.21’s PARJ(13)). Given the measurements above we have a measure of the fraction of D meson production in a vector to those produced in a vector plus pseudoscalar state. We get
and
(uncertainties are from st=statistical, sy=systimatic, BR=branching ratio, and ex=due to extrapolation to full phase space)[10]. These values compare well with those measured by ATLAS at 7 TeV [12], CDF at 1.96 TeV [13], ALEPH at 91.2 GeV [14], and CLEO at 10.55 GeV [15].
4.2 Leptonic decays of D and B mesons
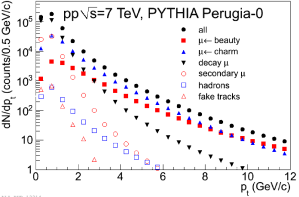
All charm and bottom quark mesons have decays which include leptons in their final states. These leptons can be rather energetic and tend to dominate all other sources of leptons, but to get a more accurate measure of the D and B mesons a proper cocktail from all of the sources of leptons needs to be considered. For final state muons, this is shown in Figure 7. A somewhat more complicated cocktail has been done for sources of electrons (which can also be created by interactions with elements of the ALICE detector).
4.2.1 from D and B decays
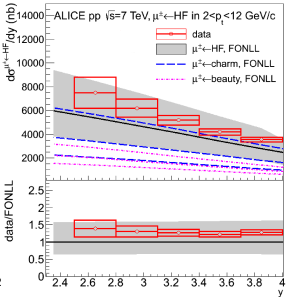
The and dependent cross sections for muons directly from charm and beauty decay, produced in 7 TeV pp interactions, are shown in Figure 8. A simular plot for 2.76 TeV pp interactions can be found in [16]. In both cases the measurements are compared to FONLL calculations and are found to be within theoretical uncertainties.
4.2.2 from D and B decays
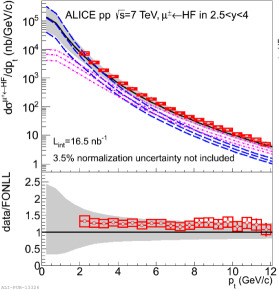
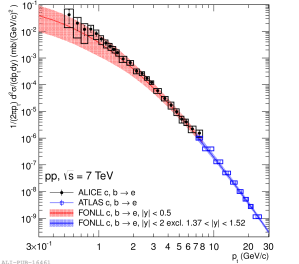
Electrons/positrons decay from charm and beauty have also been measured for 7 TeV pp collisions, see [17]. These results also are well described by a FONLL calculation, Figure 9. Also shown in this figure are similar measurements from ATLAS [18]. The ATLAS results extend the ALICE results very nicely.
4.2.3 Charm production cross section
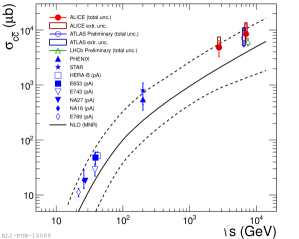
The total charm production cross section for 7 and 2.75 TeV pp collisions are shown in Figure 10
and
along with other measurements (uncertainties are from FF=the fragmentation fraction relative production yield for a charm quark hadronizing to a particular species of D meson, and lum=the luminosity). Proton nucleus and deuteron nucleus data are also shown but scaled down by the number of binary collisions in these reactions, as computed by a Glauber model. An extrapolation to the full phase space has been done. The solid line is a NLO MNR calculation (uncertainties indicated by the dashed lines) [19]. Note that all of the measurements from the LHC experiments agree within their uncertainties and those at other energies are a bit above but seem to follow the energy dependence from the NLO MNR calculation.
5 Conclusions
ALICE has measured up to 4 D-meson production cross sections at up to 2 different values of in pp collisions near central rapidity. We have also measured the heavy flavor production in these pp collisions, centrally via electron/positron decay channels and more forwardly via muon decay channels. By extrapolating these measurements to the full phase space, we have obtained the total charm production cross. All of these measurements are described within uncertainties by pQCD calculations.
References
- [1] Jean Letessier, Johann Rafelski Phys. Rev. C75: 014905,(2007).
- [2] A. Aamodt et al., (ALICE Cllaboration), JINST 3, S08002 (2008)
- [3] B. Abelev et al., [ALICE Coll.], Phys. Lett. B 710 pp557 doi 10.1016/j.physletb.2012.03.038 (2012).
- [4] T. Sjöstrand, S. Mrenna, Pl Skands, JHEP 0605 (2006) 026, and T. Sjöstrand, Comput. Commun. 82 (1994) 74
- [5] P.Z. Skands, Phys. Rev. D 82 (2010) 074018
- [6] R. Brun et al., CERN program library long write-up, W5013 in teh ISR, CERN-ISR-PO-68-31 [ISR-PO-68-31]. Note: ROOT has developed a virtual Monte Carlo interface to GEANT 3 and other such transport codes. This is now used as part of the ALICE AliRoot simulation, reconstruction, and analysis framework.
- [7] M. Cacciari, M. Greco, P. Nason, JEP 05 (1998) 001, M. Cacciari, S. Fixione, P. Nason, JHEP 05 (2001) 006, and M. Cacciari, S. fiixione, N. Houdeau, M.L. Mangano, P. Nason, G. Ridolf, CERN-PH-TH/2011-227
- [8] B.A. Kniehl et al., AIP Conf. Proc. 792:867-870 (2005), arXiv:hep-ph/0507068, B.A. Kniehl et al., Eur. Phys. J C41 199, 199 (2005), and B.A. Kniehl et al., DESY 12-013, MZ-TH/1207, LPSC 12019, arXiv: 1202.0439 (2012)
- [9] B. Abelev et al., JHEP 01 (2012), doi:10..1007/JHEP01(2012)128
- [10] B. Abelev et al., Submitted for publication, [arXiv:1205.4007v2 [hep-ex] 6 Aug 2012] [CERN-PH-EP-2012-133, Aug. 7 2012]
- [11] B. Abelev et al., Paper in preparation, June 16 2012.
- [12] ATLAS Coll., ATLAS-PHYS_PUB-2011-012(2011), ATLAS-CONF-2011-017 (2012)
- [13] D. Acosta et al. [CDF Coll.] Phys. Rev. Lett. 91 241804 (2003), CDF Coll., CDF Note 6623 (2003)
- [14] ALEPH coll., Eur. Phys. J C16 597 (2000).
- [15] D. Boroletto et al. [CLEO Coll.], Phys. Rev. D 37 1719 (1988), D. Bortoletto et al. [CLEO Coll.], Phys. Rev. D 39 1471 (1989), The evaluated value used corrected by the BR of K. Nakamura et al. [Particle Data Group], J. Phys. G37 075021 (2010), and 2011 partial update for the 2012 edition, in A. David, Phys. Lett. B644 224 (2007).
- [16] B. Abelev et al., Submitted for publication, [arXiv:1205.6443v1 [hep-ex] 29 May 2012] [CERN-PH-EP-2012-155, May 29, 2012]
- [17] B. Abelev et al., Submitted for publication, [arXiv:1205.5423v1 [hep-ex] 24 May 2012] [CERN-PH-EP-2012-131, May 25 2012]
- [18] G. Aad et al., Phys. Lett., B707:438-458, 2012.
- [19] M. Mangano, P. Nason, G. Ridolfi, Nucl. Phys. B 373 295 (1992).
- [20] K. Aamodt et al., Phys. Let. B 704 (2011) 442-435 doi:10.1016/j.phyletb.2011.09.054
- [21] B. Abelev et al., Phys. Let. B 708 (2012) 265-275 doi:10.1016/j.physletb.2012.01.063