The Galactic Center Region Imaged by VERITAS from 2010–2012
Abstract
The galactic center (GC) has long been a region of interest for high-energy and very-high-energy observations. Many potential sources of GeV/TeV -ray emission are located in the GC region, e.g. the accretion of matter onto the central black hole (BH), cosmic rays from a nearby shell-type super nova remnant, or the annihilation of dark matter. The GC has been detected at MeV/GeV energies by EGRET and recently by Fermi/LAT. At TeV energies, the GC was detected at the level of 4 standard deviations with the Whipple telescope and with one order of magnitude better sensitivity by H.E.S.S. and MAGIC. We present the results from 3 years of VERITAS GC observations conducted at large zenith angles (LZA). The results are compared to astrophysical models.
Keywords:
gamma-rays, galactic center, black hole, non-thermal, VERITAS:
95.35.+d; 95.85.Pw; 97.60.Lf; 98.70.Rz1 Introduction
The center of our galaxy harbors a BH coinciding with the strong radio source Sgr A*. X-ray/MeV/GeV transients in this region are observed on a regular basis. Various astrophysical sources are located close to the GC which may potentially be capable of accelerating particles to multi-TeV energies, such as the supernova remnant Sgr A East or a pulsar wind nebula GC_Plerion . Furthermore, the super-symmetric neutralinos are discussed as potential candidates of dark matter accumulating in the GC region and annihilating into -rays Neutralino . The resulting spectrum would have a cut-off near the neutralino mass . Assuming a certain dark matter density profile the expected -ray flux along the line-of-sight integral can be calculated as a function of and the annihilation cross section GammasFromNWF and can in turn be compared to measured upper limits.
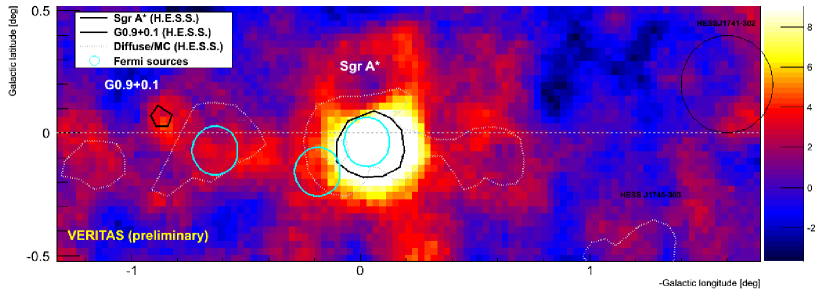
EGRET detected a MeV/GeV source 3EG J1746-2851 coincident with the GC position Egret_GC and recently Fermi/LAT resolved several sources in the GC region Fermi_FirstCatalog , see Fig. 1. However, uncertainties in the diffuse galactic background models and limited angular resolution at MeV/GeV make it difficult to study the morphologies of these sources. At GeV/TeV energies a detection from the direction of the GC was first reported in 2001/02 by the CANGAROO II collaboration with a steep energy spectrum at the level of of the Crab Nebula flux CANGAROO_GC . Shortly after, evidence at the level of standard deviations (s.d.) was reported from the Whipple collaboration Whipple_GC . The GC was finally confirmed as a GeV/TeV -ray source by the H.E.S.S. collaboration HESS_SgrA (the position of the supernova remnant Sgr A East could be excluded as the source of the -ray emission). The energy spectrum is well described by a power-law with a cut-off at . The H.E.S.S. observations revealed a diffuse GeV/TeV -ray component (dashed contour lines in Fig. 1) which is aligned along the galactic plane and follows the structure of molecular clouds HESS_SgrA_Diffuse ; the emission was explained by an interaction of local cosmic rays (CRs) with matter of the molecular clouds. The MAGIC collaboration detected the GC (7 s. d.) in 2004/05 observations performed at LZA MAGIC_GC , followed by a strong VERITAS LZA detection in 2010 Beilicke2011 .
2 The Galactic Center region imaged by VERITAS
GC observations
Due to its declination the GC can only be observed by VERITAS at LZA () – strongly decreasing the angular resolution and sensitivity. The use of the displacement parameter BuckelyDisp , between the center of gravity of the image and the shower position, has been used in the VERITAS event reconstruction which strongly improved the sensitivity for LZA observations Beilicke2011 . The performance and energy reconstruction have been confirmed on LZA Crab Nebula data. The column density of the atmosphere changes with . In a conservative estimate, the systematic error in the energy/flux reconstruction can be expected to scale accordingly. More detailed studied are needed for an accurate estimate; for the GC observations we currently give a conservative value of a systematic error on the LZA flux normalization of . The GC was observed by VERITAS in 2010–2012 for (good quality data, dead-time corrected) with an average energy threshold of .
GC results
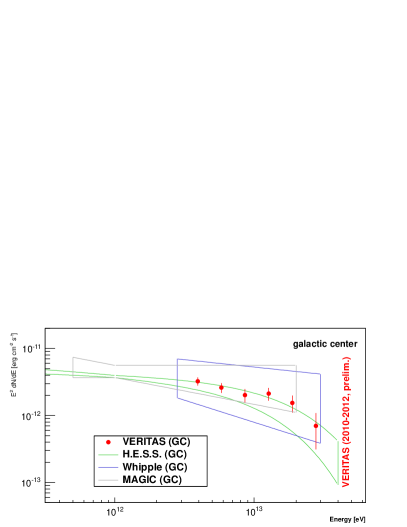
The VERITAS sky map of the GC region is shown in Fig. 1. An s.d. excess is detected. No evidence for variability was found in the 3-year data. The energy spectrum is shown in Fig. 2 and is found to be compatible with the spectra measured by Whipple, H.E.S.S., and MAGIC. Since the large LZA effective areas of the VERITAS observations compensate a shorter exposure of low-zenith observations, the statistical errors of the data points are found to be smaller as compared to the H.E.S.S. measurements.
Diffuse flux limit and dark-matter annihilation
OFF-source observations were performed in a field located in the vicinity of the GC region (similar zenith angles and sky brightness) without a known TeV -ray source. These observations are used to study the background acceptance throughout the field of view and will allow the estimate of a diffuse -ray component surrounding the position of the GC. An upper limit of the diffuse -ray flux can in turn be compared with line-of-sight integrals along the density profile , in order to constrain the annihilation cross section for a particular dark matter model, dark matter particle mass and density profile . Due to its likely astrophysical origin the excess at the GC itself, as well as a region along the galactic plane, will be excluded from this analysis (work in progress).
Hadronic models
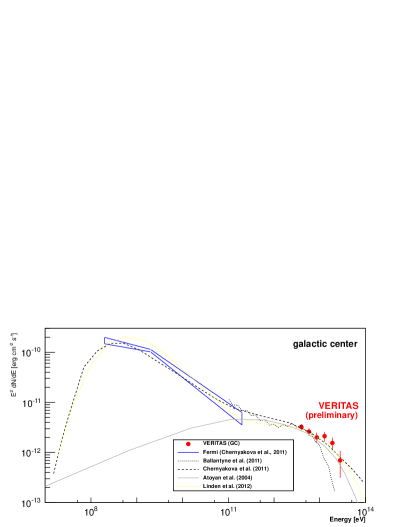
Hadronic acceleration models Chernyakova2011 ; Ballantyne2011 are discussed involving: (i) hadrons being accelerated in the BH vicinity (few tens of Schwarzschild radii). (ii) The accelerated protons diffuse out into the interstellar medium where they (iii) produce neutral pions which decay into GeV/TeV -rays. Linden et al. (2012) discuss the surrounding gas as proton target defining the morphology of the TeV -ray emission Linden2012 . Changes in -ray flux in those models can be caused by changing conditions in the BH vicinity (e.g. accretion). The time scales of flux variations are at MeV/GeV energies (old flares) and at (’new’ flares caused by recently injected high-energy particles) Chernyakova2011 . Constraining the spectral variability would serve as an important test for this class of models.
Leptonic models
Atoyan et al. (2004) Atoyan2004 discuss a BH plerion model in which a termination shock of a leptonic wind accelerates leptons to relativistic energies which in turn produce TeV -rays via inverse Compton scattering. The flux variability time scale in this model is on the order of . The hadronic and the leptonic models are shown together with the VERITAS/Fermi data in Fig. 2 (right). The leptonic model clearly fails in explaining the flux in the MeV/GeV regime. However, this emission may well originate from a spatially different region or mechanism other than the TeV -ray emission. The hadronic models can explain the SED by the superposition of different flare stages. Future Fermi/VERITAS flux correlation studies, as well as the measurement of the TeV energy cut-off and limits on the variability will serve as crucial inputs for the modeling.
3 Summary and conclusion
VERITAS is capable of detecting the GC within in zenith angle greater than observations. The measured energy spectrum is found to be in agreement with earlier measurements by H.E.S.S., MAGIC, and Whipple. Future observations to measure the cut-off energy in the spectrum and to determine limits on the flux variability at the highest energies will place constraints on emission models. The recently discovered giant molecular cloud heading towards the immediate vicinity of the GC BH BH_eats_MC represents further motivation for future TeV -ray monitoring of this region. An upper limit on diffuse -ray emission and, in consequence, a limit on the photon flux initiated by the annihilation of dark matter particles is work in progress.
References
- (1) Q. D. Wang, F. J. Lu, E. V. Gotthelf, et al., MNRAS 367, 937 (2006).
- (2) G. Jungman, M. Kamionkowski, and K. Griest, PhR 267, 195 (1996).
- (3) L. Bergström, P. Ullio, and J. Buckley, APh 9, 137 (1998).
- (4) R. C. Hartman, D. L. Bertsch, S. D. Bloom, et al., ApJS 123, 79 (1999).
- (5) A. A. Abdo, et al., ApJS 188, 405 (2010).
- (6) K. Tsuchiya, R. Enomoto, L. T. Ksenofontov, et al., ApJ 606, L115 (2004).
- (7) K. Kosack, H. M. Badran, I. H. Bond, et al., ApJ 608, 97 (2004).
- (8) F. A. Aharonian, et al., A&A 425, L13 (2004).
- (9) F. A. Aharonian, et al., Nature 439, 695 (2006).
- (10) J. Albert, E. Aliu, H. Anderhub, et al., ApJ 638, L101 (2006).
- (11) M. Beilicke, et al. (VERITAS collaboration), Proc. 2011 Fermi Symp., arXiv 1109.6836 (2011).
- (12) J. H. Buckley, C. W. Akerlof, D. A. Carter-Lewis, et al., A&A 329, 639 (1998).
- (13) M. Chernyakova, D. Malyshev, F. A. Aharonian, R. M. Crocker, and D. I. Jones, ApJ 726, 60 (2011).
- (14) D. R. Ballantyne, M. Schumann, and B. Ford, MNRAS 410, 1521 (2011).
- (15) T. Linden, E. Lovegrove, and S. Profumo, arXiV 1203.3539 (2012).
- (16) A. Atoyan, and C. D. Dermer, ApJ 617, L123 (2004).
- (17) S. Gillessen, R. Genzel, T. Fritz, et al., Nature 481, 51 (2012).