Spectroscopic evidence of distinct stellar populations in the counter-rotating stellar disks of NGC 3593 and NGC 4550. ††thanks: Based on observations collected at the European Southern Observatory for the programme 087.B-0853A.
Abstract
Aims. We present the results of integral-field spectroscopic observations of the two disk galaxies NGC 3593 and NGC 4550 obtained with the Visible Multi Object Spectrograph at the Very Large Telescope. Both galaxies are known to host two counter-rotating stellar disks, with the ionized gas co-rotating with one of them. We measured in each galaxy the surface brightness, kinematics, mass surface density, and the stellar populations of the two stellar components as well as the distribution, kinematics, and metallicity of the ionized-gas component to constrain the formation scenario of these peculiar galaxies.
Methods. We applied a novel spectroscopic decomposition technique to both galaxies, to disentangle at each position in the field of view the relative contribution of the two counter-rotating stellar and one ionized-gas components to the observed spectrum. We measured the kinematics and the line strengths of the Lick indices of the two counter-rotating stellar components. We modeled the data of each stellar component with single stellar population models that account for the /Fe overabundance.
Results. In both galaxies we successfully separated the main from the secondary stellar component that is less massive and rotates in the same direction of the ionized-gas component. The two stellar components have exponential surface-brightness profiles. In NGC 3593 they have different scale lengths, with the secondary one dominating the innermost 500 pc. In NGC 4550 they have the same scale lengths, but slightly different scale heights. In both galaxies, the two counter-rotating stellar components have different stellar populations. The secondary stellar disk is younger, more metal poor, and more -enhanced than the main galaxy stellar disk. Such a difference is stronger in NGC 3593 than in NGC 4550.
Conclusions. Our findings rule out an internal origin of the secondary stellar component and favor a scenario where it formed from gas accreted on retrograde orbits from the environment fueling an in situ outside-in rapid star formation. The event occurred Gyr ago in NGC 3593 ( Gyr after the formation of the main galaxy disk), and Gyr ago in NGC 4550, (less than 1 Gyr after the formation of the main galaxy disk). The formation through a binary galaxy merger cannot be ruled out, and a larger sample is required to statistically determine which is the most efficient mechanism to build counter-rotating stellar disks.
Key Words.:
galaxies: abundances – galaxies: individual: NGC 3593, NGC 4550 – galaxies: formation – galaxies: stellar content – galaxies: kinematics and dynamics.1 Introduction
The general term of “counter-rotation” indicates the presence of two components of a galaxy that rotate along opposite directions with respect to each other. This phenomenon has been observed in galaxies all over the Hubble sequence, from ellipticals to irregulars, including barred galaxies. Counter-rotating galaxies are classed depending on the nature (stars vs. stars, stars vs. gas, gas vs. gas) and size (counter-rotating cores, rings, disks) of the counter-rotating components (see Rubin 1994; Galletta 1996; Bertola & Corsini 1999 for reviews).
In this paper, we will focus on the class of disk galaxies with two counter-rotating stellar disks of comparable size. To date, the few known objects are: NGC 4550 (Rubin et al. 1992; Rix et al. 1992; Emsellem et al. 2004), NGC 7217 (Merrifield & Kuijken 1994), NGC 3593 (Bertola et al. 1996; Corsini et al. 1998, 1999; García-Burillo et al. 2000), NGC 4138 (Jore et al. 1996; Haynes et al. 2000), and NGC 5719 (Vergani et al. 2007; Coccato et al. 2011).
The current paradigm that explains stellar counter-rotation is a retrograde acquisition of external gas and subsequent star formation (Pizzella et al. 2004). This scenario explains also the lower detection rate of counter-rotation in spirals with respect to S0’s: a counter-rotating gaseous disk will be observed only if the mass of the newly supplied gas exceeds that of the pre-existing one (Lovelace & Chou 1996; Thakar & Ryden 1996), which is higher in spirals than in S0’s. About 30 per cent of S0’s host a counter-rotating gaseous disk (Bertola et al. 1992; Kuijken et al. 1996; Bureau & Chung 2006), although that less than 10 per cent of them have a significant fraction of counter-rotating stars (Kuijken et al. 1996). For comparison, less than 10 per cent of spiral galaxies are found to host a counter-rotating gaseous and/or stellar disk (Kannappan & Fabricant 2001; Pizzella et al. 2004).
Alternative scenarios for building counter-rotating stellar disks are also proposed. They include the accretion of already formed stars (and gas) through mergers and internal secular processes related to disk instabilities. Indeed, galaxy mergers can produce galaxies with counter-rotating components, depending on the orbital parameters of the encounter and the amount of gas involved in the process. The merger remnants range from kinematically decoupled cores or counter-rotating bulges in the case of minor mergers (e.g., Balcells & González 1998; Jesseit et al. 2007; Eliche-Moral et al. 2011; Bois et al. 2011), to large-scale stellar disks in the case of binary major mergers (e.g., Puerari & Pfenniger 2001; Crocker et al. 2009). An alternative to the external-origin scenarios has been proposed by Evans & Collett (1994) and it involves the dissolution of a triaxial potential or a bar. In this process, the stars moving on box orbits escape from the confining azimuthal potential well to move onto tube orbits. In non-rotating disks, there are as many box orbits with clockwise azimuthal motion as counter-clockwise. Thus, half box-orbit stars are scattered onto clockwise streaming tube orbits, half onto counter-clockwise. In this way, two identical counter-rotating stellar disks can be built. Barred galaxies host quasi-circular retrograde orbits (see Wozniak & Pfenniger 1997). Although the origin of stellar counter-rotation observed in barred galaxies (Bettoni 1989; Bettoni & Galletta 1997) is not necessarily external, acquired gas can be trapped on this family of retrograde orbits and then eventually form stars.
The different formation mechanisms are expected to leave different signatures in the properties of the stellar populations of the counter-rotating component. In particular, the age is a key element to investigate the origin of counter-rotating stars. Gas acquisition followed by star formation predicts younger ages for the counter-rotating stellar component in all cases, and it allows for different metallicity and -enhancement between the two disks, which are formed by different gas. Direct acquisition of stars through mergers also allows for different metallicity and -enhancement, but the younger component will be determined by the difference in age between the host galaxy and merged system. Roughly, one would expect younger counter-rotating stars in per cent of the cases. On the contrary, the internal origin predicts the same mass, chemical composition, and age for both the counter-rotating stellar components.
A proper spectroscopic decomposition that separates the relative contribution of the counter-rotating stellar components to the observed galaxy spectrum is therefore needed. Such a decomposition will allow to disentangle the different formation scenarios by properly measuring both the kinematics and the stellar population properties of the counter-rotating stellar disks. Unfortunately, the techniques that have been developed over the years separated either the kinematics only (e.g., Kuijken & Merrifield 1993) or stellar populations only (e.g., Cid Fernandes et al. 2005; Johnston et al. 2012a).
Recently, we have presented a new technique of spectroscopic decomposition which we have successfully applied to measure both the kinematics and stellar population properties of the counter-rotating stellar disks of NGC 5719 (Coccato et al. 2011). We found that the counter-rotating stellar component, which rotates in the same direction of the ionized gas, is younger, less rich in metals, more -enhanced, and less luminous than the main galaxy disk. We therefore provided the crucial information that definitely confirms the gas-accretion scenario for NGC 5719 previously suggested by Vergani et al. (2007).
Soon after, other groups developed similar codes. Katkov et al. (2011b) applied an independent spectroscopic decomposition technique (Katkov & Chilingarian 2011a) to NGC 524, finding a stellar disk that counter-rotates with respect to the galaxy bulge. Both components are very old (15–20 Gyr); the disk component displays a steep metallicity gradient, while the bulge a more constant radial profile. Very recently, Johnston et al. (2012b) analyzed a long-slit spectrum obtained along the major axis of NGC 4550 and found that the counter-rotating stellar component associated to the ionized gas is younger than the rest of the galaxy.
In this paper, we apply our spectroscopic decomposition technique to two disk galaxies, NGC 3593 and NGC 4550, which are known to host two large counter-rotating stellar disks (Rubin et al. 1992; Bertola et al. 1996). We will: i) characterize the morphology, kinematics, mass surface density distribution, and stellar populations of both the counter-rotating components, ii) date the formation of the counter-rotating disks, and iii) probe their formation mechanism. We adopt a distance to NGC 3593 of 7 Mpc (Wiklind & Henkel 1992) and a distance to NGC 4550 of 16 Mpc (Graham et al. 1999). The paper is organized as follows: in Section 2 we present the new integral-field spectroscopic observations; in Section 3 we describe and apply our spectroscopic decomposition technique to disentangle the two counter-rotating components; in Section 4 we present the results; in Section 5 we discuss our results and compare them with the predictions of different formation scenarios; finally in Section 6 we present a conclusive summary.
2 Observations and data reduction
The integral-field spectroscopic observations were carried out in service mode with the Very Large Telescope (VLT) at the European Southern Observatory (ESO) in Paranal during dark time between April 05 and June 02, 2011. The Unit Telescope 3 was equipped with the VIsible Multi Object Spectrograph (VIMOS, Le Fèvre et al. 2003) in the Integral Field Unit (IFU) configuration. We used the 0.67 arcsec fiber-1 resolution and the HR blue grism, covering the spectral range 4150–6200 Å with a reciprocal dispersion of 0.54 Å pixel-1. The instrumental spectral resolution measured at 5200 Å was 2.0 Å (FWHM), equivalent to 115 .
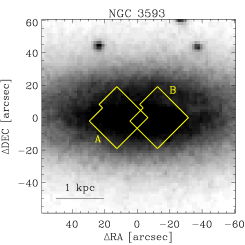
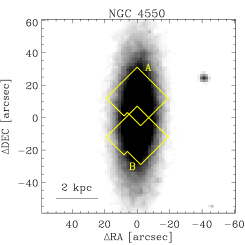
Observations were organized into different on-target exposures of 2950 s each, alternated to offset exposures of sky fields of 280 s each for sky subtraction, as detailed in Table LABEL:tab:log. For each galaxy we observed two overlapping fields-of-view aligned along the galaxy photometric major axis, at each side of the nucleus. The locations of the VIMOS fields of view are shown in Figure 1.
| Target | Field | RA (J2000.0) | DEC (J2000.0) | OB | Exp. time (+sky) | Date |
|---|---|---|---|---|---|---|
| [hh:mm:ss.s] | [dd:mm:ss.s] | [s] | [yyyy-mm-dd] | |||
| (1) | (2) | (3) | (4) | (5) | (6) | (7) |
| NGC 3593 | A | 11:15:10.2 | 12:56:53.7 | 540380 | 2850 (+279) | 2011-05-30 |
| NGC 3593 | A | 11:15:10.1 | 12:56:55.1 | 540382 | 2850 (+280) | 2011-05-02 |
| NGC 3593 | A | 11:15:10.2 | 12:56:55.8 | 540383 | 2850 (+280) | 2011-04-05 |
| NGC 3593 | A | 11:15:10.1 | 12:56:54.4 | 540384 | 2850 (+279) | 2011-05-01 |
| NGC 3593 | B | 11:15:08.6 | 12:56:55.1 | 540385 | 2850 (+279) | 2011-05-28 |
| NGC 3593 | B | 11:15:08.7 | 12:56:55.7 | 540386 | 2850 (+279) | 2011-05-28 |
| NGC 3593 | B | 11:15:08.6 | 12:56:54.4 | 540387 | 2850 (+279) | 2011-05-28 |
| NGC 4550 | A | 12:36:02.6 | 12:05:32.5 | 540388 | 2850 (+279) | 2011-05-29 |
| NGC 4550 | A | 12:36:02.5 | 12:05:31.9 | 540390 | 2850 (+279) | 2011-05-29 |
| NGC 4550 | A | 12:36:02.6 | 12:05:33.2 | 540391 | 2850 (+279) | 2011-05-30 |
| NGC 4550 | B | 12:36:02.7 | 12:05:10.5 | 540392 | 2850 (+279) | 2011-05-30 |
| NGC 4550 | B | 12:36:02.7 | 12:05:09.9 | 540393 | 2850 (+279) | 2011-06-02 |
| NGC 4550 | B | 12:36:02.7 | 12:05:11.2 | 540394 | 2850 (+279) | 2011-06-02 |
Notes – Col. 1: target name; Col. 2: VIMOS field-of-view identifier, as given in Fig. 1; Cols. 3, 4: coordinates of the center of the field-of-view; Col. 5: observing block (OB) identifier; Col. 6: total exposure time on target (and on offset position for sky background evaluation); and Col. 7: date in which the OB was executed.
Data reduction (bias subtraction, fiber identification and tracing, flat fielding, wavelength calibration, and correction for instrument transmission) was performed using the VIMOS ESO pipeline version 2.6.3 under the EsoRex environment111The VIMOS data reduction pipeline and the ESO Recipe Execution Tool are available at http://www.eso.org/sci/software/pipelines/., plus some ad hoc IDL222Interactive Data Language is distributed by ITT Visual Information Solutions. It is available from http://www.ittvis.com/. and IRAF333Image Reduction and Analysis Facility is distributed by the National Optical Astronomy Observatories, which are operated by the Association of Universities for Research in Astronomy, Inc., under cooperative agreement with the National Science Foundation. scripts to correct fiber identification mismatch and remove cosmic rays.
The different relative transmission of the VIMOS quadrants was corrected by comparing the intensity of the night-sky emission lines. The sky offset observations were used to construct sky spectra. To compensate for the time variation of the relative intensity of the night-sky emission lines, we compared the fluxes of the sky lines measured in the offset and on-target exposures. The corrected sky spectra were then subtracted from the corresponding on-target exposures. The (very) small amplitude of fringing patterns in the reduced VIMOS spectra was corrected following the prescriptions by Lagerholm et al. (2012).
Each exposure was organized in a data cube using the tabulated correspondence between each fiber and its position in the field of view. For each galaxy, the sky-subtracted data cubes were aligned using the bright galaxy nucleus as reference and co-added into a single data cube. Spectra from fibers mapping adjacent regions in the sky were added together using the Voronoi binning method (Cappellari & Copin 2003) to increase the signal-to-noise ratio (). Some of the spatial bins in NGC 3593 were modified to include only spectra from the regions associated with intense ionized-gas emission or the dust lanes crossing the galactic disk. We tested the robustness of our results using different binning schemes.
3 Spectroscopic decomposition
For both galaxies, we separated the contribution of the ionized-gas component and the two counter-rotating stellar disks to the observed spectrum using the novel implementation of the penalized pixel fitting code (pPXF, Cappellari & Emsellem 2004) developed in Coccato et al. (2011).
In each spatial bin, the code builds two synthetic templates (one for each stellar component) as linear combination of stellar spectra from the MILES library (Sánchez-Blázquez et al. 2006) at Å spectral resolution (Beifiori et al. 2011) and convolves them with two Gaussian line-of-sight velocity distributions (LOSVDs) with different kinematics. Spectra are normalized to their continuum level at 5100 Å, therefore the relative contribution of each component to the total spectrum is in terms of light. Gaussian functions are added to the convolved synthetic templates to account for ionized-gas emission lines (H, H, [O III], and [N I]) and fit simultaneously to the observed galaxy spectra. Multiplicative Legendre polynomials are included to match the shape of the galaxy continuum, and are set to be the same for the two synthetic templates. The use of multiplicative polynomials also accounts for the effects of dust extinction and variations of the instrument transmission.
The spectroscopic decomposition code returns the spectra of two best-fit synthetic stellar templates and ionized-gas emissions, along with the best-fitting parameters of luminosity fraction, velocity, and velocity dispersion. The line strength of the Lick indices of the two counter-rotating components will be then extracted from the two best-fit synthetic templates.
3.1 Errors on measured parameters
We carried on a set of Monte Carlo simulations on a set of artificial galaxy spectra to quantify the errors on line-of-sight velocity, luminosity fraction, and equivalent width as done in Coccato et al. (2011). The simulations account for the characteristic velocity dispersion of our galaxies ( ), and the typical ratios, wavelength coverage, and spectral resolution of our VIMOS observations. Errors in the measured quantities depend on the quantities themselves, and on their combinations.
In the nuclear regions where the is high ( Å-1), the errors are mainly affected by the small velocity difference of the two stellar components ( ). In the outermost regions, where the velocity difference between the two stellar components is large ( ), errors are due to the low ( Å-1). Errors on the line-of-sight velocity exceed 50 for a luminosity fraction smaller than 20 per cent. Therefore, we set such a value as a lower limit for a component to be detected. In NGC 3593 errors in radial velocity do not exceed 40 , whereas in NGC 4550 they do not exceed 30 . Typical errors in the equivalent width are 0.6 Å in NGC 3593 and 0.2 Å in NGC 4550.
4 Results of the spectroscopic decomposition
We applied our spectroscopic decomposition technique to recover the kinematics, surface brightness, properties of the stellar populations, mass surface density of the counter-rotating stellar disks, and distribution and metallicity of the ionized-gas component of NGC 3593 and NGC 4550.
In the following, we present our results. For each stellar component, we discarded from the analysis all the spatial bins where the contribution to the total luminosity is lower than either 20 per cent or where the noise standard deviation was computed from the residuals between measured and best-fitting spectra in the wavelength range 5000–5400 Å.
The data extend out to along the photometric major axis of the two galaxies, which correspond to 0.8 kpc and 2 kpc for NGC 3593 and NGC 4550, respectively. The spatial sampling ranges from arcsec2 in the central regions up to arcsec2 in the outermost bins.
From now on, we will refer as “main” to the most massive stellar component, and “secondary” to the other. In the equations, we will indicate them with the subscripts 1 and 2, respectively. We will show in Section 4.4 that in both galaxies the secondary and less massive component is the one rotating in the same direction of the ionized gas.
4.1 Stellar and ionized-gas kinematics
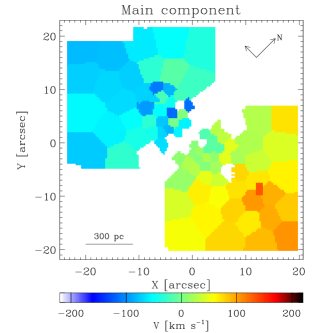
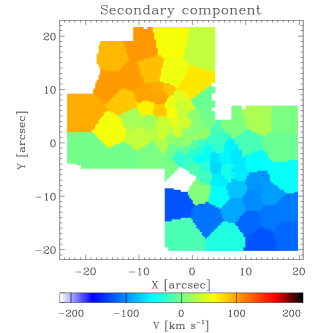
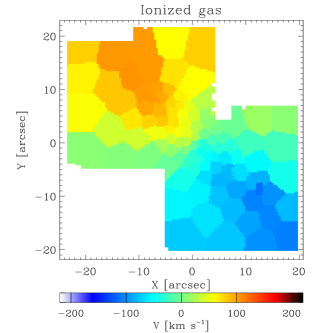
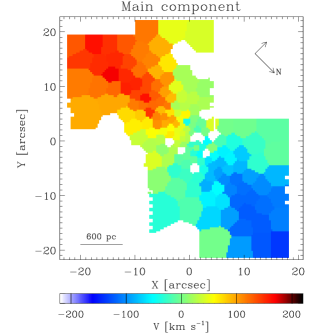
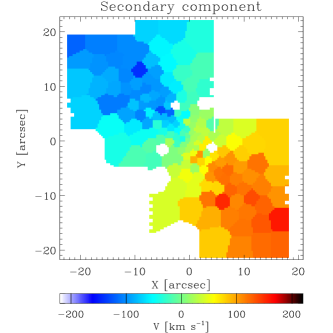
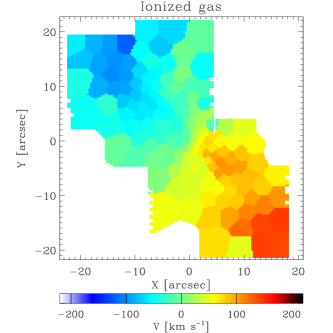
The velocity fields of the main and secondary stellar components and ionized gas of NGC 3593 and NGC 4550 are shown in Figures 2 and 3, respectively.
In the case of NGC 4550, the was high enough to allow the two LOSVDs to have different velocity dispersions. The is lower in the case of NGC 3593, and therefore we decided to decrease the degree of freedom in the fit by setting the two LOSVDs to have the same velocity dispersion in the majority of the bins. This is a good approximation if we take into account the small difference in velocity dispersion between the two stellar components measured by Bertola et al. (1996) on long-slit spectra444Bertola et al. (1996) measured in the center and at where the main and the secondary stellar components dominate, respectively., the spectral resolution, and the mean instrumental velocity sampling ( pixel-1 at 5100 Å) of the VIMOS observations.
In both galaxies we did not observe a central peak in the stellar velocity dispersion; this indicates that the contribution of the bulge component is negligible.
Our results confirm the presence in both galaxies of a stellar disk and a ionized-gas disk that counter-rotate with respect to the main galaxy disk.
NGC 3593
The main stellar component reaches a line-of-sight rotation of at ( pc) along a direction consistent with the galaxy photometric major axis. This rotation is slightly higher than that measured by Bertola et al. (1996, ) at the same distance. This is because in the previous work the line of sight velocity distributions of the two stellar components were not fully resolved at . The secondary stellar disk and ionized-gas components counter-rotate with respect to the main component, and their velocity is , consistent with that of the ionized-gas measured by Bertola et al. (1996).
The stellar velocity dispersion ranges between ; the velocity dispersion of the ionized gas is .
NGC 4550
The main stellar disk rotates by at ( kpc), while the secondary stellar disk and the ionized-gas component rotate slightly slower ( ). Our measurements are consistent with the long-slit absorption-line and [O iii] kinematics of Rix et al. (1992) and Johnston et al. (2012b), and the ionized-gas kinematics of Sarzi et al. (2006) from H and [O iii]. On the contrary, Rubin et al. (1992) measured a larger rotation ( ) for the H, [N II] and [S II] emission lines. Unfortunately, we do not have enough spectral coverage to investigate the difference in the kinematics of these emission lines.
The velocity dispersions of the two stellar disks are very similar: the main component has in the center, followed by a decline outside (1 kpc), where . The velocity dispersion of the secondary component instead ranges between . The velocity dispersion of the ionized gas is .
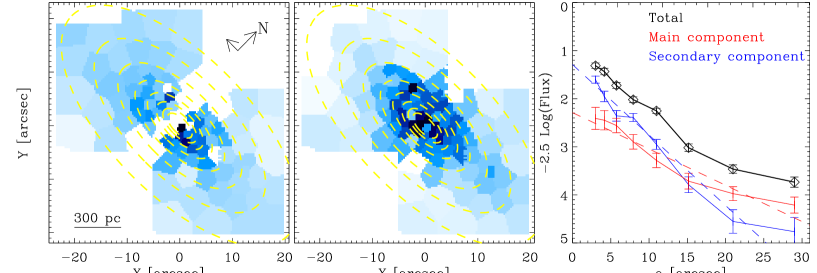
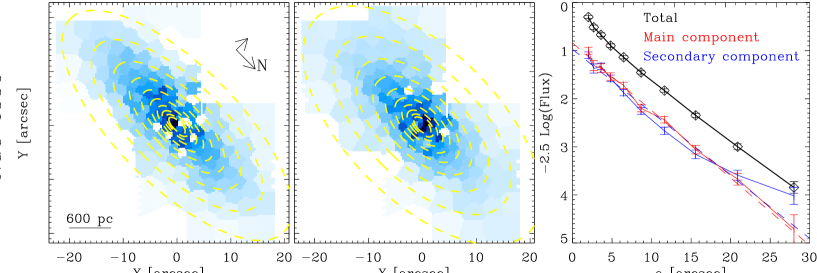
4.2 Stellar surface brightness
We extracted the surface-brightness maps of the two stellar disks from their relative luminosity fraction (obtained in the spectral decomposition) and the observed total flux (obtained by collapsing the data-cube along the dispersion direction).
The stellar surface-brightness maps and radial profiles are shown in Figure 4.
NGC 3593
In NGC 3593, a preliminary fit with the IRAF task ELLIPSE (Jedrzejewski 1987) indicated that the two stellar disks have the same mean ellipticity and orientation on the sky within the errors. We therefore computed their median surface brightnesses along concentric ellipses, adopting the same ellipticity and position angle PA, both constant with radius.
The surface-brightness profiles of the two stellar disks in NGC 3593 did not reveal any remarkable structure such as rings or spiral arms above the noise level (Fig. 4). We parametrized their light distributions with two exponential disks (Freeman 1970), which we found to have different scale lengths: ( pc) and ( pc). Bertola et al. (1996) reported similar scale length for the secondary component (, 340 pc), but larger value for the main component (, 1.4 kpc). The discrepancy is due to the fact that we probe a different band and our data probe only the inner , where the main stellar component is still faint. The different scale lengths of the counter-rotating stellar disks make the secondary stellar component to dominate the total galaxy light profile inside , whereas the main stellar disk dominates outside. The transition radius between the light contribution of the two stellar disks is consistent with the photometric decomposition by Bertola et al. (1996).
NGC 4550
In NGC 4550, a preliminary fit with the IRAF task ELLIPSE indicates that the two stellar disks have similar orientation on the sky but different mean ellipticity. We therefore compute the median surface brightness along concentric ellipses with the same PA and different ellipticities (, ).
The two stellar disks in NGC 4550 have the same scale length within errorbars (, i.e. pc, and , i.e. pc) and the same luminosity, as found by Rix et al. (1992) from long-slit data. Their apparent flattening is different, meaning that they have different scale heights (Fig. 4). Assuming the observed mean ellipticities ( and , see Sect. 4.2) and a common inclination for the two stellar disks, we find that the minimum allowed inclination is , which leads to intrinsic flattenings of and . The intrinsic flattening was computed from , for an oblate spheroid with measured flattening and inclination .
Emsellem et al. (2004) presented the mean stellar velocity field showing that the rotation is dominated by one component (corresponding to our main component) in a thin region along the major axis, while in a broad region away from the major axis the rotation is dominated by the other component (which rotates accordingly to the ionized gas). Their explanation is that the two components must have very different scale heights (Cappellari et al. 2007). This is not in contrast with the mild difference in the apparent flattening we found instead. In fact, the limitation of a single component fit is that it indicates only where one component is dominant; this leads to an overestimation of the flattening difference. On the contrary, our spectroscopic decomposition allows to measure both the two underlying spatial surface-brightness distributions, and to properly quantify the flattening. Alternatively, one can assume the same intrinsic flattening for both components. This would imply that the two stellar disks have different inclinations (Afanasiev & Sil’chenko 2002). Extrapolating the typical value of S0/Sa galaxies (, Guthrie 1992) to NGC 4550 (E7/S0), it results: and .
4.3 Line-strength indices and stellar populations
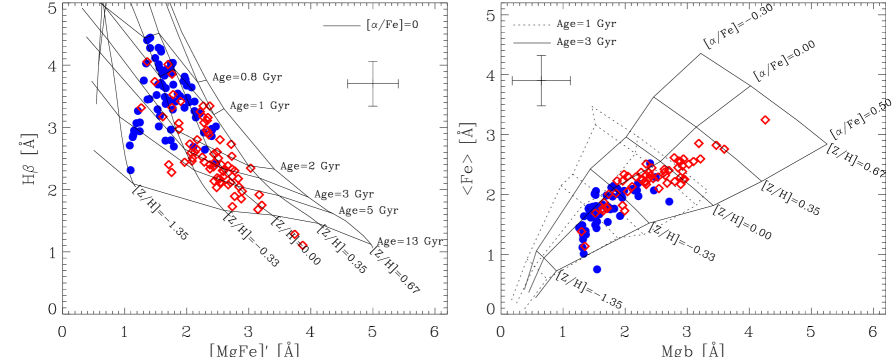
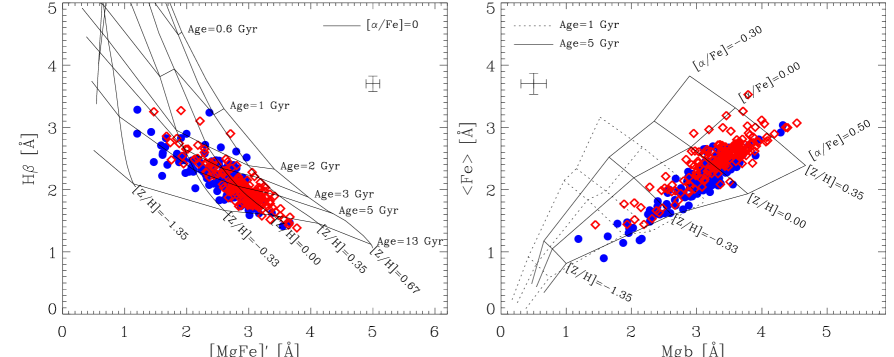
In each galaxy, we derived the properties of the stellar populations of the two stellar counter-rotating components by measuring the line strength of the Lick indices H, Mg b, Fe5270, and Fe5335 (Worthey et al. 1994) on the best fit synthetic templates returned by the spectroscopic decomposition. To this aim, the spectra were set to rest-frame by adopting the measured radial velocity and convolved with a Gaussian function to match the spectral resolution of the Lick system ( Å, Worthey & Ottaviani 1997). From the measured indices, we calculated the mean iron index = (Gorgas et al. 1990) and the combined magnesium-iron index [MgFe]. The [MgFe]′ index is almost independent from -enhancement and hence serves best as a metallicity tracer (Thomas et al. 2003).
In Figure 5 we compare the measured indices with the predictions of single-age stellar populations (SSP) model by Thomas et al. (2011) that takes into account abundance ratios of elements different from solar. Alternative line-strength indices as H (Cervantes & Vazdekis 2009) led to consistent results. We decided to present the analysis based on the “classic” H spectral index for consistency to our previous work on NGC 5179 (Coccato et al. 2011).
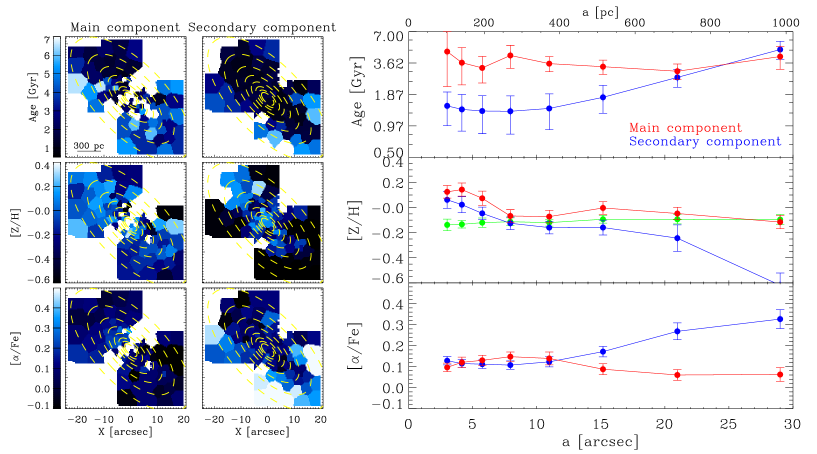
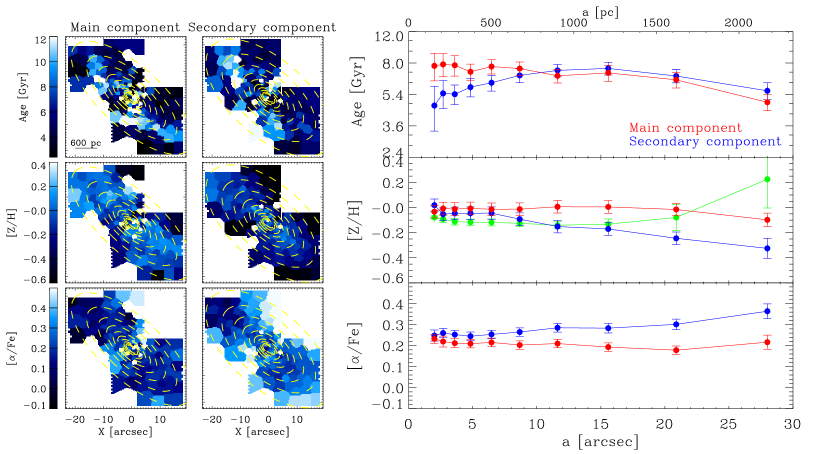
We then fitted the Thomas et al. (2011) models to the measured indices to get two-dimensional maps of the luminosity-weighted mean stellar population age, metallicity ([Z/H]), and -enhancement ([/Fe]) of the two stellar components in the sample galaxies. They are shown in the left panels of Figure 6, and their luminosity-weighted values are given in Table 2. We also studied the radial dependence of these stellar population parameters, by computing their luminosity-weighted mean values along concentric ellipses using the same geometrical parameters adopted in Sect. 4.2. They are shown in the right panels of Figure 6. Errorbars on the radial profiles are computed as , where is the standard deviation of the measurements within each ellipse, and is the number of Voronoi bins within the ellipse.
MILES stars belong to the Milky Way and this makes the stellar library trapped along the essentially one-parameter trend with a rise of [Mg/Fe] while decreasing [Fe/H] that translates into an anti-correlation between [/Fe] and [Z/H]. This trend has a spread of 0.5 dex in [Mg/Fe] and it is steeper in the metal-poor regime () while it is shallower for stars with (e.g., Milone et al. 2011). Since we measured the Lick indices for linear combinations of MILES stars, the final values of [/Fe] and [Z/H] we derived from SSP models could be not completely independent.
The anti-correlation between [/Fe] and [Z/H] is observed in the outer regions () of our galaxies where we measured low values of metallicity (Fig. 6), whereas it is less strong in the central regions () where the metallicity is higher (). The ability of the fitting tool of recovering the anti-correlation between -enhancement and metallicity is an independent indication of its robustness.
We used [/Fe] as a proxy of the star-formation time scale following the approximation by Thomas et al. (2005, Equation 4). The main sources of errors on are the uncertainties about SN Ia progenitors and delay time distributions (e.g., Pritchet et al. 2008) and dependence of our measurements of -enhancement on metallicity.
| [Gyr] | |||
|---|---|---|---|
| NGC 3593 | |||
| Main: | |||
| Secondary: | |||
| NGC 4550 | |||
| Main: | |||
| Secondary: |
Notes– and are given in logarithm of solar units. Errors are computed as the standard deviation of the measurements divided by the square root of the number of spatial bins.
NGC 3593
The two stellar disks in NGC 3593 have different spectral properties. This difference is visible in the diagnostic plots of Fig. 5, which compare the equivalent widths of H, Mg and Fe absorption lines. Unfortunately, the two-dimensional maps of the stellar population properties (age, [Z/H], [/Fe]) do not highlight this separation as clearly, because of the scatter in the measurements; the radial profiles in Fig. 6 serve better to this purpose. Although in some radial bins the two stellar components have consistent stellar population properties within the errorbars, there are clear systematic trends with radius.
The age difference between the two components is clearly visible for ( pc). In this radial range, the main component is the oldest ( Gyr) and the secondary component, associated with the gas, is the youngest ( Gyr).
The main component is systematically more metal rich ( dex) than the secondary component ( dex). Both components have a metallicity peak in the central 150 pc: main component: dex, secondary component: dex. The metallicity gradient of the secondary component is steeper than that of the main component.
The main and secondary components are both characterized by an intermediate star-formation time scale ( Gyr) till ( pc), whereas the outer parts of the secondary component are characterized by a much shorter time scale ( Gyr).
NGC 4550
The spectral properties of the two stellar disks in NGC 4550 are very similar, although there is an indication that the main component has slightly larger mean values of Mg b and Fe and smaller mean values of H than the secondary component (Fig. 5). Our line-strength measurements of the Lick indices agree with the average values measured by Johnston et al. (2012b) for both the counter-rotating components. Nevertheless, Johnston et al. (2012b) derived a mean age of the secondary component (2.5 Gyr), which is younger than ours (6.5 Gyr). This is due to the differences in the adopted SSP models and performed analysis. Indeed, we used the models of Thomas et al. (2010) and computed the luminosity-weighted average of all the SSP parameters we measured on the two-dimensional field of view, whereas Johnston et al. (2012b) fit the models of Vazdekis et al. (2010) to the arithmetic mean of the equivalent widths they measured in long-slit data.
The total galaxy luminosity-weighted age within (1.2 kpc) is Gyr. This is consistent with the luminosity weighted age from a single component model ( Gyr, Kuntschner et al. 2010), although different authors claim ages larger than 10 Gyr (Afanasiev & Sil’chenko 2002). The same is not true for the mean metallicity ( dex) and mean /Fe abundance ratio ( dex) within 1, where luminosity weighted values found by Kuntschner et al. (2010) are more metal poor ([Z/H] dex) and slightly less enhanced ([/Fe] dex). The difference is probably due to the different iron lines used to probe the total metallicity and abundance ratio, and to the limited spectral resolution and wavelength range of the previous work.
The two-dimensional maps of the single stellar population parameters show a small systematic difference in the total luminosity-weighted values of metallicity (see Tab. 2), but not a significant difference in age. This is due to the fact that the spectral H signatures are very similar for stellar ages greater than 4 Gyr, and it is not easy to separate them with our accuracy ( 0.2 Å). As in the case of NGC 3593, the stellar population values of the two stellar disks overlap within the errorbars in some radial bins, but systematic differences are present. This is shown by the radial profiles in Fig. 6: the main component is more metal rich and less -enhanced almost at all radii.
The main difference in age is observed in the central (400 pc), where Gyr, and Gyr.
The main component has nearly solar metallicity at all radii ( dex), while the secondary component varies from nearly solar at the center ( dex) down to subsolar outside 1.2 kpc ( dex). The metallicity gradient of the secondary component is steeper than that of the main component.
The derived mean stellar formation time scale of the main component is Gyr, and it is faster for the secondary component ( Gyr).
4.4 Mass surface density
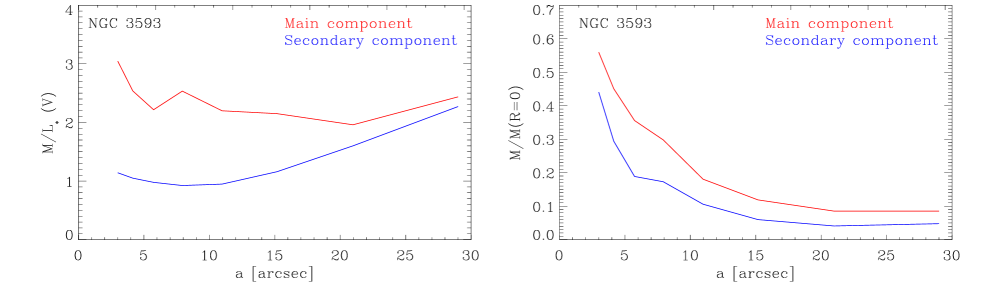
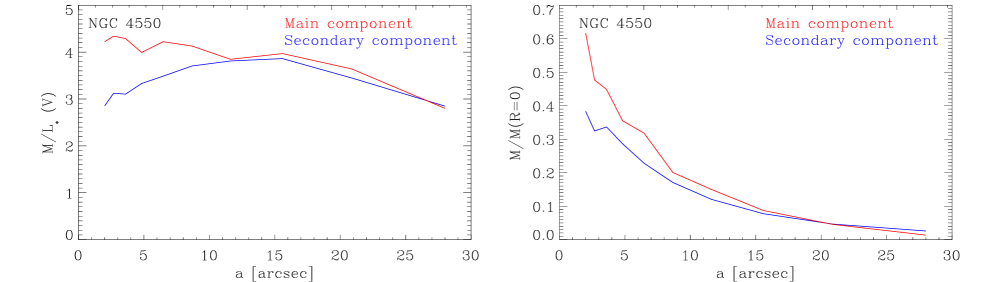
From the surface brightness and stellar population properties we can derive the mass surface density associated to each component. We used the stellar population models by Maraston (2005) to recover the stellar mass-to-light ratios from our stellar population measurements, and we then multiplied them for the light contribution measured from the spectra to get the mass. Since no flux calibration was performed, the mass profiles are relative to the central value. The radial profiles of stellar mass and mass-to-light ratios are shown in Figure 7.
In both galaxies, the stellar component that rotates in the same direction of the gas is the less massive one. In NGC 3593 this is true at all radii. In NGC 4550 this difference is evident only in the inner (550 pc), whereas the mass distributions of the two stellar disks are very similar outside.
4.5 Ionized-gas distribution
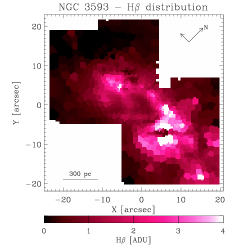
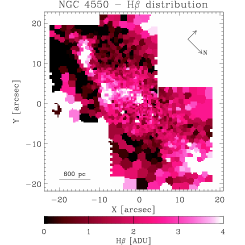
The two-dimensional distributions of the ionized gas in NGC 3593 and NGC 4550 derived from the fit to the H emission line are shown in Figure 8. These maps were produced using a specific Voronoi binning scheme with high spatial resolution, optimized to highlight the morphology of the H distribution.
In NGC 3593, the map of the H emission displays an asymmetric ring-like structure with a peak-to-peak diameter of ( pc), which is more intense on the W side of the galaxy. The dimension and asymmetry of the H ring are very similar to those of the H+[N II] ring found by Corsini et al. (1998), and to those of the C0 ring found by García-Burillo et al. (2000).
In NGC 4550, the H distribution is patchy; in particular, there is a large double-peaked asymmetric structure in the central regions (either a ring or a disk) with a peak-to-peak diameter of ( pc). The spatial extension of this H structure is similar to that of the regions where the mass density profile of the main disk is higher (see Section 4.4) and the secondary disk is younger (see Section 4.3, right panel). The dimension of this inner H structure is consistent with the region where CO emission is detected (Crocker et al. 2009).
4.6 Ionized-gas metallicity
The gas-phase metallicity is one of the most important observational diagnostics of the current evolutionary state of galaxies and, in the particular cases of NGC 3593 and NGC 4550, its measurements can give important information on the relationship between the ionized-gas and the two counter-rotating stellar components.
We used the empirical relations between the intensity of the nebular lines and metallicity to estimate the gas-phase metallicity. Since only the H and [O iii] lines are present in the spectral range we adopted the R3 emission-lines ratio parameter (Liang et al. 2006) defined as:
| (1) |
The galaxy spectra were not flux-calibrated. For this reason we followed the approach suggested by Kobulnicky & Phillips (2003) and recently adopted in Morelli et al. (2012) to replace the fluxes of the emission lines with their equivalent widths. This method does not need flux-calibrated spectra and has the further advantage of being insensitive to reddening. Thus, we measured the equivalent widths of the [O iii], and H emission lines in the best-fit spectrum. For each emission line, we considered a central bandpass covering the feature of interest and two adjacent bandpasses, at the red and blue side, tracing the local continuum. The continuum level underlying the emission line was estimated by interpolating a straight line in the continuum bandpasses of the spectra of the secondary component associated with the gas. The used bandpasses are defined following González (1993, Sect. 4.3) for H, [O III], as done in Morelli et al. (2012).
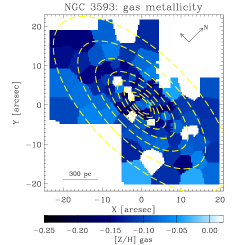
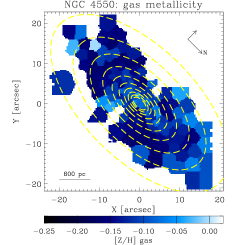
The gas-phase metallicity measured for NGC 3593 and NGC 4550 was converted to [Z/H] following Sommariva et al. (2012). The gas metallicity maps are shown in Figure 9. The luminosity-weighted mean values along concentric ellipses were obtained as in Sect. 4.3 and are plotted in Fig. 6.
NGC 3593
The metallicity distribution of the gas shows an hint of a ring-like structure of similar dimension of the H ring detected in Fig. 8. The metallicities of gas and stars are consistent for pc. On the contrary, in the nucleus of the galaxy, the gas metallicity remains constant at [Z/H] dex, while the metallicity of the stars rises above 0.1 dex (see Sect. 4.3 and Fig. 6). This discrepancy is probably due to the fact that in the very center of the galaxy the H emission is almost absent (Fig. 8); therefore in the center the star formation is less efficient today, and the present generation of stars in this region formed from a different enriched primordial gas.
NGC 4550
The gas metallicity distribution in NGC 4550 does not present particular structures in its two-dimensional map. Out to (1.5 kpc) the mean metallicity of the ionized gas is [Z/H] dex, further out it peaks to dex. The gas-metallicity radial profile is in good agreement with the metallicity of the stellar components up to the very center, confirming that the star-formation occurring in the gas disk is forming the secondary component. Contrary to NGC 3593, there are no differences between gas and stellar metallicity in the center of the galaxy. This is due to the fact that in this galaxy the star-formation, as traced by the H emission, is occurring in a patchy structure all over the disk extension (Fig. 8) and not mostly in the central structure.
5 Discussion
The morphology, kinematics, and properties of the stellar populations of NGC 3593 and NGC 4550 present both similarities and differences, which help us in investigating their origin and assessing the most efficient formation mechanism.
5.1 Origin of the large-scale counter-rotating stellar disks
In each galaxy, the main stellar disk (i.e. the most massive) hosts a secondary stellar disk and a ionized-gas disk that counter-rotate with respect to it. In both galaxies, the stars in the secondary disk are on average younger, more metal poor, and more -enhanced than the stars in the main disk. The differences in mass and age between the two counter-rotating stellar disks are more pronounced in NGC 3593 than in NGC 4550. In NGC 3593 the two stellar disks have the same intrinsic flattening but different scale lenghts, whereas in NGC 4550 the secondary component is slightly thicker than the main component, and they have the same scale length. Both galaxies host an asymmetric H structure in their central kpc of similar size: it is 650 pc wide with a ring-like shape in NGC 3593, and 800 pc wide in NGC 4550. These H structures match the regions where the secondary stellar disks are younger.
Our findings support the scenario of a gas accretion followed by star formation as the origin for the stellar and gas counter-rotation in both galaxies.
A pre-existing galaxy disk (that corresponds to the “main” component, as defined in Sect. 4) acquired gas from outside onto retrograde orbits. The amount of acquired gas must have been large enough to remove the pre-existing gas. The new gas first accreted in the outer regions of the galaxy, where formed rapidly new stars. The star-formation time-scale in the outer regions of the secondary stellar disk is indeed shorter than 500 Myr in both galaxies, as inferred from the /Fe overabundance. Then, the star formation continued outside-in with a longer time scale, as inferred from the radial gradients in age and metallicity, which are more pronounced in the secondary component than in the main component. This process generated the secondary counter-rotating stellar components in both galaxies. These components are indeed younger than the corresponding main components and their angular momenta are aligned with that of the ionized-gas disks.
The presence of molecular clouds, traced by the CO emission, which co-rotate with both the secondary stellar disk and ionized-gas disk, is suggestive of star formation in the secondary component (see Wiklind & Henkel 1992; García-Burillo et al. 2000 for NGC 3593 and Crocker et al. 2009 for NGC 4550). The newborn stars have on average lower metallicity and, as a consequence of the anti-correlation between [Z/H] and [/Fe], they are more -enhanced than the stars in the main stellar disk. This depends on the nature of the gas accreted by the two galaxies.
The difference between the luminosity-weighted ages of the two counter-rotating stellar components dates the gas accretion event. In NGC 3593 the accretion occurred between 2.0 and 3.6 Gyr ago, i.e. Gyr after the formation of the main stellar disk. In NGC 4550, our measurements do now allow a precise dating: it occurred 7 Gyr ago, less than 1 Gyr after the formation of the main stellar disk.
Also the metal content of the ionized gas is consistent with the proposed gas-accretion scenario, although the fact that the metallicity of the gas component is similar to metallicity of both the stellar disks is intriguing. This may suggest that the acquired gas mixed with the pre-existing gas, responsible for the formation of the main component. The final mixture of gas therefore depends on the relative enrichment and amount of the acquired and pre-existing gas, and on the additional enrichment subsequent to the formation of the secondary stellar component.
Although the metallicities of the ionized gas and the two stellar disks are similar on average, in the central 250 pc of NGC 3593 we measured a lower gas metallicity with respect to the stars (Sect. 4.6). This difference between the two galaxies can be ascribed either to a different formation scenario or to a different evolutionary stage in the formation process. In this latter hypothesis, the gas metallicity of NGC 4550 represents the final stage of the assembly process of the counter-rotating disk, which is still at work in NGC 3593: the stellar disk is forming outside-in, and the star formation will reach the center and then disappear, leaving stellar and ionized-gas components with approximately the same metallicity trend, as observed in NGC 4550. This interpretation is consistent with the different ages of the secondary stellar disks of the two galaxies.
To date, the stellar populations of counter-rotating stellar disks of comparable sizes were successfully disentangled only in three disk galaxies. They are: NGC 5179 (Coccato et al. 2011), NGC 3593 and NGC 4550 in this work. In all of them, the stellar component co-rotating with the gas is younger, less massive and has different composition than the main stellar component, in agreement with the gas-accretion scenario. In NGC 5719, the gas-accretion event is traced by a stream of neutral hydrogen that connects the galaxy with its neighbor NGC 5713 (Vergani et al. 2007). Although we do not have the same evidence for NGC 3593, its stellar populations are very similar to those of NGC 5719; this makes us confident that these two galaxies share the same formation mechanism. The situation is not so clear for NGC 4550, as the differences in the stellar population properties between the two stellar counter-rotating disks are not as evident as in NGC 3593.
The scenario of internal origin of the secondary counter-rotating components is ruled out, as it would predict the same mass and stellar population for both components. The internal-origin scenario is ruled out even if we include a rejuvenation process for the secondary component (i.e. in the inner 850 pc of NGC 3593, and in the inner 400 pc of NGC 4550). In this alternative case in fact, the secondary stellar component is expected to have higher metallicity (as the result of star formation from enriched gas) and lower -enhancement (as the result of the increased star-formation time scale, due to the coexistence of old and young stars) than the main stellar component in the regions where younger ages are measured. All these predictions are not consistent with our observations, and therefore we discard such a scenario.
On the contrary, a binary galaxy merger cannot be completely ruled out by our measurements as the formation mechanism of counter-rotating stellar disks, given the limited galaxy sample and given that we have conclusive evidence of gas accretion only for one case. According to Crocker et al. (2009), the merging scenario explains the fact that the gas rotates together with the thicker component in NGC 4550. On the other hand, we show that the difference in thickness between the two counter-rotating stellar disks in NGC 4550 is not as pronounced as the one that can be guessed without a proper spectral decomposition. In addition, we found that the thicker stellar component is the youngest, and therefore it is the accreted component, whereas in the simulations the thicker component is the pre-existing stellar disk that was dynamically heated by the merging process (Crocker et al. 2009).
5.2 The most efficient mechanism to form large-scale counter-rotating stellar disks
We know that both binary mergers and episodes of gas accretion do occur in our Universe, therefore they are both viable mechanisms to create large-scale counter-rotating stellar disks. However, the relative fraction of counter-rotating components built by these processes is still unknown.
As stated in the introduction, in the gas-accretion scenario the stellar component associated with the ionized gas is predicted to be always younger than the main stellar component. In binary galaxy mergers instead, one would expect that the younger stellar component is associated with the ionized gas only in 50 per cent of the cases. Let’s define as the fraction of galaxies hosting two counter-rotating stellar disks of comparable sizes that were generated by a binary major merger (thus, is the fraction produced by gas accretion), and as the event of finding the stellar component co-rotating with the gas to be the youngest.
The probability to observe is:
| (2) |
The probability to observe in exactly galaxies out of a sample of counter-rotating galaxies is the first term of the Binomial distribution:
| (3) |
The value of for which is maximum gives us the most probable value of the fraction of counter-rotating galaxies produced by merger events. The condition:
| (4) |
defines the error bar on . In our case () we find that the fraction of counter-rotating galaxies built by binary mergers is per cent. Therefore, measuring the difference in age of the counter-rotating components in a larger sample of counter-rotating galaxies is fundamental to identify the most efficient mechanism. Large spectroscopic surveys like Atlas3D (Cappellari et al. 2011) or CALIFA (Sánchez et al. 2012) will help to identify other potential candidates by recognizing the kinematic signatures of stellar counter-rotating disks, like two symmetric peaks in the velocity dispersion map (Krajnović et al. 2011).
6 Summary
We presented the VIMOS/VLT two-dimensional kinematics of the stars and the ionized-gas in the two disk galaxies NGC 3593 and NGC 4550, which are known to host a stellar and a ionized gas disks that are counter-rotating with respect the main galaxy disk.
We applied the novel spectroscopic decomposition technique introduced in Coccato et al. (2011) to separate and measure from two-dimensional spectroscopic data the morphologies, the kinematics, the stellar populations, and the mass surface densities of both the two counter-rotating stellar disks in the sample galaxies for the first time.
We found that in both galaxies the two stellar disks have different stellar population properties, as measured by the equivalent width of the H, Mg and Fe absorption lines. The difference is more evident in NGC 3593 than in NGC 4550. Both galaxies host a counter-rotating stellar disk, which rotates along the same direction of the ionized gas, and which is on average less massive, younger, metal poorer, and more enhanced than the main stellar galaxy disk. Our results support the scenario of external gas acquisition, followed by a subsequent outside-in star formation as the origin of the observed counter-rotation. In NGC 3593, we are able to date the acquisition event that formed the counter-rotating stellar disk ( Gyr after the formation of the main galaxy disk), while for NGC 4550 we can set only an upper limit (less than 1 Gyr after the formation of the main galaxy disk).
Our results, combined with previous studies in the literature, rule out the internal scenario as the origin of counter-rotation in the studied galaxies. On the contrary, the merger scenario cannot be completely ruled out, given the small statistic available. Thus, a larger sample is necessary to identify the most efficient mechanism.
Acknowledgements.
We wish to thank the referee G. Worthey for his useful comments that helped to improve this paper. LC acknowledges financial support from the European Community’s Seventh Framework Programme (/FP7/2007-2013/) under grant agreement No. 229517. The work has been partially founded by the grants 60A02-1283/10, 60A02-5052/11, 60A02-4807/12 of the Padua University.References
- Afanasiev & Sil’chenko (2002) Afanasiev, V. L. & Sil’chenko, O. K. 2002, AJ, 124, 706
- Balcells & González (1998) Balcells, M. & González, A. C. 1998, ApJ, 505, L109
- Beifiori et al. (2011) Beifiori, A., Maraston, C., Thomas, D., & Johansson, J. 2011, A&A, 531, A109
- Bertola et al. (1992) Bertola, F., Buson, L. M., & Zeilinger, W. W. 1992, ApJ, 401, L79
- Bertola et al. (1996) Bertola, F., Cinzano, P., Corsini, E. M., et al. 1996, ApJ, 458, L67
- Bertola & Corsini (1999) Bertola, F. & Corsini, E. M. 1999, in IAU Symposium, Vol. 186, Galaxy Interactions at Low and High Redshift, ed. J. E. Barnes & D. B. Sanders, 149
- Bettoni (1989) Bettoni, D. 1989, AJ, 97, 79
- Bettoni & Galletta (1997) Bettoni, D. & Galletta, G. 1997, A&AS, 124, 61
- Bois et al. (2011) Bois, M., Emsellem, E., Bournaud, F., et al. 2011, MNRAS, 416, 1654
- Bureau & Chung (2006) Bureau, M. & Chung, A. 2006, MNRAS, 366, 182
- Cappellari & Copin (2003) Cappellari, M. & Copin, Y. 2003, MNRAS, 342, 345
- Cappellari & Emsellem (2004) Cappellari, M. & Emsellem, E. 2004, PASP, 116, 138
- Cappellari et al. (2007) Cappellari, M., Emsellem, E., Bacon, R., et al. 2007, MNRAS, 379, 418
- Cappellari et al. (2011) Cappellari, M., Emsellem, E., Krajnović, D., et al. 2011, MNRAS, 413, 813
- Cervantes & Vazdekis (2009) Cervantes, J. L. & Vazdekis, A. 2009, MNRAS, 392, 691
- Cid Fernandes et al. (2005) Cid Fernandes, R., Mateus, A., Sodré, L., Stasińska, G., & Gomes, J. M. 2005, MNRAS, 358, 363
- Coccato et al. (2011) Coccato, L., Morelli, L., Corsini, E. M., et al. 2011, MNRAS, 412, L113
- Corsini et al. (1998) Corsini, E. M., Pizzella, A., Funes, J. G., Vega Beltran, J. C., & Bertola, F. 1998, A&A, 337, 80
- Corsini et al. (1999) Corsini, E. M., Pizzella, A., Sarzi, M., et al. 1999, A&A, 342, 671
- Crocker et al. (2009) Crocker, A. F., Jeong, H., Komugi, S., et al. 2009, MNRAS, 393, 1255
- Eliche-Moral et al. (2011) Eliche-Moral, M. C., González-García, A. C., Balcells, M., et al. 2011, A&A, 533, A104
- Emsellem et al. (2004) Emsellem, E., Cappellari, M., Peletier, R. F., et al. 2004, MNRAS, 352, 721
- Evans & Collett (1994) Evans, N. W. & Collett, J. L. 1994, ApJ, 420, L67
- Freeman (1970) Freeman, K. C. 1970, ApJ, 160, 811
- Galletta (1996) Galletta, G. 1996, in Astronomical Society of the Pacific Conference Series, Vol. 91, IAU Colloq. 157: Barred Galaxies, ed. R. Buta, D. A. Crocker, & B. G. Elmegreen, 429
- García-Burillo et al. (2000) García-Burillo, S., Sempere, M. J., Combes, F., Hunt, L. K., & Neri, R. 2000, A&A, 363, 869
- González (1993) González, J. J. 1993, PhD thesis, Thesis (PH.D.)–UNIVERSITY OF CALIFORNIA, SANTA CRUZ, 1993.Source: Dissertation Abstracts International, Volume: 54-05, Section: B, page: 2551.
- Gorgas et al. (1990) Gorgas, J., Efstathiou, G., & Aragon Salamanca, A. 1990, MNRAS, 245, 217
- Graham et al. (1999) Graham, J. A., Ferrarese, L., Freedman, W. L., et al. 1999, ApJ, 516, 626
- Guthrie (1992) Guthrie, B. N. G. 1992, A&AS, 93, 255
- Haynes et al. (2000) Haynes, M. P., Jore, K. P., Barrett, E. A., Broeils, A. H., & Murray, B. M. 2000, AJ, 120, 703
- Jedrzejewski (1987) Jedrzejewski, R. I. 1987, MNRAS, 226, 747
- Jesseit et al. (2007) Jesseit, R., Naab, T., Peletier, R. F., & Burkert, A. 2007, MNRAS, 376, 997
- Johnston et al. (2012a) Johnston, E. J., Aragón-Salamanca, A., Merrifield, M. R., & Bedregal, A. G. 2012a, MNRAS, 422, 2590
- Johnston et al. (2012b) Johnston, E. J., Merrifield, M. R., Aragon-Salamanca, A., & Cappellari, M. 2012b, ArXiv: 1210.0535
- Jore et al. (1996) Jore, K. P., Broeils, A. H., & Haynes, M. P. 1996, AJ, 112, 438
- Kannappan & Fabricant (2001) Kannappan, S. J. & Fabricant, D. G. 2001, AJ, 121, 140
- Katkov et al. (2011b) Katkov, I., Chilingarian, I., Sil’chenko, O., Zasov, A., & Afanasiev, V. 2011b, Baltic Astronomy, 20, 453
- Katkov & Chilingarian (2011a) Katkov, I. Y. & Chilingarian, I. V. 2011a, ArXiv: 1111.5822
- Kobulnicky & Phillips (2003) Kobulnicky, H. A. & Phillips, A. C. 2003, ApJ, 599, 1031
- Krajnović et al. (2011) Krajnović, D., Emsellem, E., Cappellari, M., et al. 2011, MNRAS, 414, 2923
- Kuijken et al. (1996) Kuijken, K., Fisher, D., & Merrifield, M. R. 1996, MNRAS, 283, 543
- Kuijken & Merrifield (1993) Kuijken, K. & Merrifield, M. R. 1993, MNRAS, 264, 712
- Kuntschner et al. (2010) Kuntschner, H., Emsellem, E., Bacon, R., et al. 2010, MNRAS, 408, 97
- Lagerholm et al. (2012) Lagerholm, C., Kuntschner, H., Cappellari, M., et al. 2012, A&A, 541, A82
- Le Fèvre et al. (2003) Le Fèvre, O., Saisse, M., Mancini, D., et al. 2003, in Society of Photo-Optical Instrumentation Engineers (SPIE) Conference Series, Vol. 4841, Society of Photo-Optical Instrumentation Engineers (SPIE) Conference Series, ed. M. Iye & A. F. M. Moorwood, 1670–1681
- Liang et al. (2006) Liang, Y. C., Yin, S. Y., Hammer, F., et al. 2006, ApJ, 652, 257
- Lovelace & Chou (1996) Lovelace, R. V. E. & Chou, T. 1996, ApJ, 468, L25
- Maraston (2005) Maraston, C. 2005, MNRAS, 362, 799
- Merrifield & Kuijken (1994) Merrifield, M. R. & Kuijken, K. 1994, ApJ, 432, 575
- Milone et al. (2011) Milone, A. D. C., Sansom, A. E., & Sánchez-Blázquez, P. 2011, MNRAS, 414, 1227
- Morelli et al. (2012) Morelli, L., Calvi, V., Cardullo, A., et al. 2012, A&A, 544, A74
- Pizzella et al. (2004) Pizzella, A., Corsini, E. M., Vega Beltrán, J. C., & Bertola, F. 2004, A&A, 424, 447
- Pritchet et al. (2008) Pritchet, C. J., Howell, D. A., & Sullivan, M. 2008, ApJ, 683, L25
- Puerari & Pfenniger (2001) Puerari, I. & Pfenniger, D. 2001, Ap&SS, 276, 909
- Rix et al. (1992) Rix, H.-W., Franx, M., Fisher, D., & Illingworth, G. 1992, ApJ, 400, L5
- Rubin (1994) Rubin, V. C. 1994, AJ, 108, 456
- Rubin et al. (1992) Rubin, V. C., Graham, J. A., & Kenney, J. D. P. 1992, ApJ, 394, L9
- Sánchez et al. (2012) Sánchez, S. F., Kennicutt, R. C., Gil de Paz, A., et al. 2012, A&A, 538, A8
- Sánchez-Blázquez et al. (2006) Sánchez-Blázquez, P., Peletier, R. F., Jiménez-Vicente, J., et al. 2006, MNRAS, 371, 703
- Sarzi et al. (2006) Sarzi, M., Falcón-Barroso, J., Davies, R. L., et al. 2006, MNRAS, 366, 1151
- Sommariva et al. (2012) Sommariva, V., Mannucci, F., Cresci, G., et al. 2012, A&A, 539, A136
- Thakar & Ryden (1996) Thakar, A. R. & Ryden, B. S. 1996, ApJ, 461, 55
- Thomas et al. (2003) Thomas, D., Maraston, C., & Bender, R. 2003, MNRAS, 339, 897
- Thomas et al. (2005) Thomas, D., Maraston, C., Bender, R., & Mendes de Oliveira, C. 2005, ApJ, 621, 673
- Thomas et al. (2010) Thomas, D., Maraston, C., & Johansson, J. 2010, MNRAS, in press (arXiv: 1010.4569)
- Thomas et al. (2011) Thomas, D., Maraston, C., & Johansson, J. 2011, MNRAS, 412, 2183
- Vazdekis et al. (2010) Vazdekis, A., Sánchez-Blázquez, P., Falcón-Barroso, J., et al. 2010, MNRAS, 404, 1639
- Vergani et al. (2007) Vergani, D., Pizzella, A., Corsini, E. M., et al. 2007, A&A, 463, 883
- Wiklind & Henkel (1992) Wiklind, T. & Henkel, C. 1992, A&A, 257, 437
- Worthey et al. (1994) Worthey, G., Faber, S. M., Gonzalez, & et al. 1994, ApJS, 94, 687
- Worthey & Ottaviani (1997) Worthey, G. & Ottaviani, D. L. 1997, ApJS, 111, 377
- Wozniak & Pfenniger (1997) Wozniak, H. & Pfenniger, D. 1997, A&A, 317, 14