Panchromatic Calibration of Astronomical Observations
with State-of-the-Art White Dwarf Model Atmospheres
Abstract
Theoretical spectral energy distributions (SEDs) of white dwarfs provide a powerful tool for cross-calibration and sensitivity control of instruments from the far infrared to the X-ray energy range. Such SEDs can be calculated from fully metal-line blanketed NLTE model-atmospheres that are e.g. computed by the Tübingen NLTE Model-Atmosphere Package (TMAP) that has arrived at a high level of sophistication. TMAP was successfully employed for the reliable spectral analysis of many hot, compact post-AGB stars.
High-quality stellar spectra obtained over a wide energy
range establish a data base with a large number of
spectral lines of many successive ions of different
species. Their analysis allows to determine effective
temperatures, surface gravities, and element abundances
of individual (pre-)white dwarfs with very small error
ranges.
We present applications of TMAP SEDs for spectral
analyses of hot, compact stars in the parameter range
from (pre-) white dwarfs to neutron stars and
demonstrate the improvement of flux calibration using
white-dwarf SEDs that are e.g. available via registered
services in the Virtual Observatory.
Institute for Astronomy and Astrophysics, Kepler Center for Astro and Particle Physics, Eberhard Karls University, Sand 1, 72076 Tübingen, Germany, rauch@astro.uni-tuebingen.de
1 Introduction
In an ideal case, the problem of flux calibration can be simplified to
| (1) |
where is the measured stellar flux, is the radiation area, is the distance, and is the emitted flux. In an astrophysical case, additional absorption in the circumstellar, interstellar, and Earth’s atmosphere environment will reduce . This absorption occurs on both, time- and energy-dependent scales, and thus exacerbates the calibration problem (cf. these proceedings).
While observational techniques have strongly improved in the last decades, and the measurement of is performed at high precision, high resolution, and high S/N based on ground-based and space-borne instruments, the main uncertainties of Eq. 1 are found on its right side. The first challenge to minimize these is to find “simple” objects with high photometric stability whose radiation can be described by fundamental physics. White dwarfs (WDs) fulfill such requirements. Since their radius is determined be electron degeneracy, their radiative area can be calculated from
| (2) |
with
| (3) |
( is the star’s mass and its surface gravity. is the gravitational constant.).
Most of the hot, hydrogen-rich WDs (spectral type DA) with have virtually pure hydrogen atmospheres due to gravitational settling (), while the hotter WDs exhibit lines of heavier elements due to radiative levitation or weak stellar winds. This singled out in the past stars with many metal lines in their spectra as standards for flux calibration.
Moreover, WDs are nearby and, thus, their distances can be measured with high accuracy by parallaxes, particularly with the upcoming GAIA111http://www.rssd.esa.int/index.php?project=GAIA&page=index mission. A further advantage of their small distances is that WDs with extremely low interstellar reddening can be found, where the calibration problem reduces almost to the ideal case of Eq. 1 – at least for space-borne missions. The spectra of such objects can be used for panchromatic calibration (from the soft X-ray to the far infrared).
In this paper, we start with a brief summary on the application of theoretical WD spectra to the flux calibration (Sect. 2). Then (Sect. 3), we describe modeling of WD atmospheres and the calculation of synthetic spectra. In the case of G 191-B2B is demonstrated that state-of-the-art metal-line blanketed model atmospheres reproduce well its spectrum (Sect. 4). In Sect. 5, we show example for the application of DA model spectra in the cross-calibration between different instruments, An easy way to access such spectra is shown in Sect. 6. We conclude in Sect. 7.
2 Flux calibration using DA-type white dwarfs
Most of the presently known () WDs are of spectral type DA. Only a few of them are relatively bright and exhibit negligible reddening. These are a priori suited to act as primary standard stars for the flux calibration in a large variety of observatories. As a pre-requisite, however, reliable model atmospheres are necessary to compare observed with theoretical spectra. These became available in the early 1970ies, following the pioneering work of Auer & Mihalas (1969, 1970) and Mihalas & Auer (1970) who presented the first NLTE models for pure hydrogen and hydrogen + helium stellar atmospheres, respectively. Consequently, Oke (1974) presented a compilation of absolute spectral energy distributions (SEDs) for 38 WDs in the wavelength range , partly up to more than 10 000 Å.
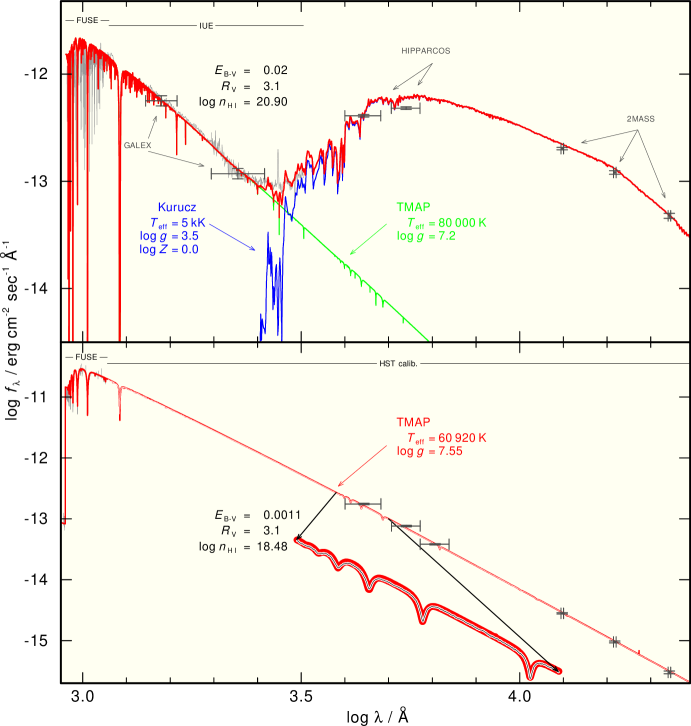
Figure 1 illustrates the advantage of an isolated DA WD in comparison to a DAO WD in a binary system – the many strong metal lines in the DAO spectrum hamper an accurate calibration in the FUV and the contribution of a cool companion spoils the low-energy region. Although the composite synthetic spectrum matches the FUV flux as well as the optical and IR magnitudes, the uncertainties in modeling both components cannot be quantified properly. This excludes such objects from the standards of panchromatic flux calibration. An isolated DA WD allows to normalize observation and synthetic spectrum to the WD brightness in the infrared where interstellar reddening is lowest. Note that there are no strong interstellar lines in the FUSE spectrum of G 191-B2B (Fig. 1).
Oke’s list included HZ 43A (WD 1314+293, for the WD numbers cf. McCook & Sion 1999, and their online catalogue222http://www.astronomy.villanova.edu/WDCatalog/index.html) and G 191-B2B (WD 0501+527). From a black body comparison, Oke found that the observed SED of G 191-B2B corresponds to a black body at . In addition, HZ 43A and G 191-B2B were amongst the brightest of Oke’s list. Together with GD 71 (WD 0549+158) and GD 153 (WD 1254+223), these were used by Bohlin et al. (1995) as primary standard stars for the Hubble Space Telescope (HST, Tab. 1).
| WD name | name | comment | ||||
|---|---|---|---|---|---|---|
| [K] | [] | |||||
| WD 0549+158 | GD 71 | 32 300 | 7.73 | 12.78 | 13.03 | |
| WD 1254+223 | GD 153 | 38 500 | 7.67 | 13.17 | 13.40 | |
| WD 0501+527 | G191-B2B | 61 300 | 7.50 | 11.44 | 11.69 | metal lines |
| WD 1314+293 | HZ 43A | 50 000 | 8.00 | 12.52 | 12.66 | binary |
The HST flux scale (Bohlin et al. 1995, 1200 Å - 8000 Å) was the reference for other calibration work, e.g. Holberg & Bergeron (2006) used it to calibrate four major ground-based systems (Johnson-Kron-Cousins UBVRI, Strömgren uvby, 2MASS333http://www.ipac.caltech.edu/2mass/ JHKs, SDSS444http://www.sdss.org/ ugriz).
Although stellar model atmospheres improved continuously in the last four decades, some problems are still unsolved, e.g. the discrepancy between determined from H i lines in ultraviolet and optical spectra (Barstow et al. 2001). In the case of G191-B2B, Lajoie & Bergeron (2007) found and . Even improved Stark line-broadening tables for H i Lyman and Balmer lines (Tremblay & Bergeron 2009) leave this discrepancy unexplained.
The recent, comprehensive analysis of more than 1100 WDs (Gianninas et al. 2011) shows significant deviations for the HST DA standard stars (Tab. 2) from previous values (Tab. 1). Note that the errors given are from their statistical approach and, thus, appear too optimistic. A calibration of IRAC aboard Spitzer ST (Bohlin et al. 2011) uses a model for G191-B2B which is within the error limits of Gianninas et al. (2011) and fulfils the desired 1 % flux-accuracy limit.
| name | ||||
|---|---|---|---|---|
| [K] | [] | |||
| GD 71 | 33 590 | 483 | 7.93 | 0.05 |
| GD 153 | 40 320 | 626 | 7.93 | 0.05 |
| G191-B2B | 60 920 | 993 | 7.55 | 0.05 |
| HZ 43A | 51 116 | 1249 | 7.90 | 0.07 |
3 Model atmospheres
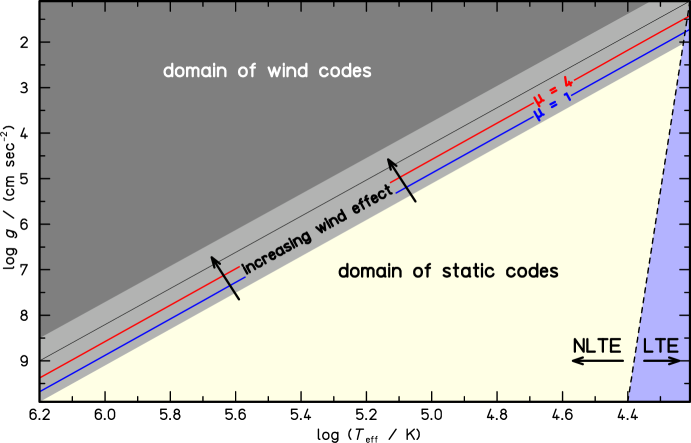
WD spectral analysis requires adequate observations (WDs are intrinsically faint) and state-of-the-art theoretical atmosphere models (cf. Oke 1974) that account for reliable physics and deviations from the assumption of a local thermodynamic equilibrium (LTE). Figure 2 shows that for cool stars with high surface gravity (spectral type B and later), LTE model atmospheres might be sufficient (Auer & Mihalas 1972). There are, however, NLTE effects in any star, at least towards higher energies and in high-resolution spectra. Aiming at a panchromatic flux calibration (at an 1 % flux-error limit, which was the designated aim mentioned in many talks at this conference) and a cross-correlation of various instruments from the soft X-ray to the infrared, the use of NLTE stellar-atmosphere models is mandatory.
Since reliable atomic data is a crucial input for model-atmosphere calculations, we start with a brief summary of existing lacks and problems in Sect. 3.1. Then, we demonstrate the successful application of NLTE atmosphere models in detailed spectral analysis and show recent discoveries (Sect. 3.2).
3.1 Atomic Data
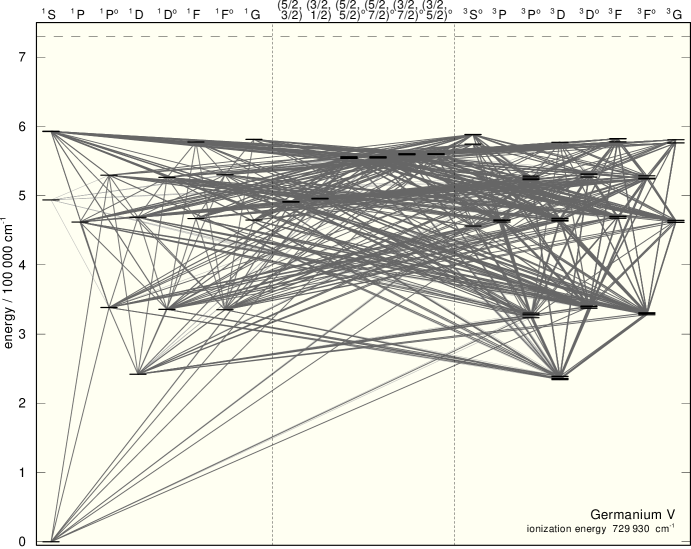
For TMAP, we compile atomic data from several standard sources like NIST555http://www.nist.gov/pml/data/asd.cfm, Kelly’s database666http://www.cfa.harvard.edu/ampcgi/kelly.pl, or CHIANTI777http://www.chianti.rl.ac.uk, the Opacity (Seaton et al. 1994) and Iron (Hummer et al. 1993) projects888http://cdsweb.u-strasbg.fr/topbase/home.html as well as Kurucz’s line lists999http://kurucz.harvard.edu/ (Kurucz 1991, 2009). The model atoms (Rauch & Deetjen 2003) are provided by the Tübingen Model-Atom Database TMAD101010http://astro.uni-tuebingen.de/~TMAD (Sect. 6). TMAD is continuously updated and extended for the most recent atomic data. Presently it provides ready-to-use, TMAP-compliant model atoms of the elements H - Ca, Ge (Fig. 3), Kr, and Xe.
3.2 On the reliability of NLTE model atmospheres
TMAP111111http://astro.uni-tuebingen.de/~TMAP (Werner et al. 2003) can calculate fully metal-line blanketed WD model atmospheres. About 1600 atomic levels and 7000 individual spectral lines of the elements H - K can be treated in NLTE. Due to a statistical treatment (Rauch & Deetjen 2003), 300 million of lines of the iron-group elements (Ca - Ni) can be considered. TMAP assumes hydrostatic and radiative equilibrium and a plane-parallel geometry. It makes use of TMAD. TMAP was successfully employed for detailed spectral analyses of hot, compact stars (e.g. Rauch et al. 2007, 2010, 2012; Wassermann et al. 2010; Werner et al. 2012). In these analyses, the models considered opacities of many elements from H to Ni.
In case of synthetic spectra for high- DA-type WDs (Sect. 1), where the calculation of pure hydrogen models is sufficient, the highest reliability is achieved because H i atomic data is accurately known. Especially, tabulated Stark line-broadening tables are available (Lemke 1997; Tremblay & Bergeron 2009). The models depend on and only, i.e. there are no other free parameters. A synthetic WD spectrum can be calculated for a large wavelength range with arbitrary resolution. Figure 4 shows the example of EG 274 (WD 1620391) for the optical to the near infrared wavelength range. The observations were performed at ESO (European Southern Observatory, Chile) with UVES (Ultraviolet and Visual Echelle Spectrograph) and SINFONI (Spectrograph for INtegral Field Observations in the Near Infrared) (cf. Vernet et al. 2008a, b). The initial aim to achieve an agreement of observation and theory better than 10 % in flux was exceeded by far.
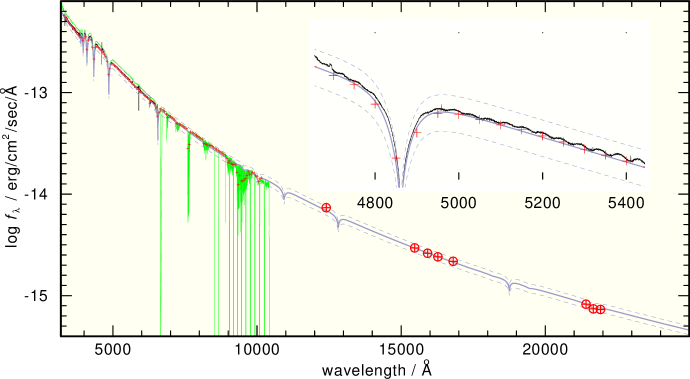
It is worthwhile to note that large observatories like ESO have large calibration programs where spectro-photometric standard stars are observed every night. The huge number of observations with different setups allows to define master spectra (Fig. 4) that help to improve the pipeline reduction of the observations. These spectra may serve also to automatically measure e.g. the nights’ conditions or to monitor the efficiency of a telescope as a whole by comparison of the master flux level of a star to that of an actual observation. Moreover, the pipeline reduction can be improved, e.g. to remove residuals of échelle orders (see insert in Fig. 4, EG 274 is a spectrum from the Advanced Data Products121212http://archive.eso.org/eso/eso_archive_adp.html).
The capability and reliability of a model-atmospheres code can be judged from its application to spectral analysis over a wide wavelength range. In general, synthetic spectra are more reliable in the low energy range because towards higher energies, the consideration of metal opacities (bound-bound as well as bound-free transitions) and the lack of atomic input data (Sect. 3.1) thwarts any atmosphere code, how sophisticated it may be. A simple look at the model-atom statistics is not sufficient. Kudritzki (1976) used the complete linearization technique of Auer & Mihalas (1969) and allowed 18 atomic levels (5 H i, 1 H ii, 5 He i, 6 He ii, 1 He iii) to deviate from LTE and included six H i line transitions in his so-called classical models. Together with 65 frequency points, he arrived at a system of 86 equations to solve simultaneously and at the accuracy limit of the 32 bit computers that were available. Present models employ the approximated lambda operator (ALO) method (Werner & Husfeld 1985; Werner 1986, 1989; Werner & Dreizler 1999) and consider all elements from H to Ni (Rauch 1997, 2003) with e.g. 686 levels in NLTE, 2417 individual lines, and millions of lines of the iron group in the analysis of LS V +46o21 (Rauch et al. 2007).
The large number of levels and lines that can be considered in the models, however, implies the difficulty to quantify e.g. uncertainties of the respective atomic data (Sect. 3.1) and, thus, the synthetic spectra. Detailed spectral analyses of high-quality spectra and the agreement between model and observation are an important measure to estimate the models’ flux accuracy. We will now present some individual examples for spectral analyses with TMAP models of compact stars with different .
3.2.1 (Pre-) white dwarfs:
The main field of our working group are post-AGB stars, with a focus on hydrogen-deficient stellar evolution. The development of observation techniques and the quality of the obtained spectra in the ultraviolet wavelength range with e.g. FUSE (Far Ultraviolet Spectroscopic Explorer) or HST/STIS (Hubble Space Telescope / Space Telescope Imaging Spectrograph) allowed the determination of stellar photospheric parameters like , , and elemental abundances with unprecedented accuracy (see Werner & Herwig 2006, and references therein). The identification of hitherto unidentified lines in FUSE and STIS spectra and abundance analyses of many of the respective species (e.g. Ne vii (Werner et al. 2004), F vi (Werner et al. 2005), Ar vi (Rauch et al. 2007), Ar vii (Werner et al. 2007a), Ne viii (Werner et al. 2007b), Ca x (Werner et al. 2008), and Fe x (Werner et al. 2010), Ga v, Ge v, As v, Se iv - vi, Kr vi, vii, Mb vi, Sn iv - v, Te vi, I vi, Xe vi, vii (Werner et al. 2012)) were the direct consequence of a continuous development of TMAP and the available atomic data. E.g. the identification of Ne viii lines (Werner et al. 2007b) followed the publication of energy levels and spectral lines of Ne viii by Kramida & Buchet-Poulizac (2006).
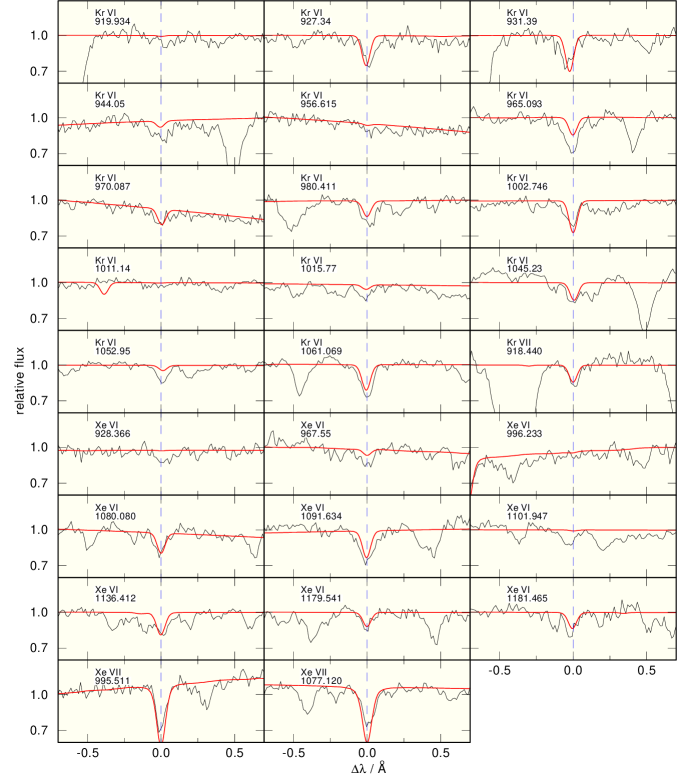
Figure 5 shows newly identified Kr and Xe lines in the FUSE spectrum of the DO-type WD RE 0503289 (Werner et al. 2012). With these discoveries, new ionization equilibria, e.g. Kr vi / vii, can be evaluated for a more precise determination of . In addition, abundance determinations of trans-iron elements establish new challenges for stellar evolutionary theory. Although Werner et al. (2012) identified 22 out of the 23 Ge v lines that are listed at NIST and five that are listed in Kelly’s database, a Ge abundance analysis was impossible due to the lack of transition probabilities. After their calculation, Rauch et al. (2012) presented a precise determination of the Ge abundance in RE 0503289 and discovered additional four Ge iv, 14 Ge v and seven Ge vi lines.
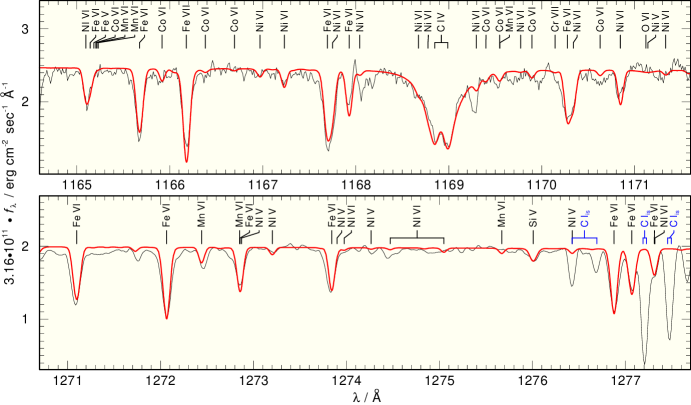
In the spectral analysis of LS V +46o21 (Rauch et al. 2007), the central star of the planetary nebula Sh 2216, it was possible to identify and reproduce about 95% of all spectral lines (more than 1000) in the FUSE and STIS spectra (Fig. 6) by the combination of a photospheric model and a model of the interstellar line-absorption Owens profile fitting procedure.
Figure 6 demonstrates the unique opportunity to employ stars as stellar laboratories for atomic physics. The large number of spectral lines, e.g. of Fe vi, allows to measure relative line strengths and to verify or improve the respective values ( is here the statistical weight of the lower level of the line transition, the oscillator strength). In addition, precise wavelength measurements in high-resolution spectra allow to improve the atomic level energies.
3.2.2 Super-soft sources:
Some months after their outbursts, novae may evolve into very bright super-soft X-ray sources (SSS). V 4743 Sgr (outburst Sep 20, 2002) was the brightest SSS in March 2003 (Ness et al. 2003). Although the origin and the physics of the nova’s spectrum is still under debate, Rauch et al. (2010) could reproduce well the strengths and shapes of lines and absorption edges and determined . Fig. 7 shows a comparison of theoretical spectra with an XMM-Newton (X-ray Multi-Mirror Mission) RGS (Reflection Grating Spectrometer) fluxed spectrum from BiRD131313http://xmm.esac.esa.int/BiRD/. Note that the given error is rather conservative, i.e. we arrive at an uncertainty level of better than 3 % even for these extremely hot objects.
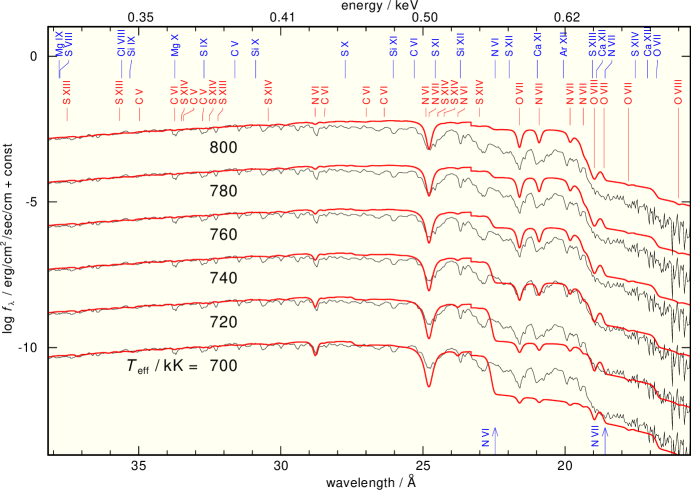
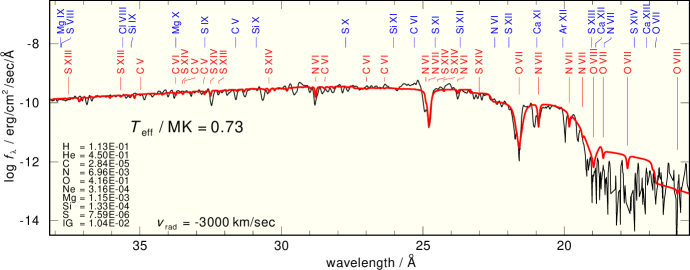
V 4743 Sgr is not the only example where our static models were used successfully to determine photospheric parameters of the WD in SSS. Nova KT Eri (outburst at Nov 25, 2009) was observed in early 2010 with Chandra and XMM-Newton. In Fig.8, we show a comparison of a model SED with the observation. Although the model is not fine-tuned in abundances and does not include all elements from H to Ni, the reproduction of the observed spectrum is already very good. Obviously, lines of different ionization stages, e.g. N vi and N vii are formed in different radial velocity regimes but their theoretical strengths match the observation.
3.2.3 Neutron stars:
At a typical (neutron star with and ), an extended Fig. 2 would show that TMAP models are still valid up to . At higher , comptonization has a significant impact on the X-ray spectrum (Rauch et al. 2008).
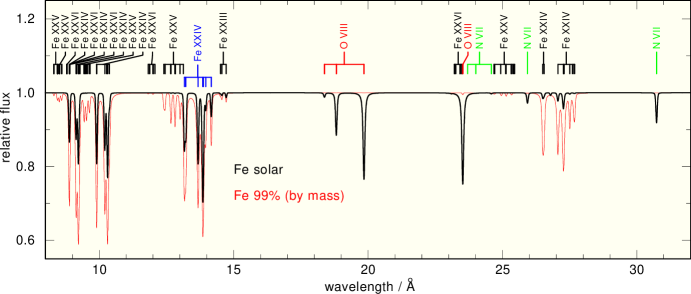
In the case of EXO 0748676, an X-ray bursting neutron star, Rauch et al. (2008) could easily show that the identification of gravitationally red-shifted absorption lines of Fe xxv and xxvi by Cottam et al. (2002) is wrong because at the relevant temperatures, Fe xxiv lines should be much stronger but these were not observed (Fig. 9).
4 G 191B2B - too many metal lines?
G 191B2B is the visually brightest of the HST standard stars (Table 2) and thus it may be the most observed and best studied hot DA WD in all wavelength ranges. Hence, it should be the prime standard star for the UV wavelengths as well. However, it shows many weak metal lines (e.g. Barstow et al. 2003) in its observed UV spectrum. Therefore its was not used for the FUSE calibration (G. Sonneborn, this conference). Detailed modeling with TMAP shows that these lines can be well reproduced and, thus, a reliable synthetic spectrum from the H i Lyman threshold to the far IR can be calculated that allows a flux calibration over a wide energy interval. Fig. 1 shows a comparison of HST observations of G 191B2B141414http://www.stsci.edu/hst/observatory/cdbs/calspec.html within with our preliminary TMAP model that agree almost perfectly in the continuum-flux level. A detailed fine-tuning of the metal abundances is still ongoing that will improve the agreement in the FUV and EUV range.
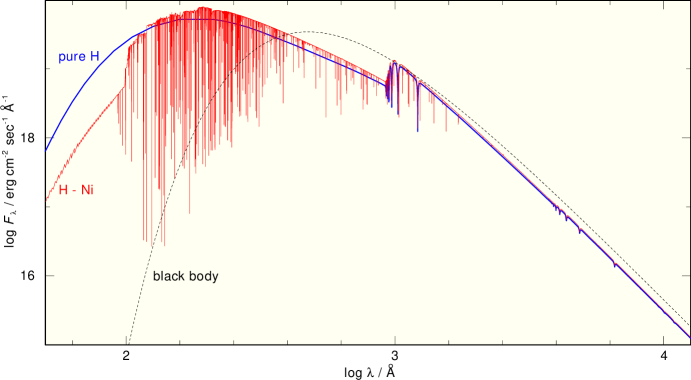
Figure 10 shows a comparison of the flux of a pure hydrogen model to a metal-blanketed model and a black-body flux. Strong metal-line blanketing is visible around the flux maximum in the H-Ni model. This results in significant deviations from the pure H model flux even in the IR. Compared to the model-atmosphere fluxes, the black body has its flux maximum at a 2.7 times higher wavelength and the peak maximum is about 40% lower.
5 Cross-correlation between various instruments
Beuermann et al. (2006) established two DA WDs, namely HZ43 A and Sirius B, and the neutron star RX J1856353754 as soft X-ray standards. This enabled a cross-calibration between the Chandra LETG+HRC-S (Low Energy Transmission Grating, High Resolution Camera Spectroscopic array), the EUVE (Extreme Ultraviolet Explorer) spectrometer, and the ROSAT PSPC (Röntgensatellit, Position Sensitive Proportional Counter). With their attempt, the effective area of ROSAT could be corrected, yielding consistent fluxes from about 20 to 160 Å. It is worthwhile to note that during the work for this cross-correlation, Jelle Kaastra discovered discrepancies between TMAP and TLUSTY (Hubeny & Lanz 1995) models in the case of HZ43 A, that were then intensively investigated and understood (e.g. Rauch 2008).
Drake (2012) and the Chandra LETG team relied on the growing confidence in the photospheric parameters for HZ43 A (Beuermann et al. 2006) and that its spectrum was well-represented by pure hydrogen atmospheric models. They used HZ43 A spectra obtained over ten years and TMAP atmospheres in order to improve the in-flight calibration. The corrected effective area curve allowed then to incorporate a secular decline in quantum efficiency for a better (re-)calibration of LETG spectra. It is worthwhile to note that GD 153 was newly introduced by Menz (2011) for the calibration of LETG spectra in order to bridge the gap between Sirius B and HZ43 A (Table 3).
6 Virtual Observatory Services and Tools for Synthetic Spectra
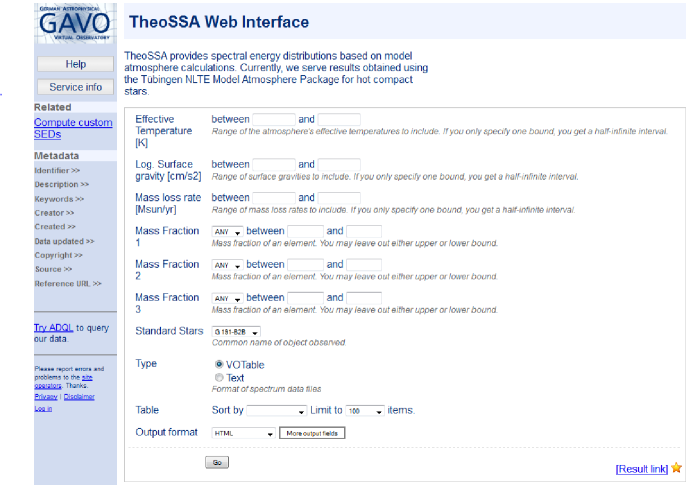
In the framework of the Virtual Observatory151515http://www.ivoa.net/ (VO), the German Astrophysical Virtual Observatory161616http://www.g-vo.org/ (GAVO) provides the registered VO service TheoSSA (Theoretical Spectra Simple Access, Fig. 11). It was created to provide access to synthetic stellar SEDs at three levels. 1) Fast and easy download of precalculated SEDs by an unexperienced VO user (no detailed knowledge of the model-atmosphere code necessary). 2) Calculation of SEDs (elements H, He, C, N, and O) with standard TMAD model atoms for a preliminary analysis of individual objects via the TMAP web interface TMAW171717http://astro.uni-tuebingen.de/~TMAW. 3) Advanced calculation of SEDs with especially tailored model atoms, e.g. for a comparison with other stellar model-atmosphere codes.
TheoSSA is related to the GAVO database that includes already thousands of SEDs. Newly calculated SEDs are automatically ingested and, thus, this database is growing in time. If a requested SED is not available, the VO user will be redirected to the TMAW interface, where individual models can be calculated. Figure 12 illustrates the dataflow between the TheoSSA and TMAW WWW interfaces and the GAVO database. For a pure H model, the calculation takes some hours, for H+He+C+N+O composed models, one or two days are necessary. The wall-clock time, however, is depending on the number of queued SED requests. The calculation of extended model grids ( models) makes use of compute resources of AstroGrid-D181818http://www.gac-grid.de/.
Presently, TheoSSA provides a preliminary sample of pre-calculated DA WD spectra (Table 3) from the optical to infrared wavelength range. These will be expanded to include the X-ray and UV ranges in the near future.
| name | comments | ||
|---|---|---|---|
| [K] | [] | ||
| EG 274 | 24 276 | 8.01 | |
| Feige 67 | 75 000 | 5.20 | |
| Feige 110 | 40 000 | 5.00 | He mass fraction 0.107 |
| GD 108 | 22 908 | 5.30 | |
| GD 153 | 38 205 | 7.89 | |
| GD 50 | 40 550 | 9.22 | |
| GD 71 | 32 780 | 7.83 | |
| G 191-B2B | 60 920 | 7.55 | metal-line blanketed model in preparation |
| G 93-48 | 18 100 | 7.85 | |
| HZ 2 | 20 600 | 7.90 | |
| HZ 43 | 51 116 | 7.90 | |
| Sirius B | 24 826 | 8.60 |
7 Conclusions
DA-type WDs are stable sources of radiation on a wide energy range from the X-ray to the IR. This allows a cross-correlation between ground- and space-based observations.
WD modeling arrived at a high level of sophistication and thus, they are well suited to provide model SEDs within 1 % flux-level accuracy. It is, however, difficult to quantify the absolute accuracy of model atmospheres, at least if we aim at the ambitious 1 %. About 200 000 000 variables are calculated iteratively to achieve convergence of a NLTE stellar-atmosphere model. Besides the mentioned uncertainties in atomic data and line-broadening theory, systematic deviations may exist between different codes due to programming language, coding, compiling, properties of the compute nodes, etc. Future close collaboration of all groups working in stellar-atmosphere modeling is required (in the legacy of past workshops, Crivellari et al. 1991; Hubeny et al. 2003) in order to identify and minimize existing uncertainties and to further improve the flux calibration which is a continuous process. The VO provides an ideal platform to publish observations as well as models. The quality of spectral analysis and, hence, stellar-atmosphere models benefits from the observational data that it is based on.
Further improvement of flux calibration will be possible with GAIA. Precise distances of almost all known WDs will be available in the post-GAIA era.
For ground-based telescopes, it is a major challenge to model and to correct for Earth’s atmosphere contributions (cf. a variety of papers in these proceedings) and to establish an extended database of secondary standard stars, that should be observable in the vicinity of science targets.
Acknowledgments
This work was supported by the German Aerospace Center (DLR, grant 05 OR 0806). I thank Klaus Werner for comments and reading the manuscript. This research has made use of the SIMBAD database, operated at CDS, Strasbourg, France. Some of the data presented in this paper were obtained from the Mikulski Archive for Space Telescopes (MAST). STScI is operated by the Association of Universities for Research in Astronomy, Inc., under NASA contract NAS5-26555. Support for MAST for non-HST data is provided by the NASA Office of Space Science via grant NNX09AF08G and by other grants and contracts.
References
- Auer & Mihalas (1969) Auer, L. H., & Mihalas, D. 1969, ApJ, 158, 641
- Auer & Mihalas (1970) — 1970, MNRAS, 149, 65
- Auer & Mihalas (1972) — 1972, ApJS, 24, 193
- Barstow et al. (2003) Barstow, M. A., Good, S. A., Holberg, J. B., Hubeny, I., Bannister, N. P., Bruhweiler, F. C., Burleigh, M. R., & Napiwotzki, R. 2003, MNRAS, 341, 870
- Barstow et al. (2001) Barstow, M. A., Holberg, J. B., Hubeny, I., Good, S. A., Levan, A. J., & Meru, F. 2001, MNRAS, 328, 211
- Beuermann et al. (2006) Beuermann, K., Burwitz, V., & Rauch, T. 2006, A&A, 458, 541
- Bohlin et al. (1995) Bohlin, R. C., Colina, L., & Finley, D. S. 1995, AJ, 110, 1316
- Bohlin et al. (2011) Bohlin, R. C., Gordon, K. D., Rieke, G. H., Ardila, D., Carey, S., Deustua, S., Engelbracht, C., Ferguson, H. C., Flanagan, K., Kalirai, J., Meixner, M., Noriega-Crespo, A., Su, K. Y. L., & Tremblay, P.-E. 2011, AJ, 141, 173
- Cottam et al. (2002) Cottam, J., Paerels, F., & Mendez, M. 2002, Nat, 420, 51
- Crivellari et al. (1991) Crivellari, L., Hubeny, I., & Hummer, D. G. (eds.) 1991, Stellar Atmospheres - Beyond Classical Models, NATO ASI Series, Series C: Mathematical and Physical Sciences - Vol. 314, ISBN 0-7923-1343-7, vol. 341 (Kluwer Academic Publishers (Dordrecht/Boston/London))
- Drake (2012) Drake, J. J. 2012, Chandra News, 19, 13
- Fitzpatrick (1999) Fitzpatrick, E. L. 1999, PASP, 111, 63
- Gianninas et al. (2011) Gianninas, A., Bergeron, P., & Ruiz, M. T. 2011, ApJ, 743, 138
- Holberg & Bergeron (2006) Holberg, J. B., & Bergeron, P. 2006, AJ, 132, 1221
- Hubeny & Lanz (1995) Hubeny, I., & Lanz, T. 1995, ApJ, 439, 875
- Hubeny et al. (2003) Hubeny, I., Mihalas, D., & Werner, L. (eds.) 2003, Stellar Atmosphere Modeling, A. S. P. Conf. Ser. Vol. 288, ISBN 1-58381-131-1, vol. 288 (Kluwer Academic Publishers (Dordrecht/Boston/London))
- Hummer et al. (1993) Hummer, D. G., Berrington, K. A., Eissner, W., Pradhan, A. K., Saraph, H. E., & Tully, J. A. 1993, A&A, 279, 298
- Kramida & Buchet-Poulizac (2006) Kramida, A. E., & Buchet-Poulizac, M.-C. 2006, European Physical Journal D, 39, 173
- Kudritzki (1976) Kudritzki, R. P. 1976, A&A, 52, 11
- Kurucz (1991) Kurucz, R. L. 1991, in NATO ASIC Proc. 341: Stellar Atmospheres - Beyond Classical Models, edited by L. Crivellari, I. Hubeny, & D. G. Hummer, 441
- Kurucz (2009) — 2009, in American Institute of Physics Conference Series, edited by I. Hubeny, J. M. Stone, K. MacGregor, & K. Werner, vol. 1171 of American Institute of Physics Conference Series, 43
- Lajoie & Bergeron (2007) Lajoie, C.-P., & Bergeron, P. 2007, ApJ, 667, 1126
- Lemke (1997) Lemke, M. 1997, A&AS, 122, 285
- McCook & Sion (1999) McCook, G. P., & Sion, E. M. 1999, ApJS, 121, 1
- Menz (2011) Menz, B. 2011, Ph.D. thesis, Technische Universität München
- Mihalas & Auer (1970) Mihalas, D., & Auer, L. H. 1970, ApJ, 160, 1161
- Ness et al. (2003) Ness, J.-U., Starrfield, S., Burwitz, V., Wichmann, R., Hauschildt, P., Drake, J. J., Wagner, R. M., Bond, H. E., Krautter, J., Orio, M., Hernanz, M., Gehrz, R. D., Woodward, C. E., Butt, Y., Mukai, K., Balman, S., & Truran, J. W. 2003, ApJ, 594, L127
- Oke (1974) Oke, J. B. 1974, ApJS, 27, 21
- Rauch (1997) Rauch, T. 1997, A&A, 320, 237
- Rauch (2003) — 2003, A&A, 403, 709
- Rauch (2008) — 2008, A&A, 481, 807
- Rauch & Deetjen (2003) Rauch, T., & Deetjen, J. L. 2003, in Stellar Atmosphere Modeling, edited by I. Hubeny, D. Mihalas, & K. Werner, vol. 288 of Astronomical Society of the Pacific Conference Series, 103
- Rauch et al. (2010) Rauch, T., Orio, M., Gonzales-Riestra, R., Nelson, T., Still, M., Werner, K., & Wilms, J. 2010, ApJ, 717, 363
- Rauch et al. (2008) Rauch, T., Suleimanov, V., & Werner, K. 2008, A&A, 490, 1127
- Rauch et al. (2012) Rauch, T., Werner, K., Biémont, E., Quinet, P., & Kruk, J. W. 2012, A&A. Submitted to A&A.
- Rauch et al. (2007) Rauch, T., Ziegler, M., Werner, K., Kruk, J. W., Oliveira, C. M., Vande Putte, D., Mignani, R. P., & Kerber, F. 2007, A&A, 470, 317
- Seaton et al. (1994) Seaton, M. J., Yan, Y., Mihalas, D., & Pradhan, A. K. 1994, MNRAS, 266, 805
- Tremblay & Bergeron (2009) Tremblay, P.-E., & Bergeron, P. 2009, ApJ, 696, 1755
- Vernet et al. (2008a) Vernet, J., Kerber, F., D’Odorico, S., Bohlin, R., Ivanov, V., Lidman, C., Mason, E., Rauch, T., Saitta, F., Smette, A., Walsh, J., Fosbury, R., Goldoni, P., Groot, P., Hammer, F., Horrobin, M., Kaper, L., Kjaergaard-Rasmussen, P., Pallavicini, R., & Royer, F. 2008a, in 2007 ESO Instrument Calibration Workshop, edited by A. Kaufer, & F. Kerber, 153
- Vernet et al. (2008b) Vernet, J., Kerber, F., Saitta, F., Mainieri, V., D’Odorico, S., Lidman, C., Mason, E., Bohlin, R. C., Rauch, T., Ivanov, V. D., Smette, A., Walsh, J. R., Fosbury, R. A. E., Goldoni, P., Groot, P., Hammer, F., Horrobin, M., Kaper, L., Kjaergaard-Rasmussen, P., Pallavicini, R., & Royer, F. 2008b, in Society of Photo-Optical Instrumentation Engineers (SPIE) Conference Series, vol. 7016 of Society of Photo-Optical Instrumentation Engineers (SPIE) Conference Series
- Wassermann et al. (2010) Wassermann, D., Werner, K., Rauch, T., & Kruk, J. W. 2010, A&A, 524, A9
- Werner (1986) Werner, K. 1986, A&A, 161, 177
- Werner (1989) — 1989, A&A, 226, 265
- Werner et al. (2003) Werner, K., Deetjen, J. L., Dreizler, S., Nagel, T., Rauch, T., & Schuh, S. L. 2003, in Stellar Atmosphere Modeling, edited by I. Hubeny, D. Mihalas, & K. Werner, vol. 288 of Astronomical Society of the Pacific Conference Series, 31
- Werner & Dreizler (1999) Werner, K., & Dreizler, S. 1999, Journal of Computational and Applied Mathematics, 109, 65
- Werner & Herwig (2006) Werner, K., & Herwig, F. 2006, PASP, 118, 183
- Werner & Husfeld (1985) Werner, K., & Husfeld, D. 1985, A&A, 148, 417
- Werner et al. (2005) Werner, K., Rauch, T., & Kruk, J. W. 2005, A&A, 433, 641
- Werner et al. (2007a) — 2007a, A&A, 466, 317
- Werner et al. (2007b) — 2007b, A&A, 474, 591
- Werner et al. (2008) — 2008, A&A, 492, L43
- Werner et al. (2010) — 2010, ApJ, 719, L32
- Werner et al. (2004) Werner, K., Rauch, T., Reiff, E., Kruk, J. W., & Napiwotzki, R. 2004, A&A, 427, 685
- Werner et al. (2012) Werner, K., Rauch, T., Ringat, E., & Kruk, J. W. 2012, ApJ, 753, L7