X. L. Wang
Institute of High Energy Physics, Chinese Academy of Sciences, Beijing
CNP, Virginia Polytechnic Institute and State University, Blacksburg, Virginia 24061
Y. L. Han
Institute of High Energy Physics, Chinese Academy of Sciences, Beijing
C. Z. Yuan
Institute of High Energy Physics, Chinese Academy of Sciences, Beijing
C. P. Shen
Graduate School of Science, Nagoya University, Nagoya
P. Wang
Institute of High Energy Physics, Chinese Academy of Sciences, Beijing
I. Adachi
High Energy Accelerator Research Organization (KEK), Tsukuba
H. Aihara
Department of Physics, University of Tokyo, Tokyo
D. M. Asner
Pacific Northwest National Laboratory, Richland, Washington 99352
V. Aulchenko
Budker Institute of Nuclear Physics SB RAS and Novosibirsk State University, Novosibirsk 630090
T. Aushev
Institute for Theoretical and Experimental Physics, Moscow
T. Aziz
Tata Institute of Fundamental Research, Mumbai
A. M. Bakich
School of Physics, University of Sydney, NSW 2006
Y. Ban
Peking University, Beijing
B. Bhuyan
Indian Institute of Technology Guwahati, Guwahati
G. Bonvicini
Wayne State University, Detroit, Michigan 48202
A. Bozek
H. Niewodniczanski Institute of Nuclear Physics, Krakow
M. Bračko
University of Maribor, Maribor
J. Stefan Institute, Ljubljana
J. Brodzicka
H. Niewodniczanski Institute of Nuclear Physics, Krakow
O. Brovchenko
Institut für Experimentelle Kernphysik, Karlsruher Institut für Technologie, Karlsruhe
T. E. Browder
University of Hawaii, Honolulu, Hawaii 96822
P. Chen
Department of Physics, National Taiwan University, Taipei
B. G. Cheon
Hanyang University, Seoul
K. Cho
Korea Institute of Science and Technology Information, Daejeon
S.-K. Choi
Gyeongsang National University, Chinju
Y. Choi
Sungkyunkwan University, Suwon
J. Dalseno
Max-Planck-Institut für Physik, München
Excellence Cluster Universe, Technische Universität München, Garching
Z. Doležal
Faculty of Mathematics and Physics, Charles University, Prague
Z. Drásal
Faculty of Mathematics and Physics, Charles University, Prague
S. Eidelman
Budker Institute of Nuclear Physics SB RAS and Novosibirsk State University, Novosibirsk 630090
S. Esen
University of Cincinnati, Cincinnati, Ohio 45221
H. Farhat
Wayne State University, Detroit, Michigan 48202
J. E. Fast
Pacific Northwest National Laboratory, Richland, Washington 99352
V. Gaur
Tata Institute of Fundamental Research, Mumbai
R. Gillard
Wayne State University, Detroit, Michigan 48202
Y. M. Goh
Hanyang University, Seoul
B. Golob
Faculty of Mathematics and Physics, University of Ljubljana, Ljubljana
J. Stefan Institute, Ljubljana
H. Hayashii
Nara Women’s University, Nara
Y. Hoshi
Tohoku Gakuin University, Tagajo
W.-S. Hou
Department of Physics, National Taiwan University, Taipei
H. J. Hyun
Kyungpook National University, Taegu
K. Inami
Graduate School of Science, Nagoya University, Nagoya
A. Ishikawa
Tohoku University, Sendai
M. Iwabuchi
Yonsei University, Seoul
J. H. Kang
Yonsei University, Seoul
P. Kapusta
H. Niewodniczanski Institute of Nuclear Physics, Krakow
H. J. Kim
Kyungpook National University, Taegu
H. O. Kim
Kyungpook National University, Taegu
J. B. Kim
Korea University, Seoul
J. H. Kim
Korea Institute of Science and Technology Information, Daejeon
M. J. Kim
Kyungpook National University, Taegu
Y. J. Kim
Korea Institute of Science and Technology Information, Daejeon
K. Kinoshita
University of Cincinnati, Cincinnati, Ohio 45221
J. Klucar
J. Stefan Institute, Ljubljana
B. R. Ko
Korea University, Seoul
P. Kodyš
Faculty of Mathematics and Physics, Charles University, Prague
R. T. Kouzes
Pacific Northwest National Laboratory, Richland, Washington 99352
P. Križan
Faculty of Mathematics and Physics, University of Ljubljana, Ljubljana
J. Stefan Institute, Ljubljana
P. Krokovny
Budker Institute of Nuclear Physics SB RAS and Novosibirsk State University, Novosibirsk 630090
T. Kumita
Tokyo Metropolitan University, Tokyo
J. S. Lange
Justus-Liebig-Universität Gießen, Gießen
S.-H. Lee
Korea University, Seoul
J. Li
Seoul National University, Seoul
J. Libby
Indian Institute of Technology Madras, Madras
C. Liu
University of Science and Technology of China, Hefei
Z. Q. Liu
Institute of High Energy Physics, Chinese Academy of Sciences, Beijing
P. Lukin
Budker Institute of Nuclear Physics SB RAS and Novosibirsk State University, Novosibirsk 630090
S. McOnie
School of Physics, University of Sydney, NSW 2006
H. Miyata
Niigata University, Niigata
R. Mizuk
Institute for Theoretical and Experimental Physics, Moscow
G. B. Mohanty
Tata Institute of Fundamental Research, Mumbai
A. Moll
Max-Planck-Institut für Physik, München
Excellence Cluster Universe, Technische Universität München, Garching
N. Muramatsu
Research Center for Electron Photon Science, Tohoku University, Sendai
R. Mussa
INFN - Sezione di Torino, Torino
M. Nakao
High Energy Accelerator Research Organization (KEK), Tsukuba
S. Nishida
High Energy Accelerator Research Organization (KEK), Tsukuba
O. Nitoh
Tokyo University of Agriculture and Technology, Tokyo
S. Ogawa
Toho University, Funabashi
T. Ohshima
Graduate School of Science, Nagoya University, Nagoya
S. Okuno
Kanagawa University, Yokohama
S. L. Olsen
Seoul National University, Seoul
G. Pakhlova
Institute for Theoretical and Experimental Physics, Moscow
H. Park
Kyungpook National University, Taegu
T. K. Pedlar
Luther College, Decorah, Iowa 52101
R. Pestotnik
J. Stefan Institute, Ljubljana
M. Petrič
J. Stefan Institute, Ljubljana
L. E. Piilonen
CNP, Virginia Polytechnic Institute and State University, Blacksburg, Virginia 24061
K. Prothmann
Max-Planck-Institut für Physik, München
Excellence Cluster Universe, Technische Universität München, Garching
H. Sahoo
University of Hawaii, Honolulu, Hawaii 96822
Y. Sakai
High Energy Accelerator Research Organization (KEK), Tsukuba
S. Sandilya
Tata Institute of Fundamental Research, Mumbai
D. Santel
University of Cincinnati, Cincinnati, Ohio 45221
T. Sanuki
Tohoku University, Sendai
O. Schneider
École Polytechnique Fédérale de Lausanne (EPFL), Lausanne
C. Schwanda
Institute of High Energy Physics, Vienna
K. Senyo
Yamagata University, Yamagata
M. E. Sevior
University of Melbourne, School of Physics, Victoria 3010
M. Shapkin
Institute of High Energy Physics, Protvino
T.-A. Shibata
Tokyo Institute of Technology, Tokyo
J.-G. Shiu
Department of Physics, National Taiwan University, Taipei
A. Sibidanov
School of Physics, University of Sydney, NSW 2006
F. Simon
Max-Planck-Institut für Physik, München
Excellence Cluster Universe, Technische Universität München, Garching
P. Smerkol
J. Stefan Institute, Ljubljana
Y.-S. Sohn
Yonsei University, Seoul
E. Solovieva
Institute for Theoretical and Experimental Physics, Moscow
S. Stanič
University of Nova Gorica, Nova Gorica
M. Starič
J. Stefan Institute, Ljubljana
T. Sumiyoshi
Tokyo Metropolitan University, Tokyo
K. Tanida
Seoul National University, Seoul
G. Tatishvili
Pacific Northwest National Laboratory, Richland, Washington 99352
Y. Teramoto
Osaka City University, Osaka
K. Trabelsi
High Energy Accelerator Research Organization (KEK), Tsukuba
M. Uchida
Tokyo Institute of Technology, Tokyo
S. Uehara
High Energy Accelerator Research Organization (KEK), Tsukuba
Y. Unno
Hanyang University, Seoul
S. Uno
High Energy Accelerator Research Organization (KEK), Tsukuba
Y. Usov
Budker Institute of Nuclear Physics SB RAS and Novosibirsk State University, Novosibirsk 630090
P. Vanhoefer
Max-Planck-Institut für Physik, München
G. Varner
University of Hawaii, Honolulu, Hawaii 96822
C. H. Wang
National United University, Miao Li
J. Wang
Peking University, Beijing
M.-Z. Wang
Department of Physics, National Taiwan University, Taipei
K. M. Williams
CNP, Virginia Polytechnic Institute and State University, Blacksburg, Virginia 24061
E. Won
Korea University, Seoul
Y. Yamashita
Nippon Dental University, Niigata
C. C. Zhang
Institute of High Energy Physics, Chinese Academy of Sciences, Beijing
Z. P. Zhang
University of Science and Technology of China, Hefei
V. Zhilich
Budker Institute of Nuclear Physics SB RAS and Novosibirsk State University, Novosibirsk 630090
A. Zupanc
Institut für Experimentelle Kernphysik, Karlsruher Institut für Technologie, Karlsruhe
Abstract
The cross section for between
and is measured via initial state
radiation using 980 fb-1 of data on and around the
resonances collected with the Belle
detector at KEKB. Two resonant structures at the and
are observed in the invariant mass
distribution. Fitting the mass spectrum with the coherent sum of
two Breit-Wigner functions, one obtains
and
for one solution and
and
for the other solution, where the first
errors are statistical and the second are systematic. This is the
first measurement of this hadronic transition mode of these two
states, and the partial widths to are found to be
about . There is no evidence for the , ,
, or in the final state, and
upper limits of their production rates in annihilation are
determined.
pacs:
14.40.Pq, 13.25.Gv, 13.66.Bc
††preprint: ††preprint: Intended for Phys. Rev. Lett.Authors: X. L. Wang, Y. L. Han, C. Z. Yuan, C. P. Shen, P. WangCommittee: P. Pakhlov (chair), S. Uehara, P. Lukin
Many charmonium and charmoniumlike states have been discovered at
-factories in the past decade. Some of these states are good
candidates for conventional charmonium states, while others
exhibit unusual properties consistent with expectations for exotic
states such as a multi-quark state, molecule, hybrid, or the
glueball review . In the vector sector, four exotic
charmoniumlike structures, and in belley ; babay4260 and and in
pppsp ; babay4324 , have been reported via
initial state radiation (ISR), in addition to the three known
excited states above : , ,
and . It is unlikely that all seven of these states are
charmonia, as the potential models predict only five vector states
in this mass region barnes . The current understanding of
these states is based on limited statistics, and the fact that
some may be produced via mechanisms that are difficult to estimate
theoretically, such as final state rescattering review ,
makes the determination of which might be exotic even more
challenging. In order to further the understanding of the nature
of these states, it is important to investigate them using much
larger data samples.
An important study is the investigation of hadronic transitions
(either by an or a pion pair) between these states and a
lower charmonium state like the . The CLEO collaboration
measured pb at
cleo , and the BESIII
collaboration reported pb
at besiii , which is in agreement with
the theoretical calculation including contributions from the known
states and the virtual charmed meson loops zhaoq .
However, the limited statistics of the CLEO analysis prevented the
measurement of the line shape of . Thus, it is
worthwhile to study the process via ISR with
the full Belle data sample to search for transitions from
these seven states to . It is worth noting that the
states are identified in decays to charmed meson pairs but not in
dipion transitions to lower states, while the opposite is
true of the states. There may also be surprises from
transitions of unexpected states.
In this Letter, we report an investigation of the process using ISR events observed with the Belle
detector Belle at the KEKB asymmetric-energy
collider KEKB . Here, is reconstructed in the
final state and in the and
final states. Due to the high background level from Bhabha
scattering, the mode is not used in conjunction
with the decay mode . The integrated luminosity used
in this analysis is 980 fb-1. About 70% of the data were
collected at the resonance, and the rest were taken
at other (, 2, 3, or 5) states or
center-of-mass (CM) energies a few tens of lower than the
or the peaks.
We use the phokhara event generator phokhara to
simulate the process . In the
generator, one or two ISR photons may be emitted before forming
the resonance , which then decays to , with or and or .
For a candidate event, we require two (four) good charged tracks
with zero net charge for (). A good
charged track has impact parameters with respect to the
interaction point of cm in the - plane and
cm in the - plane. The transverse momentum of the
leptons is required to be greater than . For each
charged track, information from different detector subsystems is
combined to form a likelihood for each particle species (),
pid . Tracks with are
identified as pions with an efficiency of about 95%, while 6% of
kaons are misidentified as pions. Similar likelihood ratios are
formed for electron and muon identification EID ; MUID . For
electrons from , both tracks are required to have
. The bremsstrahlung photons detected in the
electromagnetic calorimeter (ECL) within 0.05 radians of the
original or direction are included in the calculation
of the invariant mass. For muons from , one of the tracks is required to have and the other track should have associated hits in the
-and-muon detector (KLM) that agree with the extrapolated
trajectory of a charged track provided by the drift chamber. The
lepton ID efficiency is about 90% for and 87% for
.
The is reconstructed from and final states. To
reconstruct , the is reconstructed from two
photons. A photon candidate is an ECL cluster with energy
that does not match any charged tracks. The
mass resolution of is about from MC
simulation. Considering the low-mass tail, the invariant mass of
the photon pair is required to be between and
for a candidate. combinations are
formed and are subject to a mass-constrained kinematic fit. When
there is more than one candidate, the combination with the
smallest from the mass-constrained fit is selected as the
candidate. Events with -conversions are removed by
requiring for the tracks from
decays. In the reconstruction of candidates,
two photon candidates are required with energies in the laboratory
frame satisfying and , where the subscript () signifies the lower
(higher) energy photon.
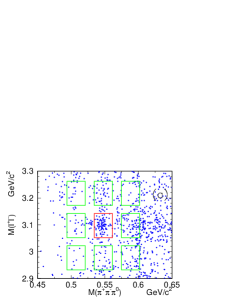
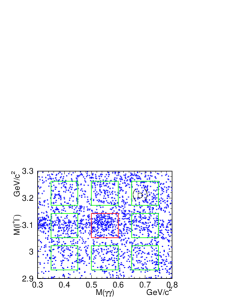
The scatter plots of dilepton invariant mass versus
-candidate invariant mass or
invariant mass are shown in Fig. 1 for
events that survive these selection criteria. Here the invariant
masses are calculated with the momenta before the mass
constraints. A dilepton pair is considered as a candidate
if is within (the mass resolution being
) of the nominal mass. The mass
sidebands are defined as or
. A fit of the or
distribution with a Gaussian plus a second-order
polynomial yields a mass resolution of for the
mode and for the mode.
We define the signal region as and and the
mass sideband regions as or
, and or . The
central (surrounding) rectangles of Fig. 1 show the
signal (sideband) regions. With ()
representing the sum of the events in the four sideband boxes
nearest (diagonal) to the signal box, the normalization of the
sidebands is .
Figure 1: Invariant mass distributions of (a) vs. and
(b) vs. for selected or candidates
with invariant mass between and . The box
in the center of each plot shows the signal region
while the surrounding boxes show the sideband regions.
The detection of the ISR photon is not required; instead, we
require , where is
the square of the mass recoiling against the system.
In calculating , the momenta of the and after
the kinematic fit are used to improve the resolution of .
The fit constrains signal candidates to the and
masses, while events having or candidate masses
lying in sideband regions are fitted with masses constrained to
the center of the sideband region.
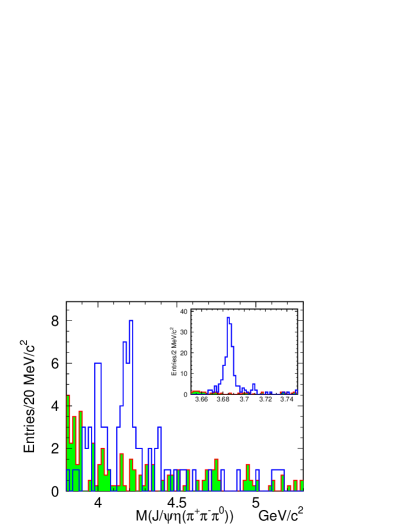
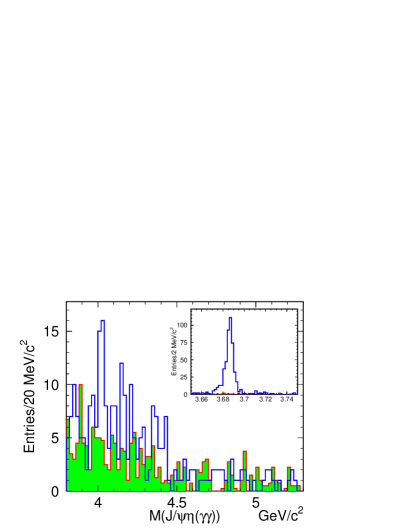
Figure 2 shows the invariant mass
( metajpsi ) for selected candidate events,
together with background estimated from the scaled or
mass sidebands. Two distinct peaks are evident in
Fig. 2, one at and the other at
, in addition to the dominant signal.
The cross section of in the full
Belle data sample is measured to be pb
using the events and pb using the events, in good
agreement with the production cross section of 14.7 pb calculated
by using the world average values of the mass, width, and partial
width to of PDG , and the CM energies
correspond to the Belle data samples. Agreement between the
and modes is also observed.
The visible energy () and polar angle distributions
of the system in the CM frame for the events with
agree well with the MC
simulation, confirming that the signal events are produced via
ISR.
Here, is the total energy of all final state photons
and charged particles. Charged particle energies are calculated
from track momenta assuming the tracks to be pions.
Figure 2: The invariant mass distribution of the
candidates. The top row shows the mode and the
bottom row shows the mode. The open histograms are
from the and signal region, while the shaded ones
are from their sideband regions after the proper normalization.
The insets show the distributions around the mass region.
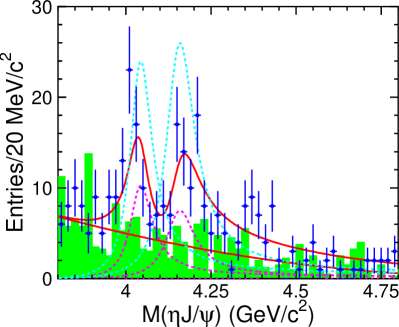
An unbinned maximum likelihood fit is performed to the mass
spectra from the signal
candidate events and and sideband events
simultaneously, as shown in Fig. 3. The fit to the signal
events includes two coherent -wave Breit-Wigner functions,
for and for , assuming that only
two resonances contribute to the final states, and an
incoherent second-order polynomial background; the fit to the
sideband events includes the same background function only. The
width of each resonance is assumed to be constant, and an overall
two-body phase-space factor is applied in the partial width to
. The signal amplitude is , where is the the relative phase between the two
resonances. In the fit, the BW functions are convolved with the
effective luminosity kuraev and -dependent
efficiency, which increases from 4% at to 7% at . The effect of
mass resolution, which is determined from MC simulation to be
over the resonant mass region, is small compared
with the widths of the observed structures, and therefore is
neglected. A fit performed with floating masses and widths for the
two structures yields a mass of and width of
for the first, and a mass of and width of for the second.
Their masses and widths are in agreement with those of the
and , and thus they are referred to hereafter as
the and . In the fit below, the masses and
widths of these two resonances are fixed to their world average
values PDG as the statistics are low here.
Figure 3 and Table 1beebf show the fit
results. There are two solutions with equally good fit quality. To
determine the goodness of the fit, we bin the data (events in both
signal and sideband regions) so that the expected number of events
in a bin is at least seven and then calculate a of
71.4/46, corresponding to a confidence level (C.L.) of 0.9%,
where is the number of degrees of freedom. The significance
of each resonance is estimated by comparing the likelihood of fits
with and without that resonance included. We obtain a statistical
significance of for and for
. Varying the masses and widths of resonances by
, the fit range by , and the order of the
background polynomial by one, we obtain a minimum statistical
significance of for and for
.
Taking from
PDG PDG , one obtains or ; while using the PDG average value
PDG , one
gets or
. In each case, the first error is
statistical and the second is systematic. These indicate the
transition rates of these states to are large, being of
order .
Possible contributions from other excited charmonium(like) states
are examined. There is a cluster of events near the . Assuming it is the , the significance is
in a fit with the masses and widths of the
and fixed to their world average values PDG , or
if the masses and widths of and
are free. Besides the , the ,
and are in mass region.
Fits that include each one of them and the masses and widths of
and fixed to their world average
values PDG are performed to determine the upper limits of
. The systematic errors that will be
described later in the text together with those from the
uncertainties of the and resonant
parameters are considered in the upper limit determination. In
order to be conservative, the efficiencies have been lowered by a
factor of in the calculation. We obtain the upper
limits on for , , and are ,
, and at 90% C.L., respectively.
Figure 3: The invariant mass distribution and the fit
results. The points with error bars show the data while the shaded
histogram is the normalized and background from the
sidebands. The curves show the best fit on signal candidate events
and sideband events simultaneously and the contribution from each
Breit-Wigner component. The interference between the two
resonances is not shown. The dashed curves at each peak show the
two solutions (see text).
Table 1: Results of the fits to the invariant mass
spectrum. The first errors are statistical and the second are
systematic. , , and are
the mass (in ), total width (in ), product of the
branching fraction of and the
partial width (in ), respectively. is the relative
phase between the two resonances (in degrees).
Parameters
Solution I
Solution II
4039 (fixed)
80 (fixed)
4153 (fixed)
103 (fixed)
To estimate the errors in , the
uncertainties from the choice of parametrization of the resonances
(especially introducing the mass dependence for the widths), the
masses and widths of resonances PDG , the fit range, the
background shape and the possible contributions from or
are considered. The total errors are 35.0% and
14.8% for solutions I and II, respectively. The particle ID
uncertainty is 5.5%; the uncertainty in the tracking efficiency
is 0.35% per track and is additive; the uncertainty in the photon
reconstruction is 2% per photon. The uncertainties in the
mass, mass, and requirements are measured with the
control sample . The efficiencies of the
requirements on the data are obtained from the fits of the
corresponding distributions. The MC efficiency is found to be
higher than in data by for the mode and
for the mode. A correction factor 1.023 is
applied to the final state, and 2.6% is conservatively
taken as the associated systematic error of the sum for and
modes.
Belle measures luminosity with 1.4% precision while the
uncertainty of the generator phokhara is less than
1% phokhara . The trigger efficiency for the events
surviving the selection criteria is around 91% with an
uncertainty smaller than 2%.
The uncertainties in the intermediate decay branching fractions
taken from Ref. PDG contribute a systematic error of less
than 1.6%. The statistical error in the MC determination of the
efficiency is 0.2%.
Assuming all the sources are independent and adding them in
quadrature, we obtain total systematic errors in of 36% for Solution I and 17% for Solution II for
both and .
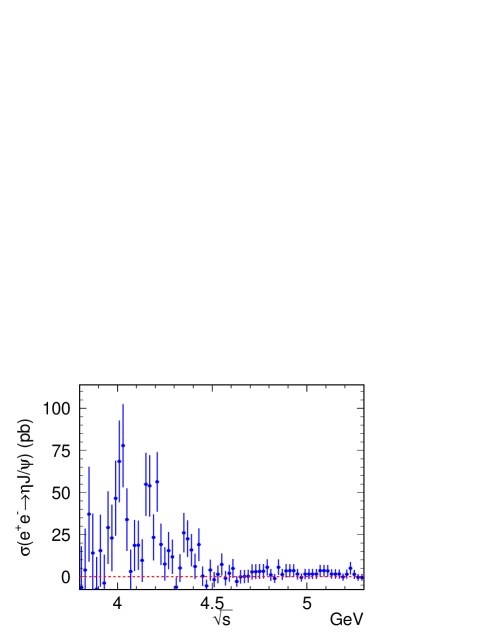
The cross section for for each mass
bin is calculated according to
where is the -th mode of decays (,
, and ); , ,
, , and are number of events observed
in data, number of background events estimated from sidebands,
detection efficiency of the -th mode, effective luminosity in
the -th mass bin, and the branching fraction of
decays into the -th mode PDG , respectively.
The resulting cross sections in the full solid angle are shown in
Fig. 4, where the error bars include the statistical
uncertainties in the signal and the background subtraction. The
systematic error for the cross section measurement, which
includes all the sources that have been described other than those arising from the details of the fit to the mass
spectrum, is 8.0% and common to all the data points. The cross
sections of are around 70 pb and 50 pb at the
and peaks, respectively, to be compared with
around 20 pb and 10 pb measured in belley .
Figure 4: The measured cross section for
to . The errors are the summed
statistical errors of the numbers of signal and background events.
A systematic error of 8.0% common to all the data points are not
shown.
In summary, the cross section is measured from
up to for the first time. Two distinct
resonant structures, the and , are observed.
This is the first time that the and have been
observed to decay to final states not involving charm meson pairs.
The products of the branching fraction to and the
partial width are determined to be
and
for one solution; or
and
for the other solution. These transition
rates correspond to about partial widths to
for these two states. We find no evidence for the ,
, or in the final
states, and upper limits of their production rates in
annihilation are determined. The present measurement reveals clear
peaks due to the and decays observed in
experimental data that are absent in the prediction in
Ref. zhaoq , although the theoretical calculation with
carefully chosen parameters agrees with the measured cross
sections of .
We thank the KEKB group for excellent operation of the
accelerator; the KEK cryogenics group for efficient solenoid
operations; and the KEK computer group, the NII, and PNNL/EMSL for
valuable computing and SINET4 network support. We acknowledge
support from MEXT, JSPS and Nagoya’s TLPRC (Japan); ARC and DIISR
(Australia); NSFC (China); MSMT (Czechia); DST (India); INFN
(Italy); MEST, NRF, GSDC of KISTI, and WCU (Korea); MNiSW
(Poland); MES and RFAAE (Russia); ARRS (Slovenia); SNSF
(Switzerland); NSC and MOE (Taiwan); and DOE and NSF (USA).
References
(1) For a recent review, see N. Brambilla et al.,
Eur. Phys. J. C 71, 1534 (2011).
(2) C. Z. Yuan et al. (Belle Collaboration),
Phys. Rev. Lett. 99, 182004 (2007).
(3) B. Aubert et al. (BaBar Collaboration),
Phys. Rev. Lett. 95, 142001 (2005); J. P. Lees et al. (BaBar Collaboration),
Phys. Rev. D 86, 051102 (2012).
(4) X. L. Wang et al. (Belle Collaboration),
Phys. Rev. Lett. 99, 142002 (2007).
(5) B. Aubert et al. (BaBar Collaboration),
Phys. Rev. Lett. 98, 212001 (2007).
(6) S. Godfrey and N. Isgur,
Phys. Rev. D 32, 189 (1985); T. Barnes, S. Godfrey and E. S. Swanson,
Phys. Rev. D 72, 054026 (2005); G. J. Ding, J. J. Zhu and M. L. Yan,
Phys. Rev. D 77, 014033 (2008).
(7) T. E. Coan et al. (CLEO Collaboration),
Phys. Rev. Lett. 96, 162003 (2006).
(8) M. Ablikim et al. (BESIII Collaboration),
Phys. Rev. D 86, 071101 (2012).
(9) Q. Wang, X. H. Liu and Q. Zhao,
Phys. Rev. D 84, 014007 (2011).
(10) A. Abashian et al. (Belle Collaboration),
Nucl. Instrum. Methods A 479, 117 (2002).
(11) S. Kurokawa and E. Kikutani,
Nucl. Instrum. Methods A 499, 1 (2003)
and other papers included in this volume.
(12) G. Rodrigo et al.,
Eur. Phys. J. C 24, 71 (2002). For a review on the generator, see:
S. Actis et al., Eur. Phys. J. C 66, 585 (2010).
(13) E. Nakano,
Nucl. Instrum. Methods A 494, 402 (2002).
(14) K. Hanagaki et al.,
Nucl. Instrum. Methods A 485, 490 (2002).
(15) A. Abashian et al.,
Nucl. Instrum. Methods A 491, 69 (2002).
(16)
for the mode and for the
mode, where and are the nominal and
masses, respectively.
(17) J. Beringer et al. (Particle Data Group),
Phys. Rev. D 86, 010001 (2012).
(18) E. A. Kuraev and V. S. Fadin,
Sov. J. Nucl. Phys. 41, 466 (1985) [Yad. Fiz. 41, 733
(1985)].
(19)
Fitting the spectrum with the product
as a parameter, and
the masses and widths of and fixed to world
average values PDG , we obtain and
for the and
, respectively, for solution I; and
and
for the and , respectively, for solution II.