Observation of charge accumulation and onsite Coulomb repulsion at transition metal impurities in the iron pnictides
Abstract
We report a combined valence band photoemission and Auger spectroscopy study of single crystalline Ca(Fe,Co)2As2 and Ba(Fe,TM)2As2 with TM=Ni or Cu. The valence band photoemission data show directly that the TM-states move to higher binding energies with increasing atomic number, contributing less and less to the states close to the Fermi level. Furthermore, the 3d8 final state of the Auger decay, which is observed for Ni and Cu, unambiguously reveals the accumulation of charge at these impurities. We also show that the onsite Coulomb interaction on the impurity strongly increases when moving from Co over Ni to Cu. Our results quantify the impurity potentials and imply that the superconducting state is robust against impurity scattering.
pacs:
74.70.Xa, 71.20.-b, 79.60.-i, 82.80.PvHigh-temperature superconductivity (HTS) in the iron pnictides is one of the most intensively studied topics in current condensed matter science. Although research efforts established many properties of these materials, important questions still remain to be clarified Stewart (2011). One of these questions regards the effect of replacing a few percent of Fe by other transition metals (TMs) like Co, Ni or Cu. The substitution of Fe by Co or Ni induces HTS Sefat et al. (2008) and therefore it is very important to understand the effects of the TM-impurities on the electronic structure. Exactly these effects, however, remain controversial (e.g. Refs. Berlijn et al., 2012,McLeod et al., 2012 and references therein).
It is often assumed that Co, Ni and Cu mainly dope electrons into the Fe bands without seriously affecting the electronic structure otherwise Canfield and Bud’ko (2010). But this interpretation has been challenged recently. While some studies confirm that the TM substitutions indeed dope additional charge carriers into the Fe-bands Liu et al. (2011); Malaeb et al. (2009); Konbu et al. (2011), others report the lack of additional charge at the Fe sites Bittar et al. (2011); Merz et al. (2012); Khasanov et al. (2011), casting doubts on the electron doping via TM substitution. In addition, recent theoretical studies show that the random scattering potential introduced by the substituted TMs has important effects, which are often neglected but may in fact cause significant modifications to the electronic system Berlijn et al. (2012); Haverkort et al. (2011); Sefat et al. (2008); Wadati et al. (2010). Hence, there is a considerable ongoing debate about the effects of TM substitutions in the iron pnictides.
In this letter we shed light on this issue and investigate the effects of Co, Ni and Cu-substitution by means of photoemission spectroscopy (PES), Auger electron spectroscopy (AES) as well as model calculations. Specifically we report studies of Ca(Fe,Co)2As2 and Ba(Fe,TM)2As2 (TM=Ni, Cu). For Co we chose the Ca- instead of Ba-material, in order to avoid complications due to the overlap of the Ba and the Co edges McLeod et al. (2012). The experimental data were collected at the UE52-PGM beamline of the HZB-BESSY II synchrotron source. Single crystalline samples were grown as described elsewhere Harnagea et al. (2011); Aswartham et al. (2011) and cleaved in situ just before the measurements, which resulted in fresh and mirror-like surfaces. More details about the sample characterization can be found in the supplementary information. PES and AES spectra were recorded using a Scienta R4000 hemispherical analyzer, whereas the X-ray absorption (XAS) was measured via the total electron and fluorescence yield. The photon energy was calibrated against the Au lines, which means that the measured binding energies always refer to the chemical potential. All spectra where recorded with the photon beam at an incident angle of 35∘ with respect to the sample surface, which was parallel to the FeAs-layers. For the PES and AES measurements horizontal and vertical polarized light was used, respectively, to optimize the relative intensities of the two components Weinelt et al. (1997).
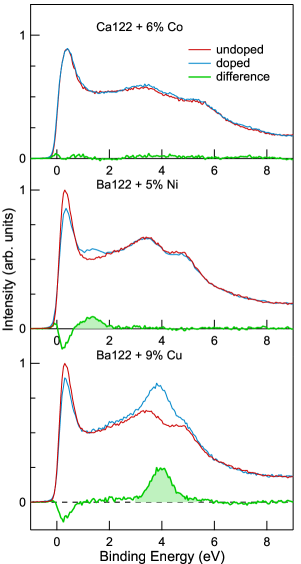
The valence band photoemission data for Ca(Fe,Co)2As2 and Ba(Fe,TM)2As2 (TM=Ni, Cu) are presented in Fig. 1, including the spectra of the corresponding pure parent compounds. In the case of the parent materials, the PES intensity at 0-2 eV and 3-6 eV is due to mostly Fe: and As: derived bands de Jong et al. (2009); Koitzsch et al. (2010). The comparison of Ca(Fe1-xCox)2As2 with to its parent compound CaFe2As2, reveals that both spectra are identical within the error of the experiment. However, for the Ni- and Cu-substituted materials, additional features can be observed clearly in the valence band photoemission. An additional structure centered at the binding energy eV is present in the Ni-substituted BaFe2As2, which does not exist in the parent material and which is evident in the difference of the two spectra. Even more striking, a strong additional peak at eV is found for the Cu-substituted material. We stress that these additional features were fully reproducible and observed for different samples.

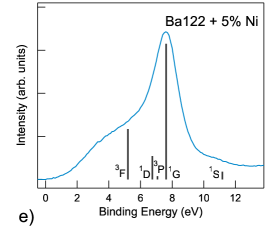
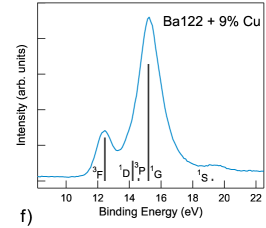
The PES data in Fig.1 is experimental proof that the impurity states move to higher binding energy with increasing atomic number . While the Ni states around 1.4 eV are still located inside the Fe bands, although close to the band bottom, the Cu impurity states are well below the Fe bands. The lack of additional features for the Co-substituted material can be attributed to the fact that these states hybridize strongly with the Fe bands and are distributed over essentially the same energy region.
The above results are in good agreement with previous reports, where similar trends have also been extracted Wadati et al. (2010); McLeod et al. (2012). An important new observation here is that replacing Fe by heavier Ni and Cu, removes Fe-states close to the Fermi level and adds impurity states at higher binding energy, as is nicely demonstrated by the data in Fig. 1. The PES data thereby shows that the heavier TMs contribute less to the states close to the Fermi level. Note that these data can only provide qualitative information about changes in the density of states (DOS), because the PES cross sections for Fe, Co, Ni and Cu are different and not known precisely.
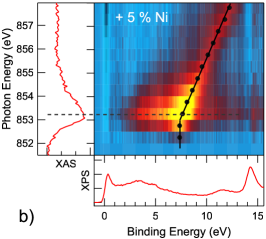
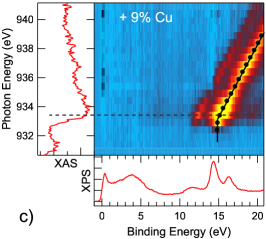
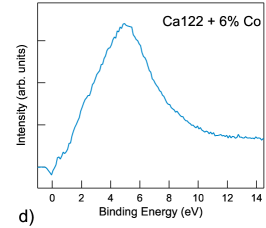
Resonant PES data for the three substituted samples are presented in Fig. 2, including the XAS and the non-resonant PES. The intensity maps as a function of photon energy () and binding energy () have been obtained by subtracting the non-resonant PES spectrum, in order to highlight the resonant features. In all cases a strong increase of the PES intensity can be observed, as soon as the photon energy is tuned to the TM-impurity L3 edge. The PES maps in Fig. 2 show the typical Auger features of resonant PES, namely (i) a resonant Raman Auger decay right at the TM L3 threshold, which occurs at a fixed binding energy, and (ii) the conventional Auger decay at higher , which leads to a constant kinetic energy of the emitted Auger electron () and therefore shifts linearly when plotted as a function of Gel’mukhanov and Ågren (1999); Levy et al. (2012). Comparing the PES maps for Co, Ni and Cu, it can immediately be observed that the Auger final states move to higher binding energies with increasing and, at the same time, develop a clear fine structure.
We will consider the following processes: , with the core hole, the corresponding photo-excited electron, and the emitted Auger electron. The first step corresponds to the absorption of the incoming photon and the second step is the Auger decay. Note that does not participate in the Auger decay, resulting in 2 additional holes in the valence shell. In the case of an isolated atom, the interaction between these holes splits the Auger final state into a characteristic multiplet, consisting of different terms with different energy, total spin and angular momentum . Each of these final -terms gives rise to a line in the total spectrum with a specific intensity. If these lines are sharp and well defined, the multiplet structure of the AES provides a unique fingerprint of the electronic final state configuration.
The broad AES spectrum of Co, however, does not show any clear multiplet structure, as can be observed in Figs. 2 a) and d). This implies that the Co-states are strongly hybridized with the Fe-host: the state with the 2 holes on Co couples strongly to the continuum of states where one hole has moved from Co into the Fe-host, resulting in the observed broad and structureless spectrum. This observation is in agreement with a recent resonant PES study on Ca(Fe1-xCox)2As2 Levy et al. (2012).
As can be seen in Figs. 2 b) and e), Ni shows a much more structured spectrum. The observed lineshape is essentially identical to that found for Ni-metal Weinelt et al. (1997); Bennett et al. (1983), showing structures that agree very well with an atomic Ni: Auger final state multiplet. Both the energy splitting between the different terms and the relative intensities obtained by the atomic calculation Bennett et al. (1983) are in very good agreement with the experimental data.
The observation of a Auger final state for Ni is remarkable, because it is incompatible with the often assumed electron doping. The latter would result in a Ni: in the ground state, from which the Auger final state cannot be reached at all. A Ni: is hence excluded by our data. Instead, the data implies a strong Ni: component in the ground state. Here the final state can be reached via , where the in the intermediate state is due to the screening of the core hole. In principle, a Ni: in the ground state would be also possible. But we can exclude a strong Ni: based on the XAS data, where we and others McLeod et al. (2012) observe a strong XAS peak at the Ni edge, which would be absent for a configuration of Ni.
The spectrum for Cu is even more structured, as demonstrated in Figs. 2 c) and f). Again, we compare the experimental results to an atomic multiplet calculation McGuire (1977) and find excellent agreement with a Cu: final state multiplet. This identification is further supported by comparing our data to previously published results on Cu-metal and CuO2, which also show the Cu: final state multiplet Föhlisch et al. (2001); Tjeng et al. (1991).
The Cu AES data therefore unambiguously identify a significant Cu: or Cu: component in the ground state. In fact, since XAS shown in Fig. 2 c) agrees very well with what is expected for a Cu: Grioni et al. (1992), we can exclude a significant population of Cu:. This result is also in accord with the high of the Cu: states determined by the PES data in Fig. 1. A Cu: state was also deduced in a recent x-ray spectroscopy study McLeod et al. (2012) and indirectly concluded from macroscopic measurements on BaCu2As2 Anand et al. (2012). We can therefore safely conclude that Cu is predominantly in a Cu: configuration, i.e., the Cu-impurities have a closed shell.
In the current situation, a realistic estimate can be made for the effective onsite Coulomb interaction on the impurities, using the Cini-Sawatzky (CS) theory Sawatzky (1977); Vos et al. (1984); Vilmercati et al. (2012). Within this approach the AES intensity is
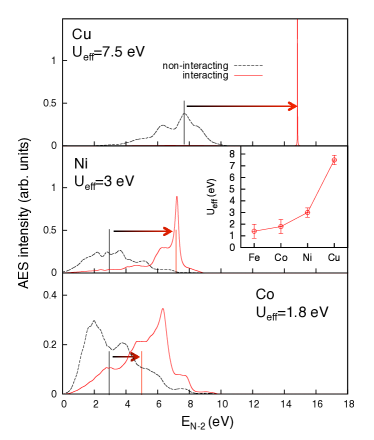
where is the energy of the 2-hole Auger final state relative to the chemical potential, , and is the impurity DOS with the occupied part normalized to 1. Here, we determined by means of density functional theory. These band structure calculations were done in the local density approximation using the full potential code WIEN2K Blaha et al. (2001), as described in Ref. Wadati et al., 2010. The results of this calculation for non-interacting (, ) and interacting () holes are presented in Fig.3.
For Fe (not shown) and Co we determined by fitting the center of mass of the calculated spectra to the corresponding experimental values, which are eV for Fe and eV for Co. For Ni and Cu, we set as to match the measured binding energy of the term, which is 7.35 eV and 14.85 eV, respectively.
The energies of the Auger final states are expressed on the binding energy scale and were determined using the resonant Auger Raman spectra. In this way we obtain eV, eV, eV and eV for Fe, Co, Ni and Cu (inset of Fig. 3). -values for Fe and Co were also reported previously Koitzsch et al. (2010); Vilmercati et al. (2012); Levy et al. (2012) and are in fair agreement with our results. The analysis explains the development of the quasi-atomic : with increasing the Auger final states are pushed out of the continuum of states given by and form localized bound states Sawatzky (1977). The emerging multiplet structure with increasing in Fig. 2 is therefore a direct consequence of the increasing .
The determined here corresponds to the effective Coulomb interaction between 2 holes in the valence shell. depends on the spatial structure of the 2-hole wave function and, most importantly, the screening of these holes by the surrounding charges. Especially the latter strongly reduces the bare (atomic) Coulomb repulsion of 25 eV to the observed . The increase of with is consistent with the observed charge accumulation, i.e., the filling of the TM:-shell with increasing , as this indeed reduces the number of possible screening channels (cf. Ref. Leonov et al., 2006). It is important to point out that the onsite repulsion parameter U used in various theories is model dependent, because different approximations for the wave functions are used and the screening is taken into account to different degrees. U can therefore differ from the fully screened determined here. For example, U for a multi-band model, which takes into account all the relevant screening channels, would be close to the atomic value of 25 eV.
We now discuss the consequences of the above results. Our data confirm the strong overlap and hybridization of the Co and Fe states. The Co states therefore have a significant Fe:3d character, i.e., Co adds electrons to the Fe bands and the number of charge carriers with Fe:3d character increases. But this does not mean that the average local electron density at the Fe-sites increases accordingly, because the delocalized charge carriers have an increased probability of being around Co. Charge density therefore piles up around the Co Levy et al. (2012); Wadati et al. (2010); Berlijn et al. (2012), resulting in const., as was indeed observed by local probes Bittar et al. (2011); Merz et al. (2012); Khasanov et al. (2011). The scattering potential due to the Co-impurities is given by ( eV) Levy et al. (2012) and .
The Ni states are located close to the bottom of the Fe bands and the data in Fig. 1 show that these impurity states contribute only little to the states close to . At the same time, the Ni: observed here is direct and clear experimental proof for the charge accumulation at Ni. As in the Co-case, this is perfectly in line with the const. observed by local probes Bittar et al. (2011). The scattering potential due to the Ni-impurities is much more severe than in the Co-case, because and . This will affect the electronic structure and result in a broadened FS.
The Cu impurities differ from the previous cases in that they form bound states well below the Fe bands with little Fe:3d character. The observed Cu: configuration implies a strong charge accumulation at Cu, which may even result in hole doping of the Fe bands (see also Ref. McLeod et al. (2012)). So the electron doping is reduced and possibly even turned into hole doping when going from Co over Ni to Cu. We also find that the scattering due to Cu with its closed shell is very strong (, ). Correspondingly, a few percent Cu substitution will already make the definition of a FS difficult. We note that the above is in line with a very recent neutron scattering study Kim et al. (2012).
To conclude, if and how many electrons the TM substitution adds to the Fe bands depends crucially on the impurity-host hybridization and the energy difference between the host and impurity states. These parameters depend on the chosen TM and their effects go beyond a mere charge carrier doping. Especially the additional scattering potentials, which are quantified here, affect the low-energy electronic structure, play a role for the phase diagrams and need to be considered in realistic theoretical models. Interestingly, the HTS upon Ni substitution proves that the HTS in the pnictides is robust against strong impurity scattering.
Work at the IFW was supported by the DFG (Grant BE1749/13, SPP1458). SW, JG, and RK acknowledge the support by DFG through the Emmy-Noether program (Grant WU595/3-1, GE1647/2-1). VB acknowledges financial support by the DAAD and GL, ISE and GAS from the Canadian funding agencies NSEC, SFI and CRC. We thank HZB for the allocation of synchrotron radiation beamtime and S. Krause, M. Oehzelt and S. Pohl for their support at the beamline.
References
- Stewart (2011) G. R. Stewart, Rev. Mod. Phys., 83, 1589 (2011).
- Sefat et al. (2008) A. S. Sefat, R. Jin, M. A. McGuire, B. C. Sales, D. J. Singh, and D. Mandrus, Phys. Rev. Lett., 101, 117004 (2008).
- Berlijn et al. (2012) T. Berlijn, C.-H. Lin, W. Garber, and W. Ku, Phys. Rev. Lett., 108, 207003 (2012).
- McLeod et al. (2012) J. A. McLeod, A. Buling, R. J. Green, T. D. Boyko, N. A. Skorikov, E. Z. Kurmaev, M. Neumann, L. D. Finkelstein, N. Ni, A. Thaler, S. L. Bud’ko, P. C. Canfield, and A. Moewes, J. Phys.: Condens. Matter, 24, 215501 (2012).
- Canfield and Bud’ko (2010) P. C. Canfield and S. L. Bud’ko, Annu. Rev. Condens. Matter Phys., 1, 27 (2010).
- Liu et al. (2011) C. Liu, A. D. Palczewski, R. S. Dhaka, T. Kondo, R. M. Fernandes, E. D. Mun, H. Hodovanets, A. N. Thaler, J. Schmalian, S. L. Bud’ko, P. C. Canfield, and A. Kaminski, Phys. Rev. B, 84, 020509 (2011).
- Malaeb et al. (2009) W. Malaeb, T. Yoshida, A. Fujimori, M. Kubota, K. Ono, K. Kihou, P. M. Shirage, H. Kito, A. Iyo, H. Eisaki, Y. Nakajima, T. Tamegai, and R. Arita, J. Phys. Soc. Jpn., 78, 123706 (2009).
- Konbu et al. (2011) S. Konbu, K. Nakamura, H. Ikeda, and R. Arita, J. Phys. Soc. Jpn., 80, 123701 (2011).
- Bittar et al. (2011) E. M. Bittar, C. Adriano, T. M. Garitezi, P. F. S. Rosa, L. Mendonça-Ferreira, F. Garcia, G. d. M. Azevedo, P. G. Pagliuso, and E. Granado, Phys. Rev. Lett., 107, 267402 (2011).
- Merz et al. (2012) M. Merz, F. Eilers, T. Wolf, P. Nagel, H. v. Löhneysen, and S. Schuppler, Phys. Rev. B, 86, 104503 (2012).
- Khasanov et al. (2011) A. Khasanov, S. C. Bhargava, J. G. Stevens, J. Jiang, J. D. Weiss, E. E. Hellstrom, and A. Nath, J. Phys.: Condens. Matter, 23, 202201 (2011).
- Haverkort et al. (2011) M. W. Haverkort, I. S. Elfimov, and G. A. Sawatzky, arXiv:1109.4036 (2011).
- Wadati et al. (2010) H. Wadati, I. Elfimov, and G. A. Sawatzky, Phys. Rev. Lett., 105, 157004 (2010).
- Harnagea et al. (2011) L. Harnagea, S. Singh, G. Friemel, N. Leps, D. Bombor, M. Abdel-Hafiez, A. U. B. Wolter, C. Hess, R. Klingeler, G. Behr, S. Wurmehl, and B. Büchner, Phys. Rev. B, 83, 094523 (2011).
- Aswartham et al. (2011) S. Aswartham, C. Nacke, G. Friemel, N. Leps, S. Wurmehl, N. Wizent, C. Hess, R. Klingeler, G. Behr, S. Singh, and B. Büchner, J. Cryst. Growth, 314, 341 (2011).
- Weinelt et al. (1997) M. Weinelt, A. Nilsson, M. Magnuson, T. Wiell, N. Wassdahl, O. Karis, A. Föhlisch, N. Mårtensson, J. Stöhr, and M. Samant, Phys. Rev. Lett., 78, 967 (1997).
- de Jong et al. (2009) S. de Jong, Y. Huang, R. Huisman, F. Massee, S. Thirupathaiah, M. Gorgoi, F. Schaefers, R. Follath, J. B. Goedkoop, and M. S. Golden, Phys. Rev. B, 79, 115125 (2009).
- Koitzsch et al. (2010) A. Koitzsch, R. Kraus, T. Kroll, M. Knupfer, B. Büchner, H. Eschrig, D. R. Batchelor, G. L. Sun, D. L. Sun, and C. T. Lin, Phys. Rev. B, 81, 174519 (2010).
- Cowan (1981) R. D. Cowan, The Theory of Atomic Structure and Spectra (University of California Press, Berkeley, 1981).
- Bennett et al. (1983) P. A. Bennett, J. C. Fuggle, F. U. Hillebrecht, A. Lenselink, and G. A. Sawatzky, Phys. Rev. B, 27, 2194 (1983).
- McGuire (1977) E. J. McGuire, Phys. Rev. A, 16, 2365 (1977).
- Gel’mukhanov and Ågren (1999) F. Gel’mukhanov and H. Ågren, Physics Reports, 312, 87 (1999).
- Levy et al. (2012) G. Levy, R. Sutarto, D. Chevrier, T. Regier, R. Blyth, J. Geck, S. Wurmehl, L. Harnagea, H. Wadati, T. Mizokawa, I. S. Elfimov, A. Damascelli, and G. A. Sawatzky, Phys. Rev. Lett., 109, 077001 (2012).
- Föhlisch et al. (2001) A. Föhlisch, O. Karis, M. Weinelt, J. Hasselström, A. Nilsson, and N. Mårtensson, Phys. Rev. Lett., 88, 027601 (2001).
- Tjeng et al. (1991) L. H. Tjeng, C. T. Chen, J. Ghijsen, P. Rudolf, and F. Sette, Phys. Rev. Lett., 67, 501 (1991).
- Grioni et al. (1992) M. Grioni, J. F. van Acker, M. T. Czyžyk, and J. C. Fuggle, Phys. Rev. B, 45, 3309 (1992).
- Anand et al. (2012) V. K. Anand, P. K. Perera, A. Pandey, R. J. Goetsch, A. Kreyssig, and D. C. Johnston, Phys. Rev. B, 85, 214523 (2012).
- Sawatzky (1977) G. A. Sawatzky, Phys. Rev. Lett., 39, 504 (1977).
- Vos et al. (1984) M. Vos, D. v. d. Marel, and G. A. Sawatzky, Phys. Rev. B, 29, 3073 (1984).
- Vilmercati et al. (2012) P. Vilmercati, C. P. Cheney, F. Bondino, E. Magnano, M. Malvestuto, M. A. McGuire, A. S. Sefat, B. C. Sales, D. Mandrus, D. J. Singh, M. D. Johannes, and N. Mannella, Phys. Rev. B, 85, 235133 (2012).
- Blaha et al. (2001) P. Blaha, K. Schwarz, G. Madsen, D. Kvasnicka, and J. Luitz, WIEN2k: An Augmented Plane Wave Plus Local Orbitals Program for Calculating Crystal Properties (TU Wien, Austria, 2001).
- Leonov et al. (2006) I. Leonov, A. N. Yaresko, V. N. Antonov, U. Schwingenschlögl, V. Eyert, and V. I. Anisimov, Journal of Physics: Condensed Matter, 18, 10955 (2006).
- Kim et al. (2012) M. G. Kim, J. Lamsal, T. W. Heitmann, G. S. Tucker, D. K. Pratt, S. N. Khan, Y. B. Lee, A. Alam, A. Thaler, N. Ni, S. Ran, S. L. Bud’ko, K. J. Marty, M. D. Lumsden, P. C. Canfield, B. N. Harmon, D. D. Johnson, A. Kreyssig, R. J. McQueeney, and A. I. Goldman, Phys. Rev. Lett., 109, 167003 (2012).
I Supplementary material:
Growth and characterization of Ba(Fe,TM)2As2 (TM=Co, Ni, Cu)
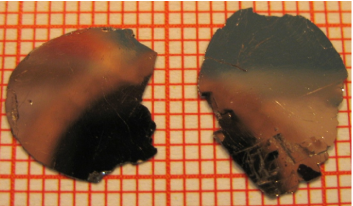
All the crystals used for the present study were grown by the self flux technique as described in Refs. Harnagea et al., 2011 and Aswartham et al. (2011), using FeAs as flux. In case of the Ba(Fe1-xCox)2As2 system, details about the crystal growth, the characterization and the physical properties were published in Ref. Aswartham et al., 2011. Here we provide additional details regarding the growth and the characterization of the Ni and Cu substituted BaFe2As2 single crystals. The pre-reacted precursor materials FeAs, Fe2As, BaAs and metallic Ni or Cu (TM) were mixed, leading to a Ba(Fe1-xTMx)3.1As3.1 composition. This composition was used to achieve a homogeneous melt at T = 1463 K. The melt was cooled slowly under a temperature gradient in a double-wall crucible assembly to obtain large and flux-free single crystals of Ba(Fe1-xNix)2As2 and Ba(Fe1-xCux)2As2. Two examples for the obtained single crystals with typical dimensions are shown in the Fig 4.
The high quality of the grown single crystals was assured by several complementary techniques. From each batch, several samples were examined with a Scanning Electron Microscope (SEM Philips XL 30) equipped with an electron microprobe analyzer for the semi-quantitative elemental analysis in the energy dispersive X-ray (EDX) mode. Using EDX, the Ni and Cu concentration was determined by averaging over several different points on the sample surface. The estimated composition from the EDX for the present single crystals is Ba(Fe0.95Ni0.05)2As2 and Ba(Fe0.91Cu0.09)2As2. In general, the error of an EDX analysis is about 2 mass percent without any additional standardization procedure. However, the method of averaging reduces the size of the error bars significantly. In this way the concentration of Co, Ni and Cu was determined to be , and .
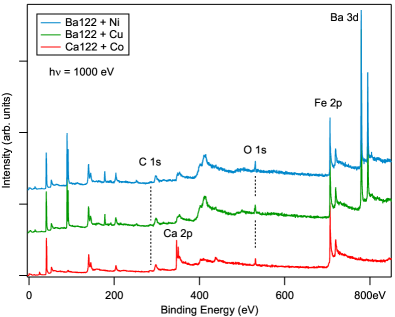
In addition to this, the TM contents of the studied samples were also verified in-situ by XPS measurements, which gave the same results as EDX. The in-situ XPS measurements also do not show any sign of a significant oxygen contamination in any of the studied samples. Representative XPS survey scans are displayed in Fig. 5. The weak O 1s line is comparable to what has been reported previously in the literature for high-purity samples McLeod et al. (2012), which verifies the high quality of the studied single crystals. Our XAS measurements also exclude the presence of Fe-oxide impurities, which would leave a clear fingerprint in these spectra Merz et al. (2012).
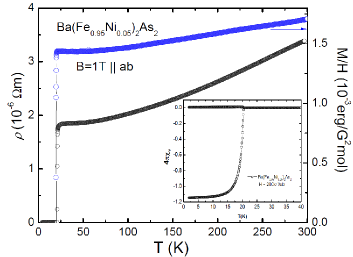
Prior the synchrotron experiments, the high quality of our single crystals was also checked by XRD, resisitivity and mangnetization measurements. In Fig. 6 we show representative measurements for our Ba(Fe0.95Ni0.05)2As2 single crystals. The data in Fig. 6, reveals that the structural and magnetic transitions are completely suppressed by 5% Ni-substitution, whereas bulk superconductivity occurs. This is in excellent agreement with the literature (S.L. Bud’ko et al., Phys. Rev. B 79, 220516R (2009)). Furthermore, the superconducting transition at Tc = 21 K is very sharp and, within the error bars of our experiment, we find a superconducting volume fraction of 100%. This further confirms the very high quality of our single crystals. Also the Cu-substituted samples were characterized by the same methods prior the synchrotron experiments. The structural quality was verified by XRD and, in agreement with the previous literature, the sample with 9% Cu substitution does not show superconductivity down to 1.8 K.