Self-organized criticality in single neuron excitability
Abstract
We present experimental and theoretical arguments, at the single neuron level, suggesting that neuronal response fluctuations reflect a process that positions the neuron near a transition point that separates excitable and unexcitable phases. This view is supported by the dynamical properties of the system as observed in experiments on isolated cultured cortical neurons, as well as by a theoretical mapping between the constructs of self organized criticality and membrane excitability biophysics.
pacs:
Introduction
Cellular excitability is a fundamental physiological process whereby voltage-dependent changes in exciting and restoring membrane ionic conductances lead to an action potential (AP), a transient change in trans-membrane voltage. Hodgkin and Huxley Hodgkin and Huxley (1952) formalized a generic biophysical mechanism underlying the ignition and propagation of action potentials. In this formalism, as well as in its later extensions, the flow of ions down their electrochemical gradients is modulated by the probability of ion channel proteins to reside in a conductive state. An extensive set of observations shows that the activity and response properties of neurons are highly variable, fluctuating over extended time scales in a complex manner (e.g. Lowen and Teich (1996); Teich et al. (1997); Gal et al. (2010)) that are not easily accounted for by either the original Hodgkin-Huxley formalism nor by its extensions i.e. by adding more ionic currents, gates and channel states, see Soudry and Meir (2012)). Several approaches have been suggested for explaining these fluctuations, largely focusing on the stochastic nature of underlying mechanisms Schneidman et al. (1998); Lowen et al. (1999); Soen and Braun (2000); Gilboa et al. (2005), non linearity and chaotic dynamics Korn and Faure (2003); Marom (2009), or network level effects van Vreeswijk and Sompolinsky (1996).
This paper approaches variability and complexity in single neuron activity from a different viewpoint. Conventional analyses and models of excitability use dynamical system approaches Izhikevich (2007). However, excitability is known to be an emergent property of coupled states of numerous interacting microscopic elements - ion channels, calling for statistical-mechanics description. While clues do exist for the potential benefit of thinking on excitability in statistical-mechanics terms (for instance, voltage fluctuations near the spiking bifurcation point, in biophysical models of excitability, were shown to exhibit critical-like behavior Roa et al. (2007); Steyn-Ross et al. (2006)), such an approach has not yet been explicitly proposed. Here we apply the framework of self-organized criticality (SOC) to the level of a single, individual neuron, treated as an ensemble of interacting ion channels.
Originally introduced into the study of neural systems as a framework for explaining distributions of durations and sizes of network-wide events of activity (‘avalanches’) in cultured neural networks Beggs and Plenz (2003), SOC has since been applied to in-vivo recordings at the network and whole-brain levels Chialvo (2010). Acknowledging the controversies that surround its experimental foundations Dehghani et al. (2012); Bédard et al. (2006), SOC provides an attractive theoretical framework for explaining the emergence of complexity in neural dynamics, establishing intriguing links to a long tradition of statistical-mechanics treatment of neural networks Sompolinsky (1988). However, all of these studies treated the neural network as an ensemble of interacting neurons, markedly different from the study presented here, which consider the neuron as an isolated physical system. The relevance of our ideas to brain dynamics remains to be determined.
Summary of experimental observations
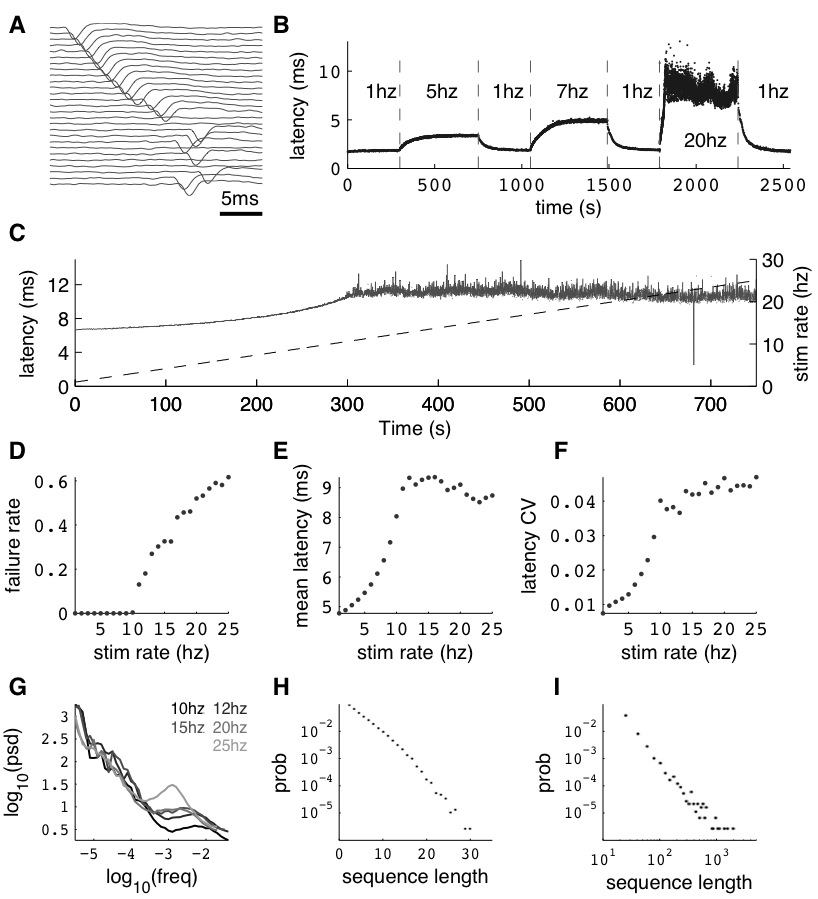
In a series of experiments, detailed in a previous publication Gal et al. (2010), the intrinsic dynamics of excitability was observed by monitoring the responses of single neurons to series of pulse stimulations. In brief, cortical neurons from newborn rats were cultured on multi-electrode arrays, allowing extracellular recording and stimulation for long, practically unlimited durations. The neurons were isolated from their network by means of pharmacological synaptic blockage to allow study of intrinsic excitability dynamics, with minimal interference of coupled cells. Neurons were stimulated with sequences of short, supra-threshold identical electric pulses. For each pulse, the binary response (AP produced or not) was registered, marking the neuron as residing in either excitable or unexcitable state. For each AP recorded, the latency from stimulation to the AP was also registered. The amplitude of the stimulating pulses was constant and set well above threshold, such that the neuron will respond in a 1:1 manner (i.e. every stimulation pulse produces an AP) under a low rate (1Hz) stimulation condition.
When the stimulation rate is increased to values higher than 1Hz, two distinct response regimes can be identified: a stable regime, in which each stimulation elicits an AP, and an intermittent regime, in which the spiking is irregular. The response of a neuron following a change of stimulation rate is demonstrated in Figure 1A and 1B, as well as in Gal et al. (2010): When stimulation rate is abruptly increased to a higher value, the latency gradually becomes longer and stabilizes on a new value. For high enough stimulation rate (above a critical value ), the 1:1 response mode breaks down and becomes intermittent. All transitions are fully reversible. The steady state properties of the two response regimes may be observed by slowly changing the stimulation rate. As seen in the result of the ‘adiabatic’ experiment (Figure 1C), the stable regime is characterized by 1:1 response (no failures), stable latency (low jitter) and monotonous dependency of latency on stimulation rate. In contrast, the intermittent regime is characterized by a failure rate that increases with stimulation rate, unstable latency (high jitter) and independence of the mean latency on the stimulation rate. The existence of a critical (or threshold) stimulation rate is reflected in measures of failure rate (Figure 1D), mean latency (Figure 1E) and latency coefficient of variation (Figure 1F). The exact value of varies considerably between neurons, but its existence is observed in practically all measured neurons (see details in Gal et al. (2010)).
Within the intermittent regime, the fluctuations of excitability (as defined by the excitable/unexcitable state sequence) are characterized by scale-free long-memory statistics. Its power spectral density (PSD) exhibits a power-law () tail at the low frequency domain. The characteristic exponent of this power-law does not depend on the stimulation rate, as long as the latter is kept above (Figure 1G). The typical exponent of the rate PSD is (mean SD, calculated over 16 neurons).
Moreover, within the intermittent regime, the distributions of the lengths of consecutive response sequences (i.e. periods of time the neuron is fully excitable, responding to each stimulation pulse) and consecutive no-response sequences (i.e. periods of time the neuron is not responding), are qualitatively different (Figures 1H and 1I). The consecutive response sequence length histogram is strictly exponential, having a characteristic duration, while the consecutive no-response sequence length histogram is wide, to the point of scale-freeness. Likelihood ratio tests for power law distribution fit to the empirical histogram (containing 90,000 samples) yielded significantly more likelihood comparing with Exponential fit, log normal, stretched exponential, and linear combination of two exponential distributions (all with normalized log likelihood ratios of , , see Clauset et al. (2009)). This suggests that the fluctuations are dominated by widely distributed excursions into an unexcitable state.
Interpretation
In what follows we suggest an interpretation to the origin of the above experimental results in terms of critical phenomena, accounting for the complex statistics of single neuron excitability over extended time scales. The concept of ‘excitability’ is vaguely defined; it generally reflects the susceptibility of the cell to produce an action potential in response to input above a given amplitude. In that sense, a ‘non-excitable’ cell is one that can not evoke an AP, regardless of the stimulation amplitude, while ’excitable’ cell is characterized by a continuous measure that quantifies excitability. Such a measure can be for example the minimal stimulation amplitude required for evoking an AP (the threshold), or alternatively the latency of the evoked AP, a more easily observed measure which is tightly related to the threshold.
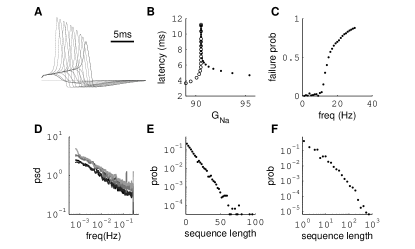
Excitability is a lumped product of the individual states of numerous interacting ion channels; the aggregated macroscopic availability of these ionic channels to move into the conductive state and participate in the generation of action potentials. In the short term, the total number of ionic channels that are available to participate in AP generation may safely be assumed to be a constant. In the original Hodgkin and Huxley formalism, aims at the scale of milliseconds, the latter assumption is translated to maximal conductance parameters that set limits on the instantaneous dynamics of the membrane. However, when long-term effects are sought, the maximal conductance might (and indeed should) be treated as a macroscopic system variable governed by stochastic, activity dependent, transitions of ion channels into and out from long-lasting unavailable states. These transitions are globally and locally coupled via membrane voltage, ionic concentrations and cellular modulatory and homeostatic processes. Since unavailable channels cannot contribute to membrane electrical response, slow changes in maximal conductance will be reflected in the time-amplitude envelope of the generated action potential, as well as in the very ability to generate it. The precise impacts of slow changes in maximal conductances on excitability depend upon the specific type of ionic channel involved (i.e., mediating exciting or restoring ionic flows). Figures 2A and 2B exemplify this point for the case of sodium maximal conductance. Such viewed, excitability has the flavor of an order-parameter, a measurable macroscopic physical quantity that reflects an average over the individual states of elements in an ensemble. The complex irregularity of neuronal responses over extended time scales, observed in the experiments described above, is thus naturally interpreted as a reflection of residency of the system near a phase transition between excitable and unexcitable phases, giving rise to the observed power-law statistics.
However, given the above interpretation of fluctuations in excitability as reflecting critical phenomena, one would expect to observe the critical characteristics within a limited range of the experimental control parameter (i.e. stimulation rate); higher values of stimulation rate should shut-down excitability altogether. This is not the case. For example, panels 1E and G show that response latency as well as the characteristic exponent of the power spectral density, are insensitive to the stimulation rate. The reason for this apparent inconsistency is that stimulation rate does not directly impact on the dynamics of the underlying ionic channels. Rather, the relevant control parameter is in fact the activity rate, itself a dynamic variable of the system. This suggests a form of self-organization.
The concept of Self-Organized Criticality Bak et al. (1987) designates a cluster of physical phenomena characterizing systems that reside near a phase transition. What makes SOC unique is the fact that residing near a phase transition is not the result of a fine-tuned control parameter; rather, in SOC the system positions itself near a phase transition as a natural consequence of the underlying internal dynamic process that pushes towards the critical value. Such systems exhibit many complex statistical and dynamical features that characterize behavior near a phase transition, without these features being sensitive to system parameters. Dickman and his colleagues Dickman et al. (1998, 2000) formalized a scheme for generating SOC from a conventional system exhibiting a phase transition. They have shown that many of the canonical models of SOC, including sandpile and forest fire models, can be understood as systems exhibiting absorbing state phase transition. Systems such as the contact process or activated random walk may reside about the phase transition, if amended with a carefully designed feedback: dissipating energy whenever the system is supercritical (i.e. permanently active without settling into an absorbing state), and driving the system whenever it is subcritical (i.e. when and only when it settles into the absorbing state).
This picture naturally maps into excitability dynamics, where neural activity serves as a temperature-like parameter, and the single AP serving as a drive (quantal influx of energy, or small increase in temperature).
In the absence of activity, the neuron reaches an excitable state (the ‘absorbing state’ in such a mapping), while increased activity reduces excitability, and (when high enough) pushes the membrane into the unexcitable state. Residency in the unexcitable state decreases neural activity, leading to restoration of excitability. As a result, the neuron is kept around a barely-excitable state, exhibiting characteristics of SOC.
Of course, not all classes of neurons follow this simplistic process, but the general idea holds: activity pushes excitability towards a threshold state, while at the longer time scale regulatory feedback pulls the system back.
Model
The above interpretation of excitability in SOC terms, may also be theoretically supported, within certain limits, by considering the underlying biophysical machinery. The state of the membrane is a function of the individual states of a large population of interacting ion channel proteins. A single ion channel can undergo transformations between uniquely defined conformations, conventionally modeled as states in a Markov chain. The faster transition dynamics between states is the foundation of the Hodgkin Huxley model, which describes the excitation event itself - the action potential. But, as explained above, for the purpose of modeling the dynamics of excitability, rather than the generative dynamics of the action potential itself, it is useful to group these conformations into two sets Toib et al. (1998); Gilboa et al. (2005); Marom (2009, 2010): the available, in which channels can participate in generation of action potentials, and the unavailable, in which channels are deeply inactivated and are “out of the game” of action potential generation. The microscopic details of the single channel dynamics in this state space, and definitely the collective dynamics of the interacting ensemble, are complex Liebovitch et al. (1987); Millhauser et al. (1988a, b) and no satisfactory embracing model exists to date.
However, it has been suggested recently Marom (2009, 2010) that the transition dynamics between the available and unavailable states may be expressed in terms of an “adaptive rate”, Logistic-like model of the general form:
| (1) |
where is a function of the neural activity measure , and is a monotonically increasing function of the system state , which represents the gross availability of ion channels. In this modeling approach, complex transition statistics are a result of ensemble-level interaction, rather than of the internal structure of the single channel state space.
Following the lead of the above adaptive rate approach, one can consider, for instance, a model in which represents the availability of a restoring (e.g. potassium) conductance 111For example, the calcium dependent potassium SK channel Adelman et al. (2012) is an excitability inhibitor, having a calcium mediated positive interaction that gives rise to a form similar to equation 1. The state of the single channel is represented by a binary variable ; is the unavailable state and is the available state. Unavailable channels are recruited with a rate of , while available channels are lost with a rate of . This picture gives rise to a dynamical mean field like equation:
| (2) |
The model is a variant of a globally coupled contact process, a well-studied system exhibiting an absorbing state phase transition Harris (1974). Here, is the absorbing state, representing the excitable state of the system. In the artificial case of as an externally modified control parameter, for (low activity) the system will always settle into this state, and the neuron will sustain this level of activity. For , the system will settle on , an unexcitable state, and the neuron will not be able to sustain activity. Feedback is introduced into the system by specifying the state dependency of : An AP is fired if and only if the system is excitable (i.e. in the absence of restoring conductance, =0), giving rise to a small increase in . When , the system is unexcitable, APs are not fired, and is slowly decreased. This is an exact implementation of the scheme proposed in Dickman et al. (1998, 2000): an absorbing state system, where the control parameter (activity, ) is modified by a feedback from the order parameter (excitability, a function of ).
As always with SOC, the distinction between order and control parameters becomes clear only when the conservative, open-loop version of the model is considered. Note that the natural dependency of the driving event (the AP) on the system state in our neural context, resolves a subtlety involved in SOC dynamics: the system must be driven slowly enough to allow the absorbing state to be reached, before a new quantum of energy is invested. In most models, this condition is met by taking driving rate to be infinitesimally small.
Numerical simulation of the model (equation 2, together with the closed loop dynamics of , see methods section) qualitatively reproduces the power-law statistics observed in the experiment, including the existence of a critical stimulation rate (Figure 2C), the behavior for , with exponent independent on (Figure 2D), and the distributions of sequence durations (Figures 2E and 2F). The model has three relevant parameters: the integration timescale of neural activity, the quantum of activity () added following each AP, and the stimulation rate . The critical stimulation rate , is adjustable by changing the first two parameters, and the SOC behavior is observed for any , conditioned that . While the model does capture key observed properties, others are not accounted for. The latency transient dynamics when switching between stimulation rates (Figure 1B) and the multitude of stable latency values for (Figure 1C), suggest that a model with a single excitable state is not sufficient. Sandpile models (and more generally activated random walk models, see Dickman et al. (1998, 2000)), do exhibit such multiplicity, arising due to a continuum of stable subcritical values of pile height (or slope). In this analogy, adding grains to the pile increases its height up to the critical point, where SOC is observed. Another experimentally observed property that is not accounted for by the model, is the existence of pattern modes in the intermittent response regime as described in (Figure 10 of Gal et al., 2010), implying strong temporal correlations between events of excitability and unexcitability. These temporal correlations affect the exponent of the power-law spectral density, and might explain the difference between the exponent in the experiment and in the model simulation. Such correlations are not alien to SOC, and might arise in variant models Davidsen and Paczuski (2002).
Concluding comments
We have given several arguments, experimental and theoretical, in support of a connection between the framework of SOC and the dynamics underlying response fluctuations in single neurons. This interpretation succeeds in explaining critical-like fluctuations of neuronal responsiveness over extended timescale, which are not accounted for by other, more common, approaches Englitz et al. (2008); Soudry and Meir (2012). The key component that enables SOC in the ion channel ensemble is the existence of inter-channel interaction. While the interaction chosen here is global, there are evidence that short range cooperation (as is more abundant in physical models of SOC) also exist between ion channels Naundorf et al. (2006), and might be used to construct alternative models. Naturally, the simple model leading to equation 2 is not unique, probably wrong in its microscopical details. Moreover, excitability is determined by more than one order parameter, and the interaction types are much more heterogeneous, controlled by an aggregate of such equations, representing the exciting and restoring forces, each pushing-pulling excitability to opposite directions.
Nevertheless, while respecting the gap between theoretical models and biological reality, SOC seems to capture the core phenomenology of fluctuating neuronal excitability, and has a potential to enhance our understanding of physiological aspects of excitability dynamics.
Materials and Methods
Cultured neurons experiments.
Experiments were performed on cultures of cortical neurons of newborn rats, as described in Marom and Shahaf (2002); Gal et al. (2010). Neurons were cultured on multielectrode arrays, allowing for extracellular recording of neuronal activity and extracellular electrical stimulation. As described in Gal et al. (2010), experiments where performed under complete blockage of synaptic transmission, to allow the study of intrinsic excitability dynamics in isolation from the effect of the activity of other neurons. Neurons were stimulated with sequences of short (400) pulse stimulations from one of the electrodes, with fixed inter stimulus interval. Following each pulse, the response of neurons was recorded (from a different electrode): whether a spike was fired or not, and the latency of the response from the stimulation pulse. While the effect of the stimulation is local to the part of the neuron near the stimulation electrode, the latency to the response reflects the conductance properties along the neuron from the stimulation electrode to the recording one, usually hundreds of microns away. Careful measures were applied Gal et al. (2010) to exclude experimental instabilities modulation the response of neurons over time.
Hodgkin-Huxley model simulation.
A Hodgkin-Huxley model neuron (Figures 2A and 2B) was simulated using standard dynamic and rate equations Dayan and Abbott (2001). The neuron was stimulated with an injected rectangular current pulse (500 duration, amplitude), and the voltage dynamics was observed. Leak conductance was set to 0.3, the potassium conductance to 28 and the sodium conductance was changed in the range of 80-110.
Contact process simulation.
Simulation was performed using an ensemble of 10,000 channels. The loop on neuronal activity was closed as follows: for each AP fired, a single channel was inactivated, and was increased by a value of . Between APs, decayed exponentially with a rate of . Simulation length was 1 hour for each stimulation rate for Figure 2C, and 12 hours for each stimulation rate for Figures 2D-F. The full Matlab code of the simulation can be accessed in the authors website 222here comes a link to the code
References
- Hodgkin and Huxley (1952) A.L. Hodgkin and A.F. Huxley, “A quantitative description of membrane current and its application to conduction and excitation in nerve,” The Journal of Physiology 117, 500–544 (1952).
- Lowen and Teich (1996) S B Lowen and M C Teich, “The periodogram and Allan variance reveal fractal exponents greater than unity in auditory-nerve spike trains,” The Journal of the Acoustical Society of America 99, 3585–3591 (1996).
- Teich et al. (1997) M C Teich, C Heneghan, S B Lowen, T Ozaki, and E Kaplan, “Fractal character of the neural spike train in the visual system of the cat,” Journal of the Optical Society of America A 14, 529–546 (1997).
- Gal et al. (2010) Asaf Gal, Danny Eytan, Avner Wallach, Maya Sandler, Jackie Schiller, and Shimon Marom, “Dynamics of excitability over extended timescales in cultured cortical neurons,” The Journal of Neuroscience 30, 16332–42 (2010).
- Soudry and Meir (2012) Daniel Soudry and Ron Meir, “Conductance-based neuron models and the slow dynamics of excitability.” Frontiers in Computational Neuroscience 6, 4 (2012).
- Schneidman et al. (1998) E Schneidman, B Freedman, and I Segev, “Ion channel stochasticity may be critical in determining the reliability and precision of spike timing.” Neural Computation 10, 1679–1703 (1998).
- Lowen et al. (1999) S B Lowen, L S Liebovitch, and J A White, “Fractal ion-channel behavior generates fractal firing patterns in neuronal models,” Physical Review E 59, 5970–5980 (1999).
- Soen and Braun (2000) Y Soen and E Braun, “Scale-invariant fluctuations at different levels of organization in developing heart cell networks,” Physical Review E 61, R2216–9 (2000).
- Gilboa et al. (2005) Gail Gilboa, Ronen Chen, and Naama Brenner, “History-dependent multiple-time-scale dynamics in a single-neuron model.” The Journal of Neuroscience 25, 6479–6489 (2005).
- Korn and Faure (2003) Henri Korn and Philippe Faure, “Is there chaos in the brain? II. Experimental evidence and related models,” Comptes Rendus Biologies 326, 787–840 (2003).
- Marom (2009) Shimon Marom, “Adaptive transition rates in excitable membranes.” Frontiers in Computational Neuroscience 3, 2 (2009).
- van Vreeswijk and Sompolinsky (1996) C van Vreeswijk and H Sompolinsky, “Chaos in neuronal networks with balanced excitatory and inhibitory activity.” Science 274, 1724–6 (1996).
- Izhikevich (2007) Eugene M. Izhikevich, Dynamical Systems in Neuroscience (MIT Press, 2007) p. 441.
- Roa et al. (2007) M. Roa, M. Copelli, O. Kinouchi, and N. Caticha, “Scaling law for the transient behavior of type-II neuron models,” Physical Review E 75, 021911 (2007).
- Steyn-Ross et al. (2006) D. Steyn-Ross, Moira Steyn-Ross, M. Wilson, and J. Sleigh, “White-noise susceptibility and critical slowing in neurons near spiking threshold,” Physical Review E 74, 051920 (2006).
- Beggs and Plenz (2003) John M Beggs and Dietmar Plenz, “Neuronal avalanches in neocortical circuits.” The Journal of Neuroscience 23, 11167–77 (2003).
- Chialvo (2010) Dante R. Chialvo, “Emergent complex neural dynamics,” Nature Physics 6, 744–750 (2010).
- Dehghani et al. (2012) Nima Dehghani, Nicholas G Hatsopoulos, Zach D Haga, Rebecca a Parker, Bradley Greger, Eric Halgren, Sydney S Cash, and Alain Destexhe, “Avalanche Analysis from Multielectrode Ensemble Recordings in Cat, Monkey, and Human Cerebral Cortex during Wakefulness and Sleep.” Frontiers in physiology 3, 302 (2012).
- Bédard et al. (2006) C Bédard, H Kröger, and A Destexhe, “Does the 1/f frequency scaling of brain signals reflect self-organized critical states?” Physical Review Letters 97, 118102 (2006).
- Sompolinsky (1988) Haim Sompolinsky, “Statistical Mechanics of Neural Networks,” Physics Today 41, 70 (1988).
- Clauset et al. (2009) Aaron Clauset, Cosma Rohilla Shalizi, and M E J Newman, “Power-law distributions in empirical data,” (2009).
- Bak et al. (1987) Per Bak, Chao Tang, and K Wiesenfeld, “Self-organized criticality: An explanation of the 1/f noise,” Physical Review Letters 59, 381–384 (1987).
- Dickman et al. (1998) Ronald Dickman, Alessandro Vespignani, and Stefano Zapperi, “Self-organized criticality as an absorbing-state phase transition,” Physical Review E 57, 5095–5105 (1998).
- Dickman et al. (2000) Ronald Dickman, MA Muñoz, Alessandro Vespignani, and Stefano Zapperi, “Paths to self-organized criticality,” Brazilian Journal of Physics 30 (2000).
- Toib et al. (1998) A Toib, V Lyakhov, and S Marom, “Interaction between duration of activity and time course of recovery from slow inactivation in mammalian brain Na+ channels,” The Journal of Neuroscience 18, 1893–1903 (1998).
- Marom (2010) Shimon Marom, “Neural timescales or lack thereof,” Progress in Neurobiology 90, 16–28 (2010).
- Liebovitch et al. (1987) Larry S. Liebovitch, Jorge Fischbarg, Jan P. Koniarek, Irina Todorova, and Mei Wang, “Fractal model of ion-channel kinetics,” Biochimica et Biophysica Acta (BBA) - Biomembranes 896, 173–180 (1987).
- Millhauser et al. (1988a) G L Millhauser, E E Salpeter, and R E Oswald, “Rate-amplitude correlation from single-channel records. A hidden structure in ion channel gating kinetics?” Biophysical Journal 54, 1165–8 (1988a).
- Millhauser et al. (1988b) G L Millhauser, E E Salpeter, and R E Oswald, “Diffusion models of ion-channel gating and the origin of power-law distributions from single-channel recording.” PNAS 85, 1503–7 (1988b).
- Note (1) For example, the calcium dependent potassium SK channel Adelman et al. (2012) is an excitability inhibitor, having a calcium mediated positive interaction that gives rise to a form similar to equation 1.
- Harris (1974) TE Harris, “Contact interactions on a lattice,” The Annals of Probability 2, 969–988 (1974).
- Davidsen and Paczuski (2002) Jörn Davidsen and Maya Paczuski, “1/F^{Α} Noise From Correlations Between Avalanches in Self-Organized Criticality,” Physical Review E 66, 050101 (2002).
- Englitz et al. (2008) Bernhard Englitz, Klaus M Stiefel, and Terrence J Sejnowski, “Irregular Firing of Isolated Cortical Interneurons in Vitro,” Neural Computation 20, 44–64 (2008).
- Naundorf et al. (2006) Björn Naundorf, Fred Wolf, and Maxim Volgushev, “Unique features of action potential initiation in cortical neurons.” Nature 440, 1060–3 (2006).
- Marom and Shahaf (2002) Shimon Marom and Goded Shahaf, “Development, learning and memory in large random networks of cortical neurons: lessons beyond anatomy.” Quarterly Reviews of Biophysics 35, 63–87 (2002).
- Dayan and Abbott (2001) Peter Dayan and L F Abbott, Theoretical Neuroscience: Computational And Mathematical Modeling of Neural Systems (MIT Press, Cambridge, 2001) p. 460.
- Note (2) Here comes a link to the code.
- Adelman et al. (2012) John P Adelman, James Maylie, and Pankaj Sah, “Small-conductance Ca2+-activated K+ channels: form and function.” Annual review of physiology 74, 245–69 (2012).