xx–xx
Assembly Histories and Observational Properties of Simulated Early-type Galaxies
Abstract
We demonstrate that massive simulated galaxies assemble in two phases, with the initial growth dominated by compact in situ star formation, whereas the late growth is dominated by accretion of old stars formed in subunits outside the main galaxy. We also show that 1) gravitational feedback strongly suppresses late star formation in massive galaxies contributing to the observed galaxy colour bimodality that 2) the observed galaxy downsizing can be explained naturally in the two-phased model and finally that 3) the details of the assembly histories of massive galaxies are directly connected to their observed kinematic properties.
keywords:
galaxies: elliptical and lenticular, galaxies: formation, galaxies: evolution1 The two phased formation of early-type galaxies
High-resolution numerical zoom-in simulations of massive early-type galaxies have shown that there are two distinct phases in their formation histories ([Naab et al.(2007)Naab, Johansson, Ostriker, & Efstathiou, Naab et al. 2007]; [Oser et al.(2010)Oser, Ostriker, Naab, Johansson, & Burkert, Oser et al. 2010]; [Lackner et al.(2012)Lackner, Cen, Ostriker, & Joung, Lackner et al. 2012]). At high redshifts of the galaxies assemble rapidly through compact in situ star formation. The later growth of the galaxies proceeds predominantly through the accretion of stars formed in subunits outside the main galaxy. The majority of the accreted stars are added to the outskirts of the galaxies at larger radii providing a satisfactory explanation for the observed size growth of massive early-type galaxies (ETGs) since until the present-day ([Naab et al.(2009)Naab, Johansson, & Ostriker, Naab et al. 2009]; [Bezanson et al.(2009)Bezanson, van Dokkum, Tal, Marchesini, Kriek, Franx, & Coppi, Bezanson et al. 2009]; [Oser et al.(2012)Oser, Naab, Ostriker, & Johansson, Oser et al. 2012]).
Here we show that in addition to the size growth of ETGs, the two phased formation picture can also shed light on other observational results of ETGs, such as the observed galaxy bimodality, the downsizing of massive galaxies and the observed dichotomy of the kinematic properties of ETGs. The simulation sample we use to address these questions contains 9 galaxies simulated at high-resolution ([Johansson et al.(2012)Johansson, Naab, & Ostriker, Johansson et al. 2012]) using the Gadget-2 code ([Springel(2005), Springel 2005]). The simulations include cooling for a primordial composition, star formation and feedback from type II supernovae, but exclude supernova driven winds and AGN feedback. We run three models (A2,C2,E2) at very high spatial () and mass resolution () with the remaining six simulations (U,Y,T,Q,M,L) simulated at a somewhat lower resolution of (, ). We organize the galaxies in our simulation sample into three groups of three galaxies each depending on whether their late assembly history is dominated primarily by dissipationless minor merging (mostly accreted stars: galaxies C2,U,Y), a mixed dissipationless/dissipational (mostly accreted and some in situ stars: galaxies A2,Q,T) or a primarily dissipational formation history (significant amount of in situ stars: galaxies E2,M,L). We find that this classification of the assembly histories of ETGs is useful as it broadly separates more massive ETGs forming dissipationlessly from less massive ETGs with a more dissipational formation history.
2 The bimodality of the local galaxy population
Recent large-field sky surveys have unequivocally demonstrated that local galaxies show a bimodal distribution. Local galaxies with stellar masses above a critical mass of are typically red spheroidal galaxies with old stellar populations, whereas galaxies below this critical mass are typically blue, star-forming galaxies with somewhat younger stellar populations. The observed bimodality is usually explained theoretically using models in which the star formation is efficiently quenched in massive haloes above ([Dekel & Birnboim(2006), Dekel & Birnboim 2006]; [Gabor et al.(2011)Gabor, Davé, Oppenheimer, Finlator, Gabor et al. 2011]).
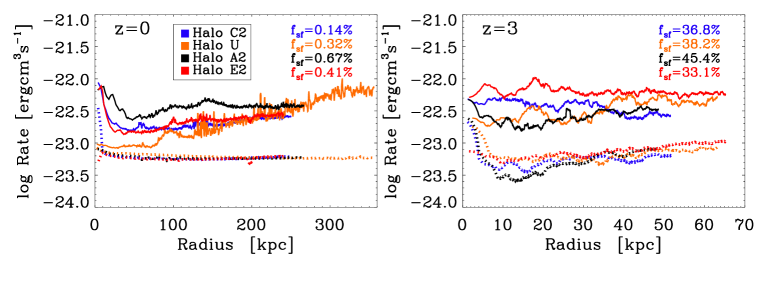
The late assembly of our simulated galaxies is dominated by dry minor merging building up the accreted stellar component. The infalling satellite galaxies captured through dynamical friction will cause gaseous wakes from which energy is transferred to the surrounding gas. Collectively together with the heating caused by supersonic collisions and shocks caused by infalling cold gas this process is deemed gravitational heating. In Fig. 1 we compare the shock-induced heating rates of the diffuse non-starforming gas with the corresponding cooling rates. The heating rates dominate over the cooling rates at all redshifts with the more massive galaxies (U,A2) showing higher heating rates than the slightly lower mass galaxies (C2,E2), as expected by the scaling of the gravitational feedback energy, , where is the circular velocity of the galaxy ([Johansson et al.(2009b)Johansson, Naab, & Ostriker, Johansson et al. 2009b]). The inclusion of gravitational heating helps in maintaining a hot gaseous halo and thus inhibits star formation contributing to the observed galaxy bimodality. However, gravitational heating is predominantly important in the outer parts of galaxies and some form of additional feedback, most probably AGN feedback (e.g. [Johansson et al.(2009a)Johansson, Naab, & Burkert, Johansson et al. 2009a]), is required to stop late central star formation in very massive galaxies (e.g. galaxy U at ).
3 Downsizing of massive galaxies
Several recent observations have shown that old, massive red metal-rich galaxies were already in place at high redshifts of . This observational result can be seen as a manifestation of cosmic downsizing, in which galaxies seem to form anti-hierarchically in the sense that the most massive galaxies formed a significant proportion of their stars at high redshifts, compared to lower mass systems that exhibit a more continuous star formation history throughout the cosmic epoch (e.g. [Glazebrook et al.(2004)Glazebrook, Abraham, McCarthy, Savaglio, Chen, Crampton, Murowinski, Jørgensen, Roth, Hook, Marzke, & Carlberg, Glazebrook et al. 2004]).
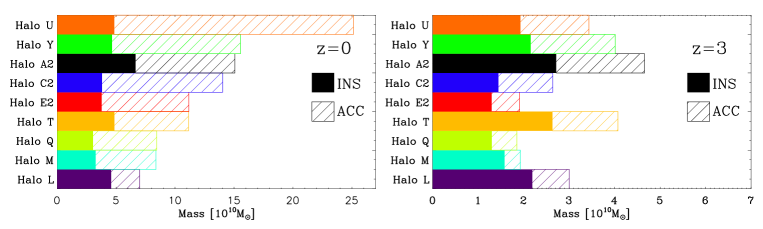
In Fig. 2 we show the assembly histories of all our simulated galaxies depicting separately the masses in the in-situ formed and accreted stellar components. At the stellar components in all galaxies have been assembled rapidly through mainly in situ star formation, fueled by cold gas flows and hierarchical mergers of multiple star-bursting subunits. At lower redshifts the subsequent growth of the stellar component proceeds predominantly through the accretion of existing stellar clumps. The galaxies in Fig. 2 are ordered in decreasing final stellar mass from top to bottom and we can immediately see that the fraction of accreted stars at increases as a function of galaxy mass. The accreted stellar component forms on average in low mass galaxies very early in the Universe. However, the accreted stellar component is added to the massive galaxies much later and at lower redshifts than the in situ formed stars. In addition, the metallicity of the central in situ formed stars is on average higher than the metallicity of the accreted stars that are formed in lower mass galaxies and added later to the outskirts of galaxies, resulting in a negative metallicity gradient, in agreement with the observations. Thus, the counter-intuitive concept of downsizing can be explained in the two phased formation mechanism. Massive galaxies form their central stellar mass in situ and then accrete substantial amounts of stars that were formed even earlier in smaller subsystems. Hence by the most massive galaxies have the oldest stellar populations compared to lower mass galaxies that are still forming in situ stars.
4 Kinematic properties of massive galaxies
Observations in the late 1980s using slit spectroscopy found that the ETG population can be broadly separated into a population of massive slowly-rotating systems with boxy isophotes and a population of fast-rotating ETGs with more disky isophotes found typically at somewhat lower masses. Recent results from the volume limited ATLAS3D survey utilizing a modern integral-field-unit (IFU) confirmed this dichotomy showing that about of local ETGs rotate slowly with no indications of an embedded disk component, whereas the majority () of the local ETGs show significant disk-like rotation ([Cappellari et al.(2011)Cappellari, Emsellem, Krajnović, McDermid, Scott, Verdoes Kleijn, Young, Alatalo, Bacon, Blitz, Bois, Bournaud, Bureau, Davies, Davis, de Zeeuw, Duc, Khochfar, Kuntschner, Lablanche, Morganti, Naab, Oosterloo, Sarzi, Serra, & Weijmans, Cappellari et al. 2011]).
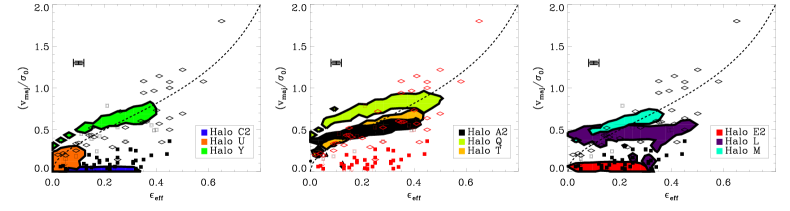
We derive the kinematic properties of our simulated galaxies using 500 random projections in order to assess the mean properties of the simulated galaxies averaged over all sightlines. In Fig. 3 we plot the 95% probability of finding a simulated galaxy in the plane, where measures the effective ellipticity of the galaxies and the ratio of the major axis rotation and velocity dispersion is a measure of the rotational support of the galaxies. Galaxies U,C,E2 show projections with very low rotational support, whereas the other galaxies (Y,A2,Q,T,L,M) show significantly more rotational support in very good agreement with the theoretical prediction for an oblate isotropic rotator shown by the dashed line in Fig. 3. The most massive galaxy U shows mostly round projections with very low , whereas all the other galaxies show projections extending in from zero up to 0.4. We see a correlation between the rotational support and the in situ/accreted fraction, both galaxies U,C that have a large accreted fraction are slowly rotating and galaxy Y would most probably also been slowly rotating if it had not experienced a late major merger. Thus, within our rather narrow mass range the majority of the simulated galaxies are consistent with being rotationally supported disky ellipticals, whereas the most massive galaxy in our sample is consistent with being a roundish slow-rotator.
References
- [Bender et al.(1994)Bender, Saglia, & Gerhard] Bender, R., Saglia, R. P., & Gerhard, O. E. 1994, MNRAS, 269, 785
- [Bezanson et al.(2009)Bezanson, van Dokkum, Tal, Marchesini, Kriek, Franx, & Coppi] Bezanson, R., van Dokkum, P. G., Tal, T., et al. 2009, ApJ, 697, 1290
- [Cappellari et al.(2011)Cappellari, Emsellem, Krajnović, McDermid, Scott, Verdoes Kleijn, Young, Alatalo, Bacon, Blitz, Bois, Bournaud, Bureau, Davies, Davis, de Zeeuw, Duc, Khochfar, Kuntschner, Lablanche, Morganti, Naab, Oosterloo, Sarzi, Serra, & Weijmans] Cappellari, M., Emsellem, E., Krajnović, D., et al., 2011, MNRAS, 413, 813
- [Dekel & Birnboim(2006)] Dekel, A. & Birnboim, Y. 2006, MNRAS, 368, 2
- [Gabor et al.(2011)Gabor, Davé, Oppenheimer, Finlator] Gabor, J. M., Davé, R., Oppenheimer, B. D., Finlator, K., 2011, MNRAS, 417, 2676
- [Glazebrook et al.(2004)Glazebrook, Abraham, McCarthy, Savaglio, Chen, Crampton, Murowinski, Jørgensen, Roth, Hook, Marzke, & Carlberg] Glazebrook, K., Abraham, R. G., McCarthy, P. J., et al. 2004, Nature, 430, 181
- [Johansson et al.(2009a)Johansson, Naab, & Burkert] Johansson, P. H., Naab, T., & Burkert, A. 2009a, ApJ, 690, 802
- [Johansson et al.(2009b)Johansson, Naab, & Ostriker] Johansson, P. H., Naab, T., & Ostriker, J. P. 2009b, ApJL, 697, L38
- [Johansson et al.(2012)Johansson, Naab, & Ostriker] Johansson, P. H., Naab, T., & Ostriker, J. P. 2012, ApJ, 754, 115
- [Lackner et al.(2012)Lackner, Cen, Ostriker, & Joung] Lackner, C. N., Cen, R., Ostriker, J. P., & Joung, M. R., 2012 MNRAS, 425, 641
- [Naab et al.(2007)Naab, Johansson, Ostriker, & Efstathiou] Naab, T., Johansson, P. H., Ostriker, J. P., & Efstathiou, G. 2007, ApJ, 658, 710
- [Naab et al.(2009)Naab, Johansson, & Ostriker] Naab, T., Johansson, P. H., & Ostriker, J. P. 2009, ApJL, 699, L178
- [Oser et al.(2010)Oser, Ostriker, Naab, Johansson, & Burkert] Oser, L., Ostriker, J. P., Naab, T., Johansson, P. H., & Burkert, A. 2010, ApJ, 725, 2312
- [Oser et al.(2012)Oser, Naab, Ostriker, & Johansson] Oser, L., Naab, T., Ostriker, J. P., & Johansson, P. H. 2012, ApJ, 744, 63
- [Springel(2005)] Springel, V. 2005, MNRAS, 364, 1105