Disc Clearing of Young Stellar Objects: Evidence for Fast Inside-out Dispersal
Abstract
The time-scale over which and the modality by which young stellar objects (YSOs) disperse their circumstellar discs dramatically influences the eventual formation and evolution of planetary systems. By means of extensive radiative transfer (RT) modelling, we have developed a new set of diagnostic diagrams in the infrared colour-colour plane (K - [24] vs. K - [8]), to aid with the classification of the evolutionary stage of YSOs from photometric observations. Our diagrams allow the differentiation of sources with unevolved (primordial) discs from those evolving according to different clearing scenarios (e.g. homologous depletion vs. inside-out dispersal), as well as from sources that have already lost their disc. Classification of over 1500 sources in 15 nearby star-forming regions reveals that approximately 39 % of the sources lie in the primordial disc region, whereas between 31 % and 32 % disperse from the inside-out and up to 22 % of the sources have already lost their disc. Less than 2 % of the objects in our sample lie in the homogeneous draining regime. Time-scales for the transition phase are estimated to be typically a few years independent of stellar mass. Therefore, regardless of spectral type, we conclude that currently available infrared photometric surveys point to fast (of order 10 % of the global disc lifetime) inside-out clearing as the preferred mode of disc dispersal.
keywords:
protoplanetary discs - radiative transfer - disc evolution - homogeneous draining - accretion - accretion discs - circumstellar matter - planetary systems - stars - pre main-sequence1 Introduction
Protoplanetary discs are an unavoidable consequence of the star formation process and harbour the material from which planets may form. For this reason, it is essential to understand their properties, evolution and final dispersal. For a recent review on protoplanetary discs and their evolution see Williams & Cieza (2011).
The detection and characterisation of circumstellar discs was a primary goal of the ’Spitzer Space Telecope’ (Werner et al., 2004) and successfully featured in the Legacy Programme ’From Molecular Cores to Planet-Forming Dust’ (c2d; Evans et al. (2009)). Allen et al. (2004) compared the predicted colours of young stellar objects with the photometric data obtained with the ’Infrared Array Camera’ (IRAC; Fazio et al. (2004)). Transitional discs in different young clusters and associations were identified and classified by Muzerolle et al. (2010) by using IRAC data and the 24 m-fluxes obtained with MIPS (Rieke et al., 2004). Furlan et al. (2009)investigated the disc evolution in the three prominent star-forming regions Taurus, Ophiuchus, and Cha I and found similar transitional disc fractions in all three regions. This study is based on spectroscopic data taken with the ’Spitzer Infrared Spectrograph’ (Houck et al., 2004). A spectroscopic study of the young stellar objects in Taurus has been published by Furlan et al. (2011). The mid-infrared variability of (pre-)transitional disks was investigated with Spitzer (e.g. Espaillat et al. (2011)).
The interpretation of infrared colours in relation to the evolutionary state of a disc is, however, far from being trivial. This is particularly true with regards to the classification of transition discs, the latter being intended as objects caught in the act of dispersal, i. e. going from disc-bearing to disc-less stars. The modality and time-scales of disc dispersal are especially relevant to the planet formation process. In particular, inside-out dispersal from internal photoevaporation (e.g. Clarke et al. (2001); Alexander et al. (2006a, b); Owen et al. (2010, 2011a, 2011b, 2012); Gorti et al. (2009)) could also provide a mechanism to stop migration and effectively ’park’ planets at a particular location in a disc (e.g. Alexander & Armitage (2009)).
The evolution of the dust component in a disc is mirrored by the evolution of colours in the infrared plane. By means of radiative transfer modelling, Ercolano, Clarke, & Hall (2011, henceforth ECH11) identified the regions in the K - [8] vs. K - [24] plane where primordial discs, discs with inner-holes (i. e. presumably being dispersed from the inside-out) and discs which lose mass homogeneously at all radii, are expected to be found. Their study, which was limited to M-stars, showed that in the case of the cluster IC348, most discs disperse from the inside-out and undergo the transition on a short time-scale, as predicted by standard photoionisation models.
These conclusions are in contrast with the conclusions of Currie & Kenyon (2009), who claimed instead a large number of ’homogeneously depleting’ discs, for the same cluster. Such discrepancies highlight the need for detailed modelling in the interpretation of IR colours of discs.
The study of ECH11 was restricted to M-stars in only one cluster, which prevented the authors from being able to make a more general statement with regards to disc dispersal.
In this study we significantly improve on the work of ECH11 by performing further RT calculation to evaluate evolutionary tracks in the IR colour plane for stars of different spectral types. We then apply our results to the photometric data of 15 nearby star-forming regions, that we collected from the literature, in order to address the question of what is the preferred mode of disc dispersal.
In Section 2 we describe our methods and the results from our radiative transfer calculations and present new evolutionary diagnostic diagrams. In Section 3 the collected observational data are briefly described and analysed using the diagrams presented in the previous section. A short summary and conclusions are given in Section 4.
2 Theoretical Investigation
Emission in a given wavelength band is produced by dust grains of given temperatures and sizes. The temperature of grains in a disc for a given central star temperature is determined roughly by the grain location within the disc and by the intervening material. Changes in the distribution of material within a disc are therefore reflected in its emergent continuous spectral energy distribution (SED). On this basis, the evolution of infrared colours of an object can be used to trace the evolution of its dust density distribution. We extended the work of ECH11 and calculate theoretical evolutionary tracks in the K - [8] vs. K - [24] plane by means of radiative transfer calculations for discs of different geometry and different evolutionary stage surrounding stars of different spectral types.
2.1 Modes of Disc Dispersal
We consider three modes of disc dispersal: (i) homogeneous draining (HD), (ii) inside-out clearing (IOC) and (iii) outside-in clearing (OIC). The expected tracks in the infrared two-colour plane are sketched in Figure 1.
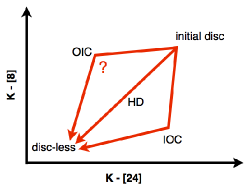
2.1.1 Homogeneous draining
HD refers to a disc whose surface density decreases homogeneously at all radii as a function of time, such that the surface density distribution is self-similar at all times. Such a mode of dispersal would be expected if viscous draining were to act alone, undisturbed until all of the disc material is accreted onto the central object. In this case the total mass of the disc evolves roughly as (Hartmann et al., 1998). In this scenario one would expect discs to evolve diagonally on the K - [8] vs. K - [24] plane (see Figure 1) as both the 8 m and the 24 m band fluxes decrease roughly at the same rate as material is removed homogeneously at all radii.
2.1.2 Inside-out clearing
IOC refers to discs that disperse via the formation of an inner-hole (classical transition discs), which becomes larger and larger until all material is removed. There is currently a healthy debate in the literature with regards to possible mechanisms that may be responsible for the formation of discs with inner-holes, of which a large variety is observed. Some of these mechanisms include photoevaporation by the central object (e.g. Alexander et al. (2006a, b); Owen et al. (2010, 2011a)), planet formation (e.g. Zhu et al. (2011)), grain growth (e.g. Dullemond & Dominik (2005)), close-binary effects (e.g. Ireland & Kraus (2008)) and external photoevaporation by nearby high-mass stars (e.g. Scally & Clarke 2001). The picture that seems to be currently emerging is that of multiple populations of inner-hole objects, some of which may or may not represent objects in transition (e.g. Owen et al. (2012); Owen & Clarke (2012)). It is beyond the scope of this work to explore these different possibilities; here we will limit ourselves to calculating SEDs of discs, which, by whatever mechanism, develop increasingly larger inner-holes. The IOC tracks are expected to proceed in a left-facing ’L’-shape (see Figure 1) as the warmer material in the inner disc is removed first, causing a drop in the 8 m flux, and the cooler material, responsible for most of the 24 m emission, is removed afterwards.
2.1.3 Outside-in clearing
OIC refers to discs that are eroded from the outside-in by a companion star (e.g. Bouwman et al. (2006); Monin et al. (2007); Cieza et al. (2009)) or by radiation from external sources. External photo-evaporation is for example observed in the case of proplyds in the Orion Nebular Cluster (e.g. Ricci et al. (2008); McCaughrean & O’Dell (1996); Scally & Clarke (2001)). Whether the entire mass of a disc can be dispersed via this mechanism remains, however, very uncertain. It is also uncertain what percentage of discs in OB associations and clusters are exposed to strong enough radiation from nearby massive stars for this process to be significant. In any case, it is an interesting exercise here to explore the evolutionary tracks for such a population on the infrared colour-colour plane. One would naively expect an upside-down ’L’-shape this time, almost a mirror-image of the IOC tracks (see Figure 1), as the 24 m flux should drop before the 8 m flux. This is, however, not necessarily the case, as will be discussed in Section 2.3.1.
2.2 Numerical Set-up
We use the 2-dimensional Monte Carlo dust radiative transfer code of Whitney et al. (2003a, b), which is routinely applied to the modelling of the SEDs of protoplanetary discs (e. g. Robitaille et al. (2006, 2007), ECH11). We derive evolutionary tracks for stars of spectral types K4, K8.5, M4.5 and M8, using the stellar atmosphere models (Castelli & Kurucz (2004); Brott & Hauschildt (2005)) from the library used by Robitaille et al. (2006) and available online at http://caravan.astro.wisc.edu/protostars/. Table 1 summarises the stellar parameters and provides indices for the atmosphere files used. Table 2 lists the other input parameters used in the 1287 radiative transfer models. A detailed description of the geometrical set-up and the input parameters is given in Robitaille et al. (2006).
| index | SpT | |||
|---|---|---|---|---|
| 3013427 | K4 | 4590 | ||
| 3014686 | K8.5 | 4060 | ||
| 3002746 | M4.5 | 3305 | ||
| 3014449 | M8 | 2805 |
(see also Whitney et al. (2003a, b) and Robitaille et al. (2006)
for a detailed description).
| parameter | range | sequence |
|---|---|---|
| initial, IOC, OIC | ||
| HD | ||
| initial, IOC, HD | ||
| OIC | ||
| 111sublimation radius | initial, OIC, HD | |
| IOC 222razor-thin | ||
| IOC 333finite thickness | ||
| 444disc scale-height, see also Table 3 | 0.0001 - 1.0 | initial, IOC, OIC, HD |
| 555disc density exponent () | initial, IOC, OIC, HD | |
| 666disc scale height exponent (); see also Table 3 | initial, IOC, OIC, HD | |
| 777effectively no viscous heating | initial, IOC, OIC, HD | |
| Mass infall rate888effectively no envelope | initial, IOC, OIC, HD | |
| Aperture | 100000 AU | initial, IOC, OIC, HD |
2.3 Results
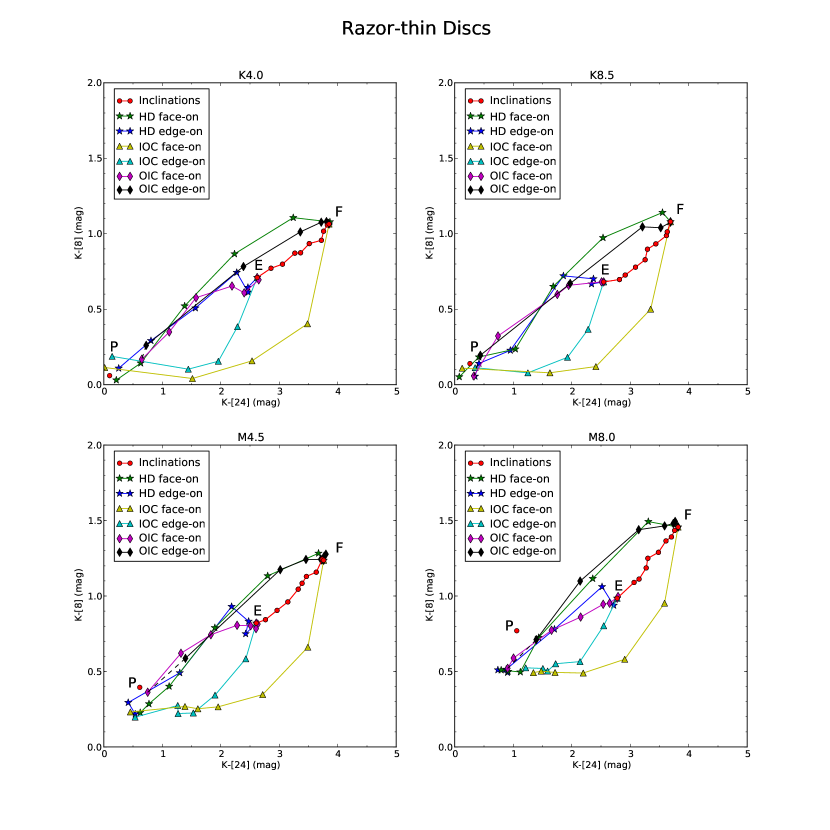
2.3.1 Razor-thin discs
Figure 2 summarises the tracks for razor-thin discs in the four spectral type intervals considered here. Point F are face-on () and point E are edge-on () disc inclinations. The points between the F and E represent intermediate disc inclinations in steps of . Point P shows the approximate location of disc-less objects. The stars mark the HD tracks for face-on and edge-on inclinations (green and blue lines, respectively). The triangles mark the IOC tracks for face-on and edge-on inclinations (yellow and cyan lines, respectively). The diamonds mark the OIC tracks for face-on and edge-on inclinations (black and purple lines, respectively).
As expected (discussed in Section 2.1.1 and sketched in Figure 1), the HD tracks follow a diagonal trajectory from points F and E to P, while the IOC tracks show the typical left-facing ’L’-shape also reported by ECH11 for M-star models. The OIC tracks in Figure 2, however, do not show the upside-down ’L’-shape suggested by our simple-minded thought experiment (see Section 2.1.3). This is because the 24 m emission is not dominated by material at large radii in the disc, but contains a significant contribution from material in the inner disc that is located deeper inside and is hence cooler.
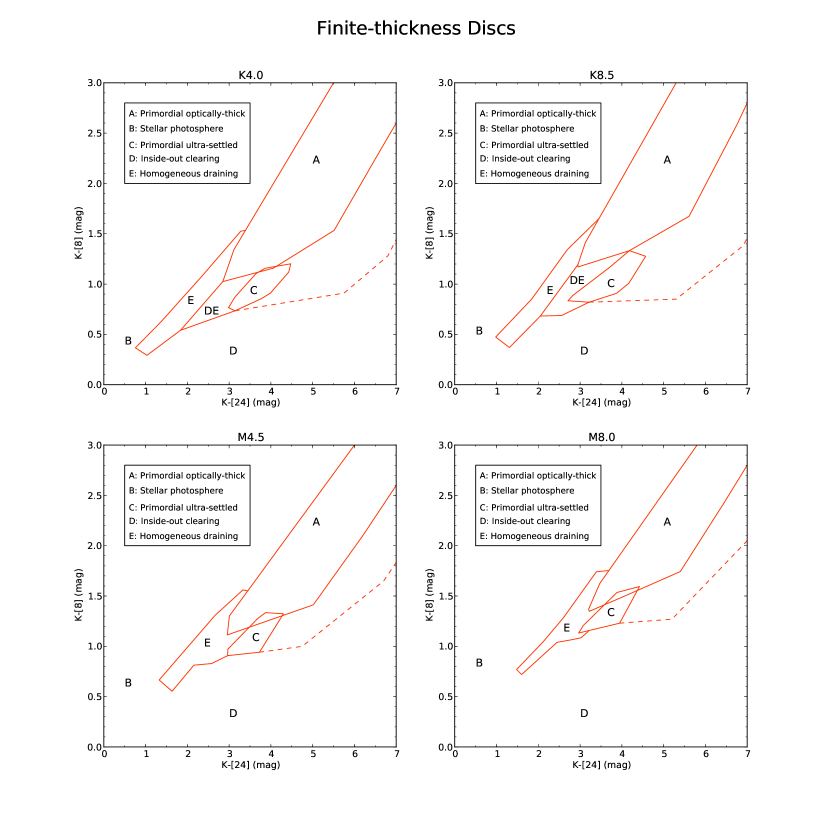
2.3.2 Discs with finite-thickness
| flaring | mixing | |||||||
| disc kind | B | 999constant opening angle | 101010flared | 111111strongly flared | 121212strongly settled | 131313settled | 141414mixed | |
| razor-thin | x | x | ||||||
| ultra-settled | x | x | ||||||
| optically thick | x | x | ||||||
| x | x | |||||||
| ultra-settled | x | x | ||||||
| optically thick | x | x | ||||||
| x | x | |||||||
| ultra-settled | x | x | ||||||
| optically thick | x | x | ||||||
| x | x | |||||||
We follow ECH11 and set-up discs of finite-thickness and nine different geometries; we extend, however, the work of ECH11 to all the spectral types considered here. The resulting infrared colours are plotted in Figure 3 for all cases where disc extinction mag. The parameter set-up is summarised in Table 3.
We explore three different cases of dust settling (by varying the parameter ) and three different levels of flaring, in order to cover the parameter space occupied by primordial discs of different geometries. Discs with are named ’primordial ultra-settled’, while those with a larger are named ’primordial optically-thick’ discs. We note that also influences the inner wall height, which may be the main source of variation of the NIR/ MIR colours.
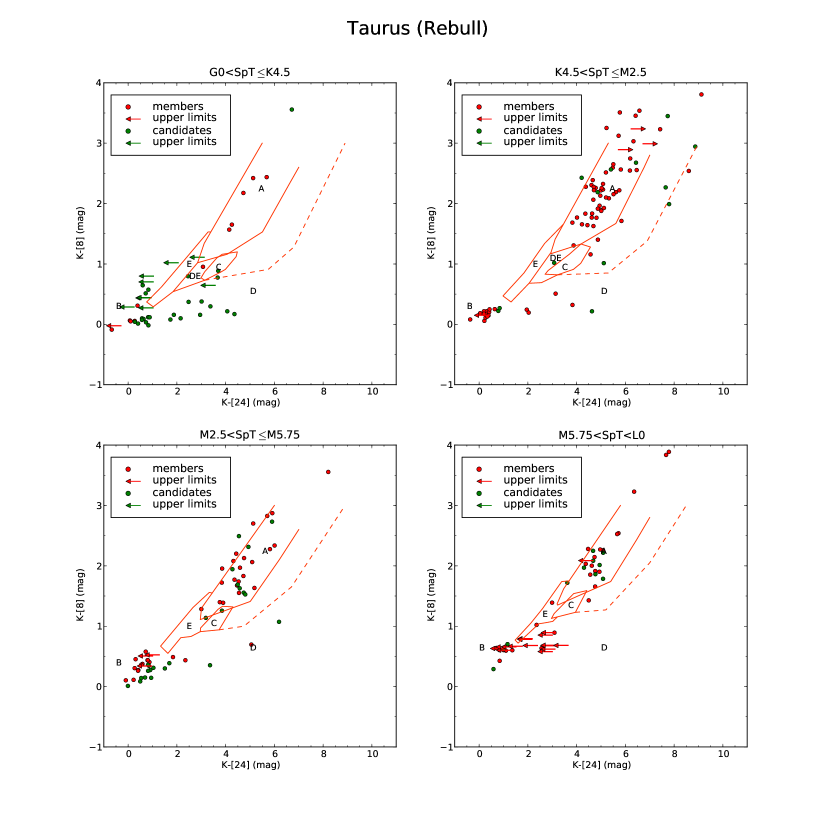
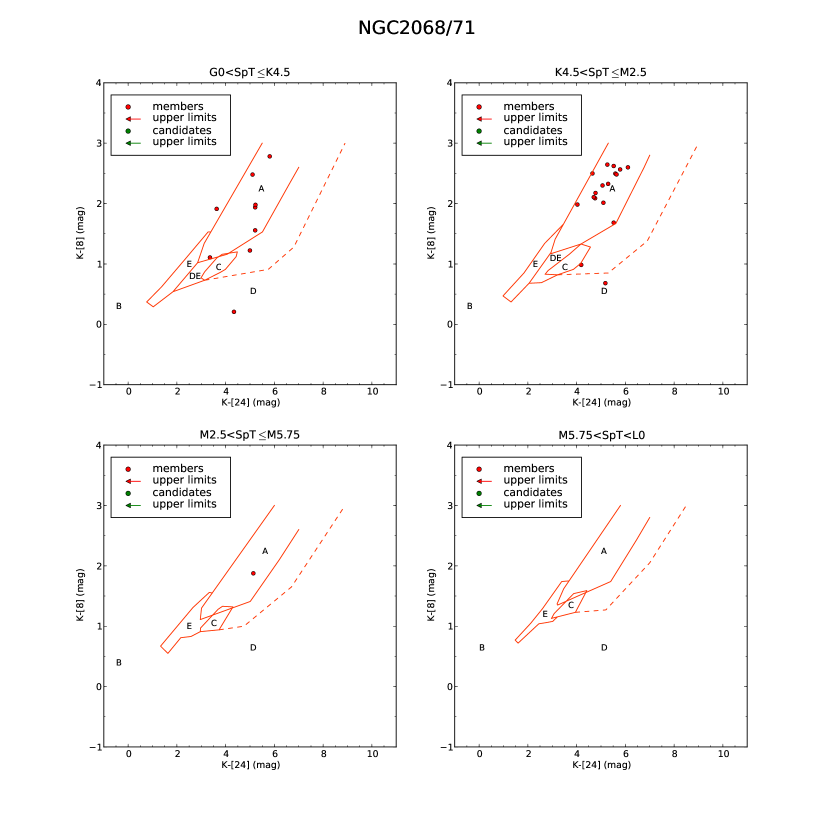
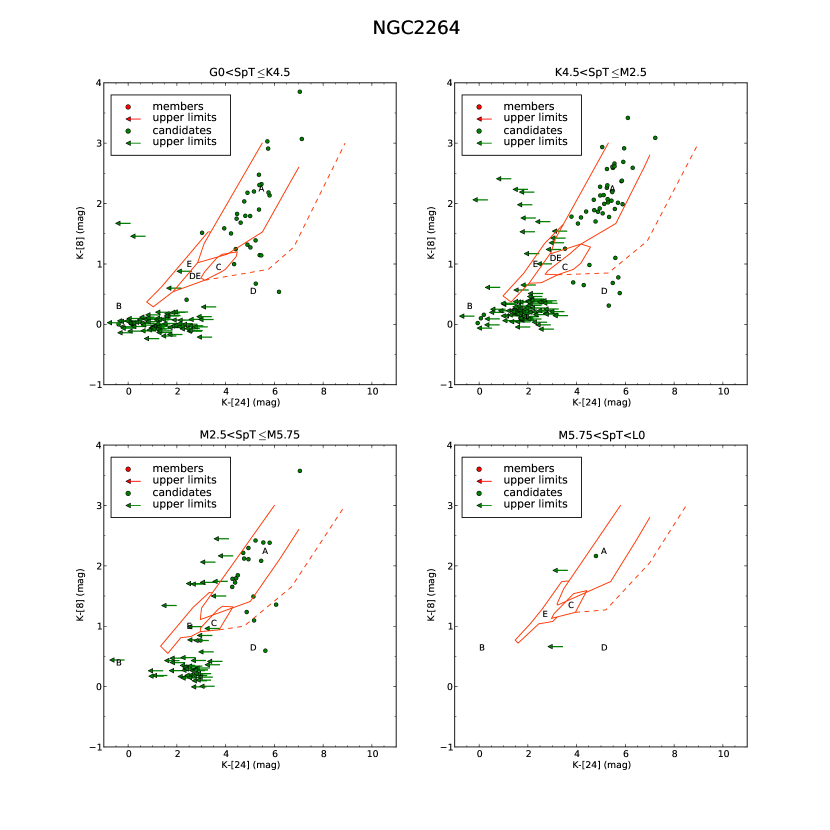
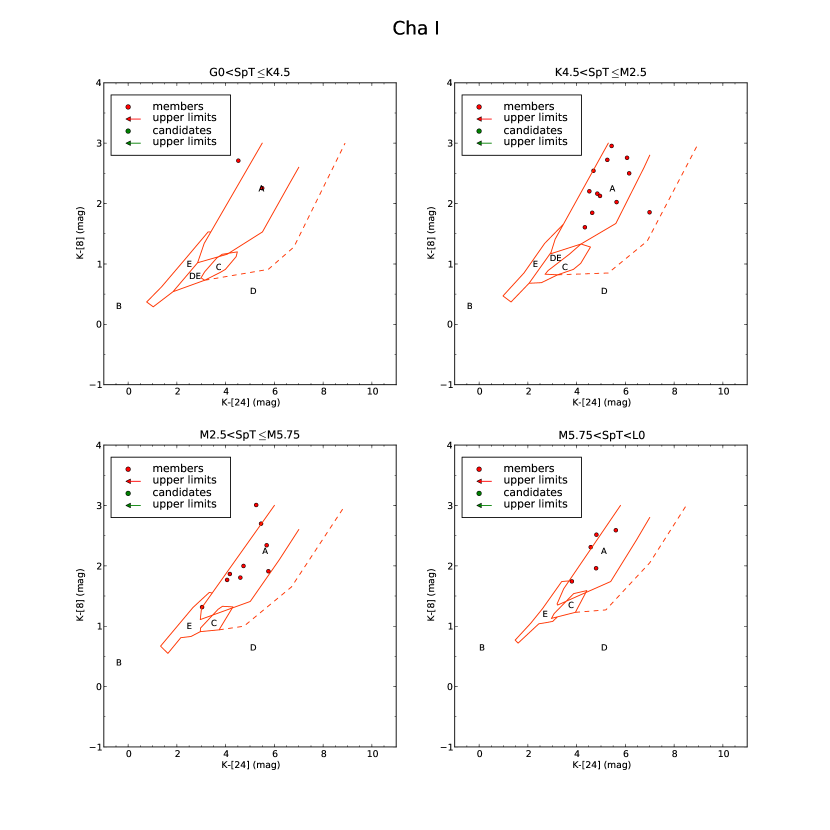
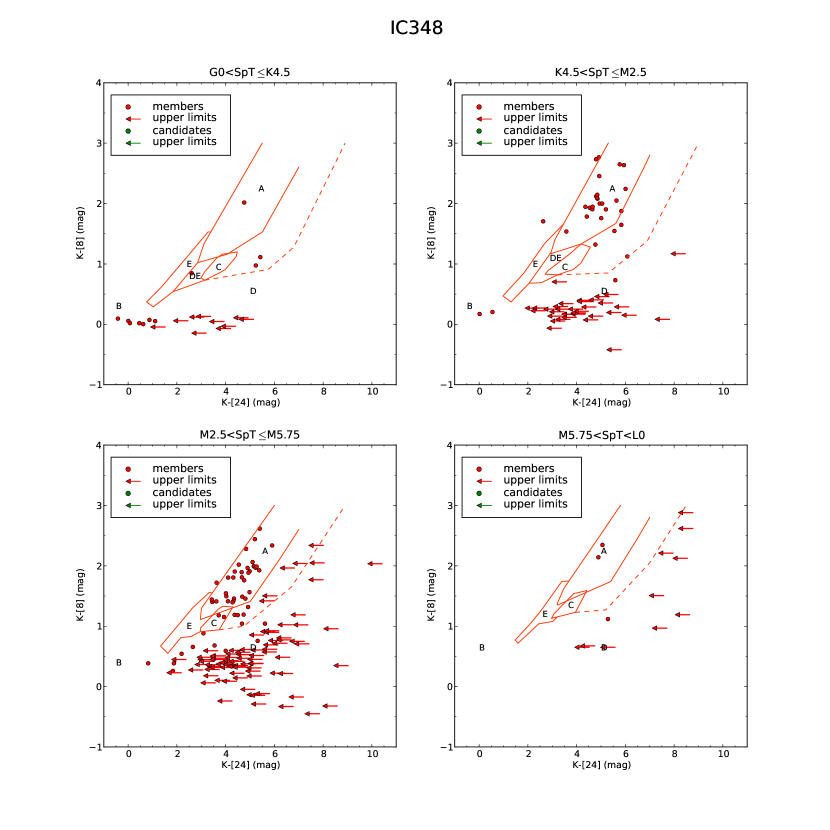
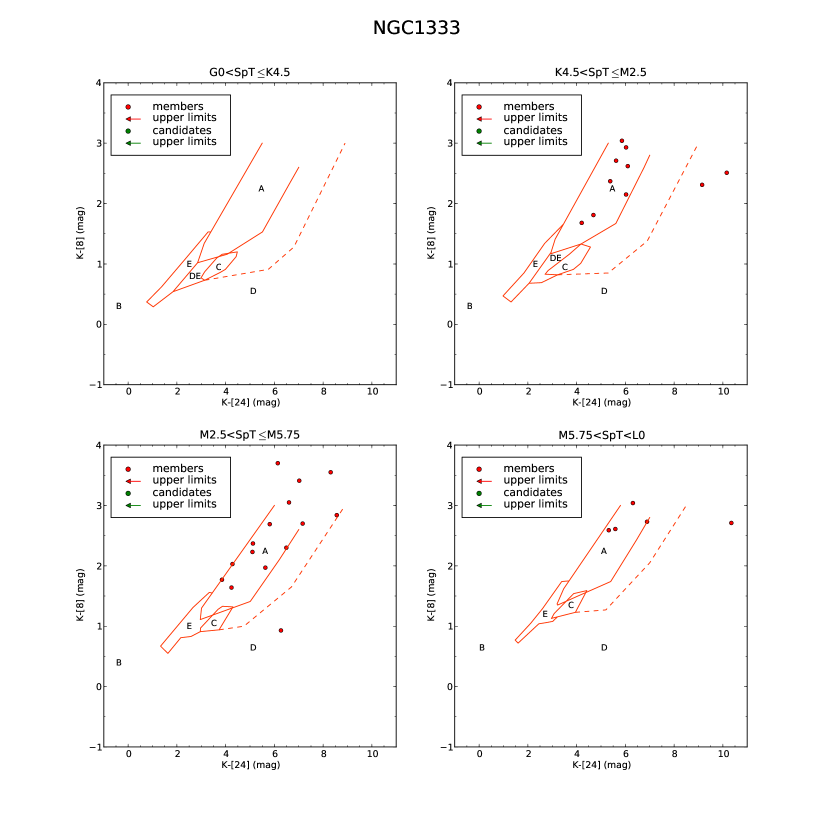
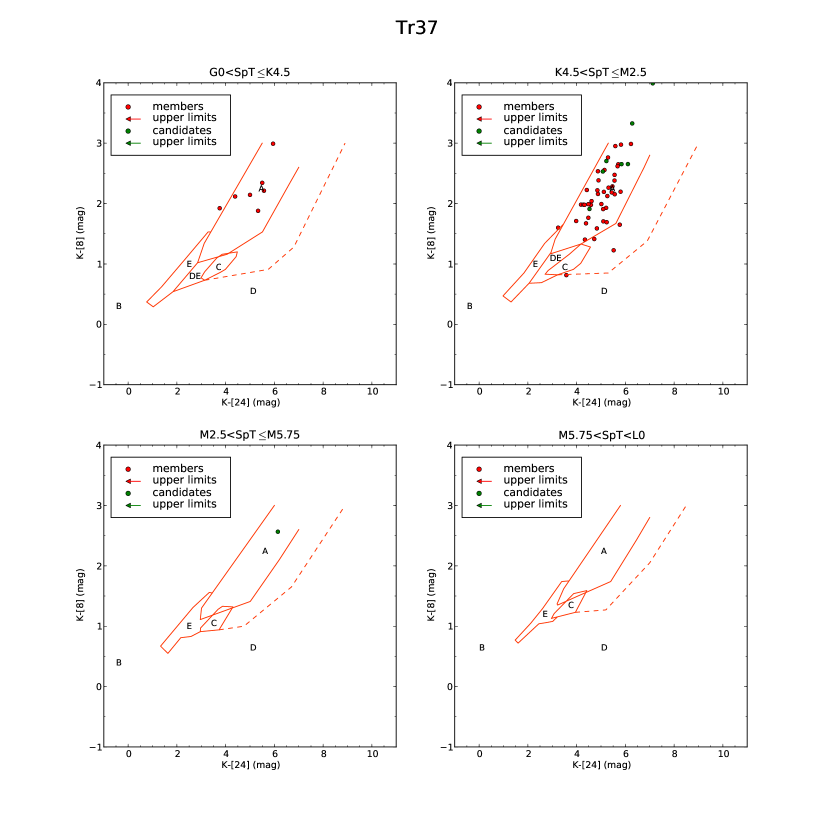
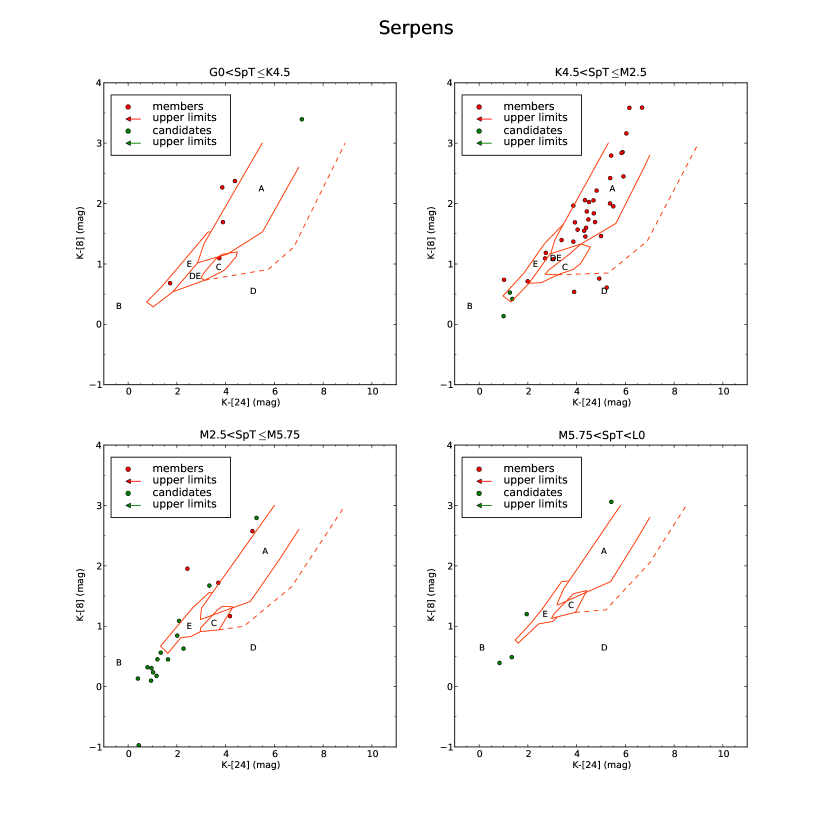
By inspection of the locus occupied by the evolutionary tracks of primordial (ultra-settled and optically-thick) discs, we define boundary boxes in the two-colour plane. Our results are summarised in Figure 3. As for the razor-thin case, we carried out radiative transfer calculations to track the colour evolution of each of our primordial (ultra-settled or optically-thick) discs as they disperse via HD and IOC, allowing us to further identify the expected locus of objects in such evolutionary stages. For the sake of clarity, the tracks are not plotted in Figure 3, where only the derived boundary boxes are shown. In particular the boxes are labelled as A, B, C, D, E for ’primordial optically-thick’ discs, disc-less sources, ’primordial ultra-settled’ discs, IOC and HD respectively. Due to the overlap in the evolving discs regimes D and E, we cannot discriminate between HD and IOC for those objects observed in DE. As will be shown later, however, only a very small minority of the observational sample lies in this regime.
Additionally, we run a set of models to allow us to constrain the locus of envelope objects and estimate the contamination of the IOC objects by this sample. We set up 576 objects with envelopes (see Whitney et al. (2003a)) for a selection of cavity angles ( to ) and envelope infall rates ( to ). Objects with envelopes and high infall rates show the greatest overlap with the IOC region, whereas objects with less infall are bluer. We have indicated the locus of these models with a dashed line in Figure 3 above which envelope objects lie. By comparing with observational data (see Section 3), we found, that primordial discs with envelopes might introduce a contamination in the IOC statistics of at most 10 %. This bias has to be kept in mind when considering the raw statistics of the upcoming section. The boundary points of each box are listed in Appendix A.
3 Analysis and Discussion
Our classification scheme, based on the radiative transfer modelling described in Section 2.2, allows us to use currently available infrared photometric surveys from nearby star-forming regions in order to address the question of what is the preferential mode of disc dispersal. We have collected K-band, 8 m and 24 m band data, as well as spectral types and extinction measurements of YSOs in 15 nearby star-forming regions. Table 4 lists the references for the data and summarises some of the physical properties of the regions.
| region | age [Myr] | distance [pc] | JHK | [8] | [24] | SpT | ||
| TaurusL | 211 | 1111Luhman (2004),222Luhman et al. (2010),333Reipurth, B. (2008a) | 140444Kenyon et al. (1994) | 555Cutri et al. (2003) | 222Luhman et al. (2010) | 222Luhman et al. (2010) | 666Luhman et al. (2009) | 222Luhman et al. (2010),666Luhman et al. (2009) |
| TaurusR | 257 | 1111Luhman (2004),222Luhman et al. (2010),333Reipurth, B. (2008a) | 137777Torres et al. (2007) | 555Cutri et al. (2003) | 888Rebull et al. (2010) | 888Rebull et al. (2010) | 888Rebull et al. (2010) | 888Rebull et al. (2010) |
| NGC2068/71 | 27 | 2999Flaherty & Muzerolle (2008) | 400999Flaherty & Muzerolle (2008) | 999Flaherty & Muzerolle (2008) | 999Flaherty & Muzerolle (2008) | 999Flaherty & Muzerolle (2008) | 999Flaherty & Muzerolle (2008) | 999Flaherty & Muzerolle (2008) |
| NGC2264 | 313 | 2101010Teixeira (2008) | 760-913111111Sung et al. (1997),121212Baxter et al. (2009) | 131313Teixeira et al. (2012) | 131313Teixeira et al. (2012) | 131313Teixeira et al. (2012) | 131313Teixeira et al. (2012) | 131313Teixeira et al. (2012) |
| ChaI | 29 | 2-3222Luhman et al. (2010),141414Currie et al. (2009),151515Whittet et al. (1997) | 162151515Whittet et al. (1997) | 161616Gutermuth et al. (2009) | 161616Gutermuth et al. (2009) | 161616Gutermuth et al. (2009) | 171717Luhman (2007) | 171717Luhman (2007) |
| IC348 | 240 | 2-3181818Herbig (1998),191919Muench et al. (2003),202020Luhman et al. (2003) | 216-340181818Herbig (1998),202020Luhman et al. (2003),212121Currie & Kenyon (2009),222222Herbst (2008),232323Scholz et al. (1999),242424Cernis (1993) | 212121Currie & Kenyon (2009) | 212121Currie & Kenyon (2009) | 212121Currie & Kenyon (2009) | 212121Currie & Kenyon (2009) | 212121Currie & Kenyon (2009) |
| NGC1333 | 39 | 3252525Winston et al. (2009) | 260262626Hirota et al. (2008) | 161616Gutermuth et al. (2009),252525Winston et al. (2009) | 161616Gutermuth et al. (2009),252525Winston et al. (2009) | 161616Gutermuth et al. (2009),252525Winston et al. (2009) | - | 252525Winston et al. (2009) |
| Tr37 | 57 | 4272727Sicilia-Aguilar et al. (2004),282828Sicilia-Aguilar et al. (2005),292929Sicilia-Aguilar et al. (2006) | 900303030Contreras et al. (2002) | 282828Sicilia-Aguilar et al. (2005) | 292929Sicilia-Aguilar et al. (2006) | 292929Sicilia-Aguilar et al. (2006) | 282828Sicilia-Aguilar et al. (2005) | 282828Sicilia-Aguilar et al. (2005) |
| Serpens | 69 | 2-6313131Oliveira et al. (2009) | 260-415323232Straižys et al. (1996),333333Dzib et al. (2010) | 343434Evans et al. (2009) | 343434Evans et al. (2009) | 343434Evans et al. (2009) | 313131Oliveira et al. (2009) | 313131Oliveira et al. (2009) |
| LupIII | 82 | 2-6353535Reipurth, B. (2008b),363636Merín et al. (2008) | 200353535Reipurth, B. (2008b) | 343434Evans et al. (2009) | 343434Evans et al. (2009) | 343434Evans et al. (2009) | 363636Merín et al. (2008) | 363636Merín et al. (2008) |
| ChaII | 27 | 4-5373737Spezzi et al. (2008) | 178151515Whittet et al. (1997) | 343434Evans et al. (2009) | 343434Evans et al. (2009) | 343434Evans et al. (2009) | 373737Spezzi et al. (2008) | 373737Spezzi et al. (2008) |
| NGC2362 | 10 | 5383838Mayne & Naylor (2008) | 1480141414Currie et al. (2009) | 141414Currie et al. (2009) | 141414Currie et al. (2009) | 141414Currie et al. (2009) | 393939Dahm & Hillenbrand (2007) | 393939Dahm & Hillenbrand (2007) |
| OB1bf | 13 | 5404040Hernández et al. (2006) | 440414141Hernández et al. (2005) | 555Cutri et al. (2003) | 424242Hernández et al. (2007b) | 424242Hernández et al. (2007b) | - | 434343Hernández (2011) |
| UpperSco | 133 | 5444444Hernández et al. (2007a) | 145454545de Zeeuw et al. (1999) | 555Cutri et al. (2003) | 464646Carpenter et al. (2006) | 474747Carpenter et al. (2009) | 474747Carpenter et al. (2009) | 474747Carpenter et al. (2009) |
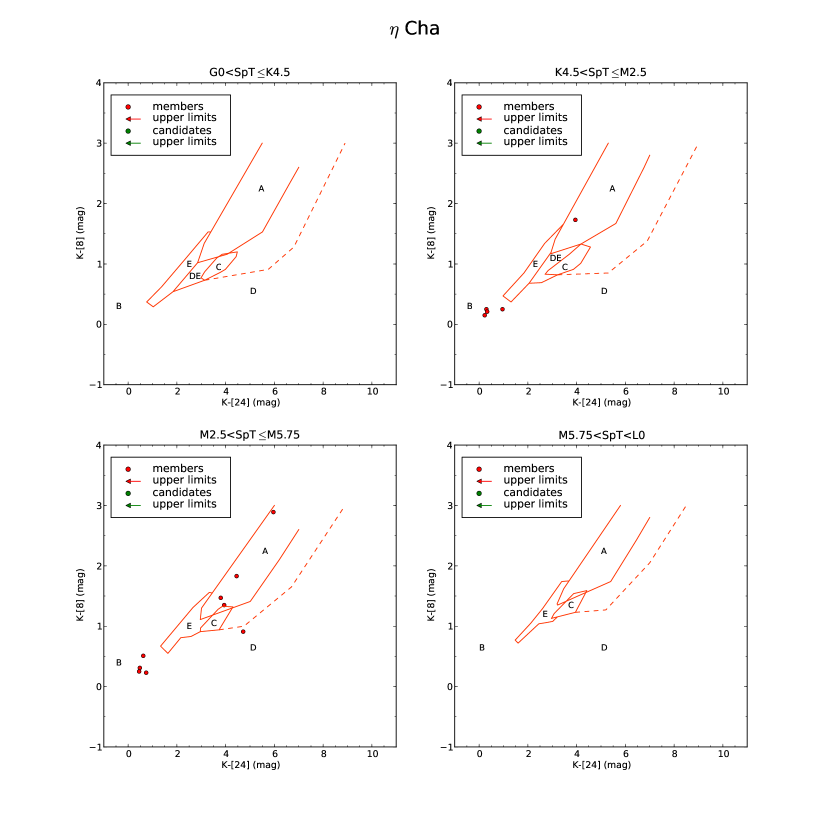
| Cha | 14 | 6484848Mamajek et al. (1999) | 100484848Mamajek et al. (1999) | 555Cutri et al. (2003) | 222Luhman et al. (2010) | 222Luhman et al. (2010) | 111Luhman (2004) | 494949Luhman & Steeghs (2004) |
| 25Ori | 8 | 7-10505050Briceño et al. (2007) | 330515151Briceño et al. (2005) | 555Cutri et al. (2003) | 424242Hernández et al. (2007b) | 424242Hernández et al. (2007b) | - | 434343Hernández (2011) |
We applied our colour-colour diagnostic diagrams to classify 1529 objects in 15 nearby star-forming regions. The number statistics in each evolutionary stage and for each spectral type regime are presented in Table 5. It is worth noticing here, that we deal in most cases with small number statistics; for this reason we provide actual numbers in Table 5 rather than percentages. In what follows, however, we prefer to use percentages in order to simplify the discussion. The standard statistical errors (e.g. ), however, should be kept in mind when considering the raw percentages given. Given the overlap between regions D (IOC) and E (HD), discussed in the previous section, we can only provide upper and lower limits to the count sources in these regimes.
In summary, 38.9 % of the objects out of the entire sample lie in the primordial disc region whereas between 31.3 % and 31.9 % disperse their discs from the inside-out and up to 21.7 % of the sources have already lost their disc. So, almost a third of the available sources are currently clearing their discs from the inside-out. Only between 1.5 % and 2.0 % of the objects lie in the homogeneous draining region E. We interpret this result as strong evidence against homogeneous disc depletion as the main disc dispersal mode.
Figures 4 to 19 show the results for individual star-forming regions, which are also briefly summarised in the next section. The regions are sorted by age.
3.1 Analysis
-
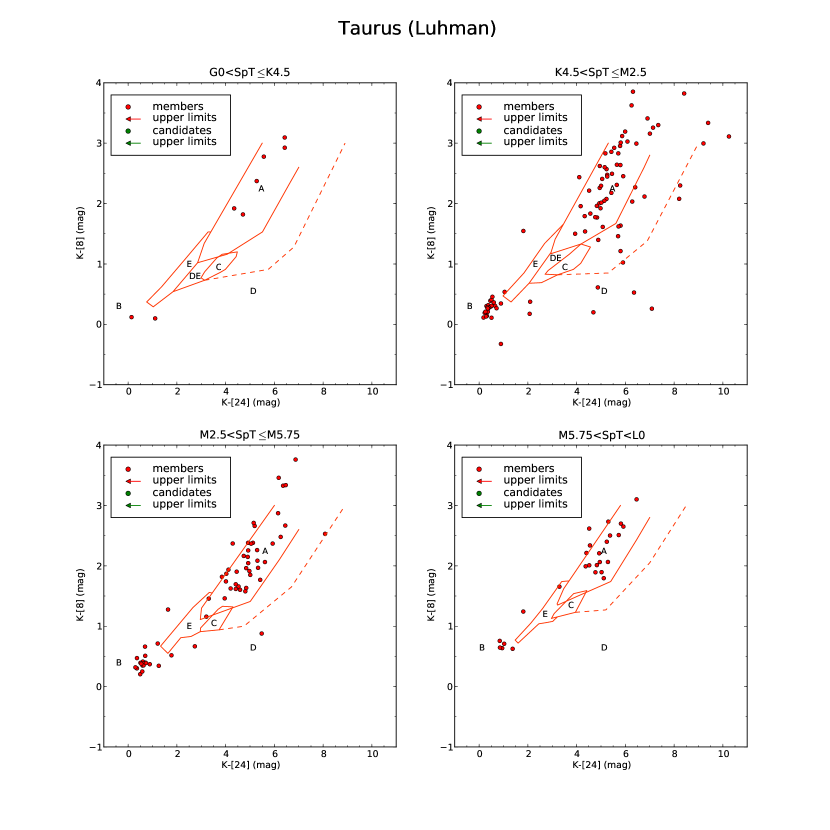
•
Taurus (Figure 4, 5)
For this 1 Myr (Luhman, 2004; Luhman et al., 2010; Reipurth, B., 2008a) old region we have collected data both from Luhman et al. (2010) and Rebull et al. (2010). The statistics differ when using the two compilations as detailed in what follows. 51.2 % and 41.6 % of the Luhman and the Rebull discs, respectively, are still primordial optically-thick. None of the Luhman objects are consistent with being primordial ultra-settled discs, while 0.8 % of the Rebull sources fall in this category. 23.2 % and 31.5 % of objects in the Luhman and Rebull compilations, respectively, have already lost their discs. Currently, 13.7 % of the Luhman sources are depleting their discs via the IOC, while between 17.9 % and 19.1 % of the Rebull objects are undergoing that process. Only one disc (0.5 %) of the Luhman objects and between 2.3 % and 3.5 % of the Rebull sources lie in HD region. In the Rebull case we also considered upper and lower limits in the 24 band as well as candidates by Rebull et al. (2010). - •
-
•
NGC2264 (Figure 7)
25.2 % of the discs of the 2 Myr (Teixeira et al., 2012) old cluster NGC2264 are still primordial optically-thick. 0.6 % are consistent with them being primordial ultra-settled discs. 9.9 % have dispersed already and between 56.2 % and 57.2 % are clearing via the IOC process. Only 0.3 % to 1.3 % of the discs are found at the edge of the HD regime. We include in this statistics also objects with only upper limit measurements in the 24 band. All the objects are classified as candidates by radial velocity studies by Fűrész et al. (2006). - •
-
•
IC348 (Figure 9)
23.8 % of the objects of the 2-3 Myr (Herbig, 1998; Muench et al., 2003; Luhman et al., 2003) old cluster IC348 are still primordial optically-thick. 0.8 % are consistent with being primordial ultra-settled discs. 3.8 % have dispersed already and between 69.6 % to 70.0 % are clearing via the IOC process. We include in these statistics also objects with only upper limit measurements in the 24 band. - •
-
•
Tr 37 (Figure 11)
In the 4 Myr (Sicilia-Aguilar et al., 2004, 2005, 2006) old star-forming region Tr 37 89.5 % of the discs are still primordial optically-thick. None of the objects have primordial ultra-settled discs or have depleted their discs already. 7.0 % are currently clearing via the IOC process. For Tr 37 no sources are found in the HD region. Note, that we also included YSO candidates in our statistics. -
•
Serpens (Figure 12)
For the 2-6 Myr (Oliveira et al., 2009) old cluster Serpens we have classified 40.6 % of the discs as primordial optically-thick and one disc (1.4 %) as primordial ultra-settled. 18.8 % of the objects have already lost their discs. Between seven (10.1 %) and eight (11.6 %) discs are undergoing IOC. Between seven (10.1 %) and eight (11.6 %) discs lie in the HD regime. Candidates are included in the statistics. 37.5 % of the objects in the HD box are classified as candidates by Oliveira et al. (2009). -
•
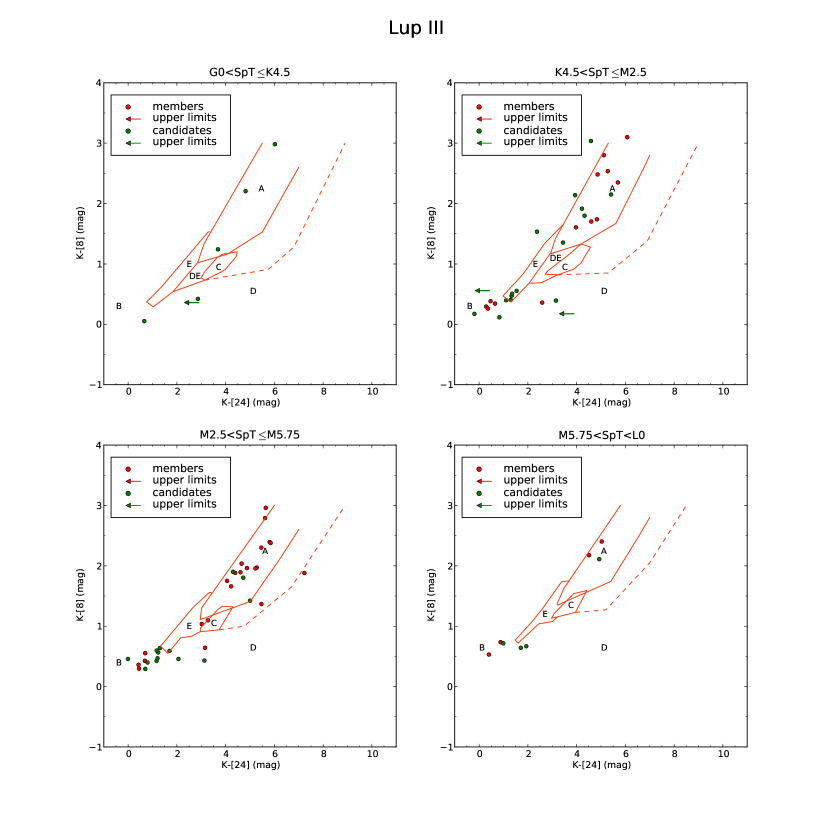
Lup III (Figure 13)
39.0 % of the discs in the 2-6 Myr (Reipurth, B., 2008b; Merín et al., 2008) old star-forming cluster Lup III are still primordial optically-thick. One disc (1.2 %) has been classified as primordial ultra-settled. 14.6 % of discs are undergoing IOC, while 31.7 % have already dispersed their discs. We also included YSO candidates and sources for which only upper limits in the 24 flux are available in our statistics. In Lup III 7.3 % of the discs are found at the photosphere edge of the HD regime. These sources are still classified as candidates by Merín et al. (2008). -
•
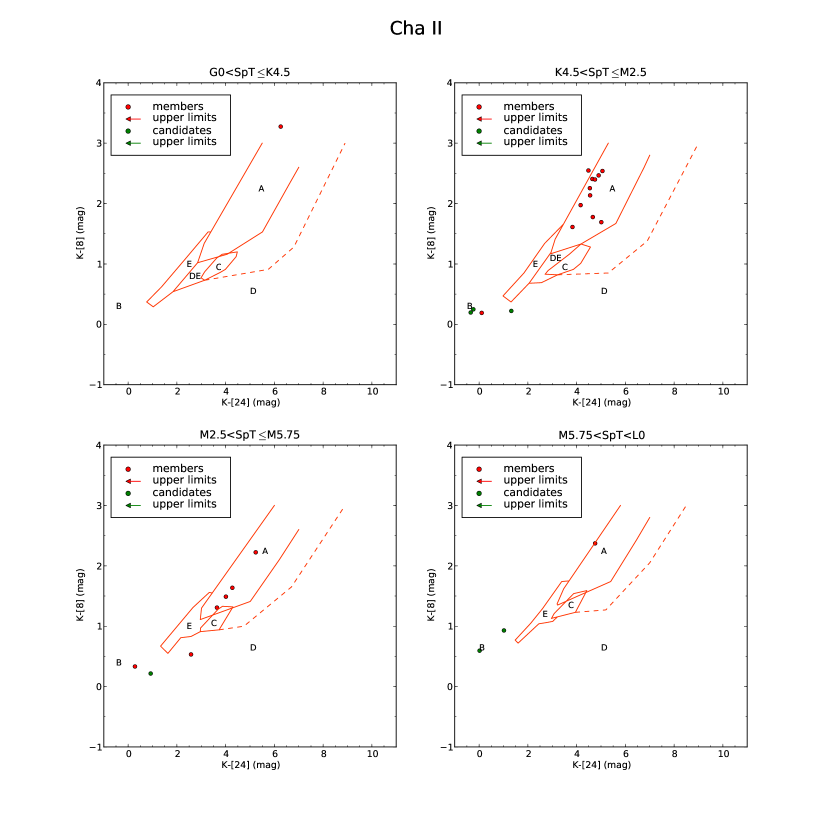
Cha II (Figure 14)
In the 4 -5 Myr (Spezzi et al., 2008) old star-forming region Cha II 63 % of the discs have been classified as primordial optically-thick, while 25.9 % have already depleted their discs. 7.4 % of the objects are clearing their disc from the inside-out. For ChaII no discs are found in the HD region. We included candidates in our statistics. -
•
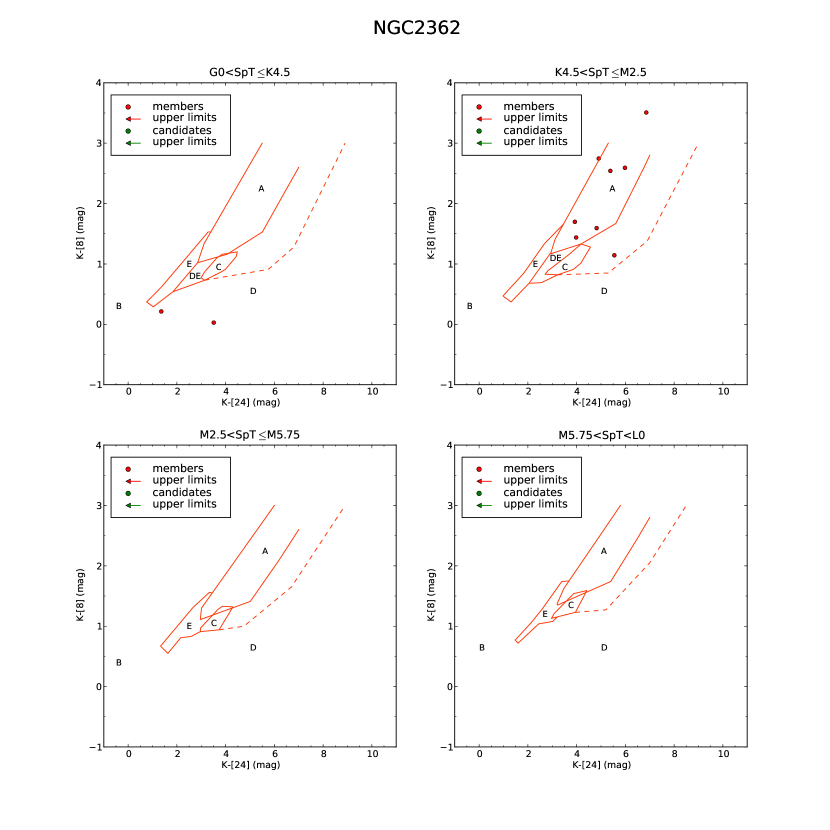
NGC2362 (Figure 15)
The 5 Myr (Mayne & Naylor, 2008) old cluster NGC2362 has few spectroscopically-classified objects and/ or few detected sources in the 24 band. 60.0 % of the sources are still primordial optically-thick while none are classified as primordial ultra-settled discs or have lost their discs already. 30.0 % are clearing their discs via an IOC process. -
•
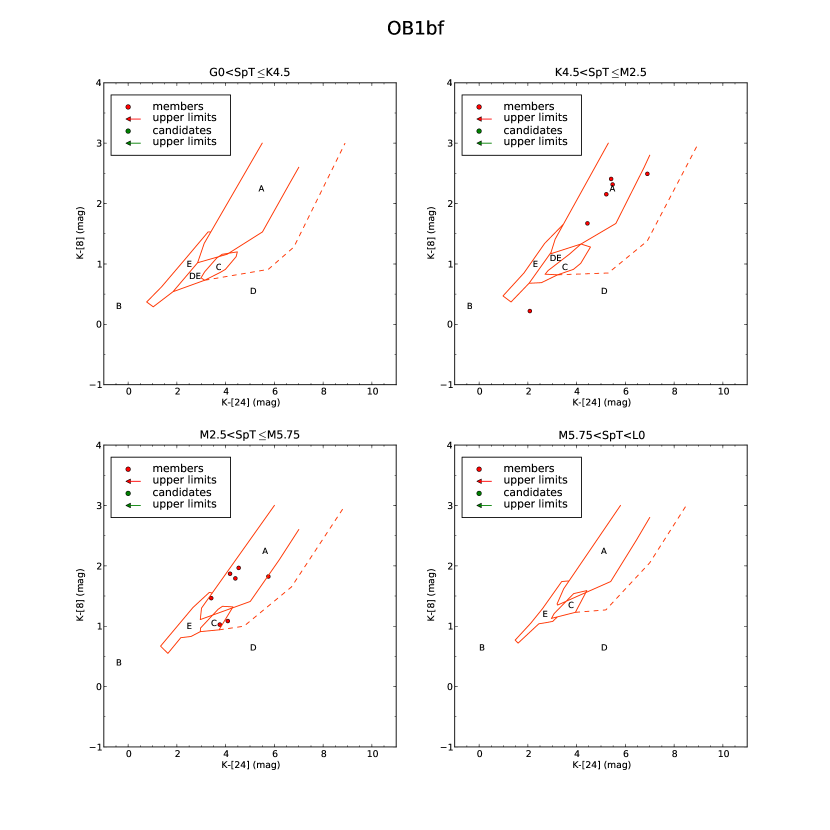
OB1bf (Figure 16)
61.5 % of the discs in the 5 Myr (Hernández et al., 2006) old star-forming region OB1bf are still primordial optically-thick discs and one disc (7.7 %) is classified as primordial ultra-settled. 30.8 % of the sources are clearing via the IOC process but no sources have lost their discs so far. -
•
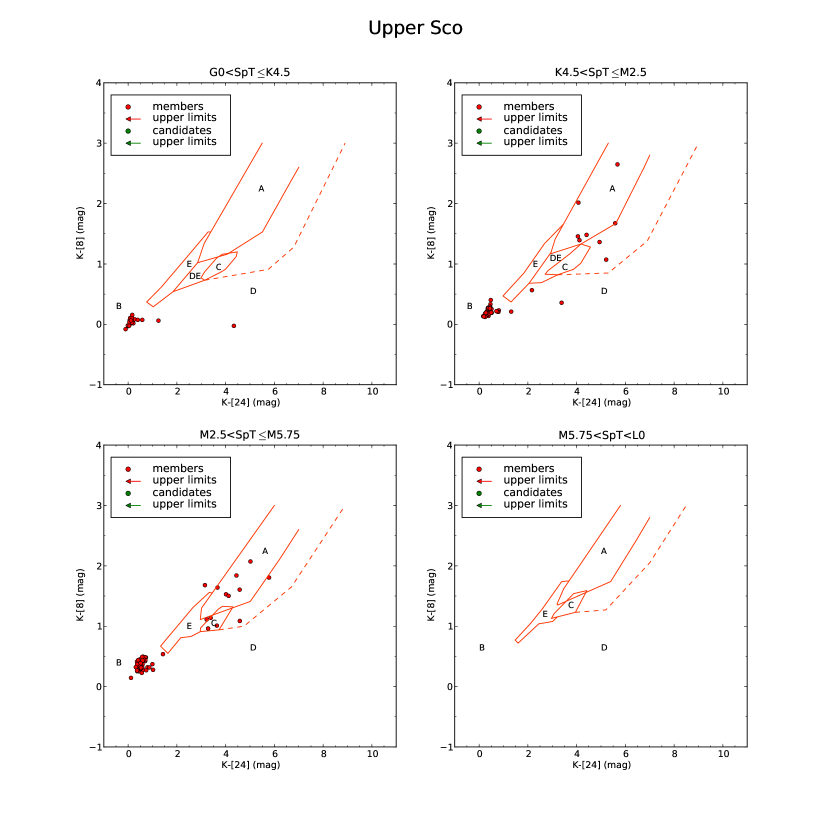
Upper Sco (Figure 17)
The 5 Myr (Hernández et al., 2007b) old Upper Sco region seems to be more evolved than most of the other star-forming regions considered in this work. Only 9.0 % and 2.3 % of the discs, respectively, are still primordial optically-thick or classified as primordial ultra-settled. 80.5 % have already lost their discs and 6.8 % are clearing their discs via the IOC process. Only one disc (0.8 %) is found at the edge of the HD regime. - •
-
•
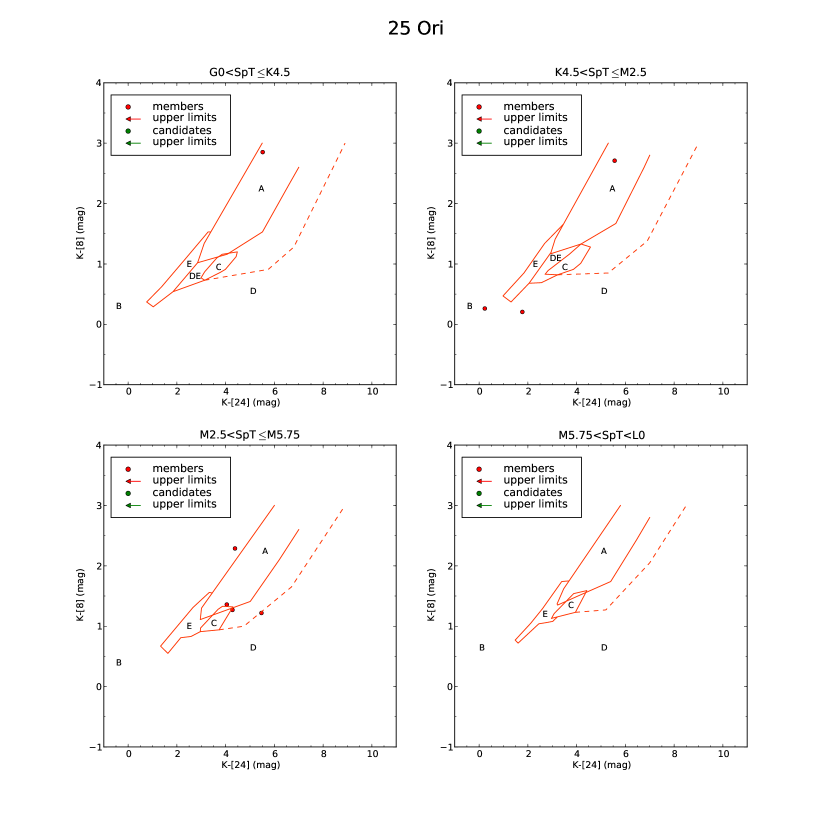
25 Ori (Figure 19)
In the 7 - 10 Myr (Briceño et al., 2007) old star-forming region 25 Ori objects have barely been detected in the 24 band. 37.5 % of the objects have primordial optically-thick discs, whereas one source (12.5 %) has cleared its disc already. 37.5 % of the objects are clearing their discs from the inside-out.
3.2 Time-scales
With the sample of YSOs in different star-forming regions becoming larger and larger, it is now possible to estimate the typical time-scales for the disc dispersal phase, even though cluster ages of course always introduce a large uncertainty in the estimates. In order to estimate the time-scale of the disc dispersal phase on the basis of our sample, we have considered star-forming regions that have more than 10 objects. We combine boxes A and C into a single ’primordial’ category and boxes D and E into a single ’evolved discs’ category. All objects in box B remain classified as disc-less sources. We count objects to the left of the A regime in the ’primordial’ category, if K - [8]1.5.
The disc-evolution time-scale of a star-forming region can be estimated by , where age is the estimated age of the star-forming region and and are the numbers of the total and evolved disc populations, respectively. In Table 6 we list the individual time-scales for the populations of four spectral type intervals (SpT) as well as their average (SpT) and the cluster time-scale . The absolute errors arise from the error propagation of the standard statistical errors (e.g. ) and the uncertainty in age. Note that we arbitrarily assign an error of 10 % to those cases where no error is given in the literature.
Typical transition time-scales for the considered star-forming regions are of order yrs. IC348, OB1bf, NGC2264 and Lup III seem to show larger transition time-scales of approximately 1.3 Myrs. The average time-scale across all spectral type (SpT) yrs is roughly the same as the average cluster time-scale yrs. This is partially because there is no significant difference for (SpT) amongst spectral types.
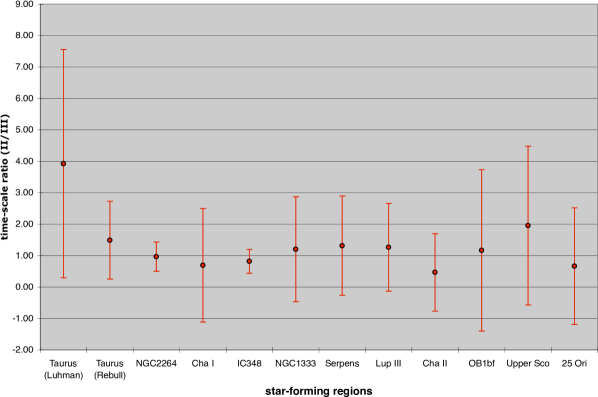
We further illustrate that disc dispersal time-scales appear to be independent of spectral type. We plot in Figure 20, the time-scale ratio (II)/(III) (K and M stars) and show that this ratio is consistent with unity. This suggests that there is no significant dependence of the time-scale on stellar mass, as has already been pointed out by Ercolano et al. (2011a), who performed a spatial analysis of the distribution of K and M stars with discs in young star-forming regions and found no significant difference in the distributions.
In Figure 21, we show histograms, correlating the age of the star-forming regions with the number of objects in each evolutionary stage. The expected correlation of percentage of evolved and disc-less objects with age is not clear from the plot. As well as the usual uncertainty in the ages, a number of other factors may contribute to the scatter. Very importantly, identification of class III sources, crucial for the statistics, relies on X-ray observations, to make unbiased classifications. Unfortunately, only 4 out of 15 regions have been sufficiently backed up by X-ray observation. 7 of the regions contain some classified X-ray sources, while the remaining 4 used different criteria for their member classification.
4 Summary & Conclusions
We have calculated the SEDs of protoplanetary discs of different spectral types, geometries, settling and inclination. We then considered the evolution of the infrared colours (K - [8] vs. K - [24]) of the model disks as they disperse according to different scenarios (homologous depletion, inside-out and outside-in clearing). Based on our models we propose a new diagnostic infrared colour-colour diagram to classify the evolutionary stage of YSOs. We have applied our infrared colour-colour diagnostic diagram to classify YSOs in 15 nearby star-forming regions and study the evolution of their disc populations. We estimate time-scales for transition phase of typically a few years independent of stellar mass.
We conclude that, regardless of spectral type, current observations point to fast inside-out clearing as the preferred mode of disc dispersal.
Acknowledgments
We thank the referee, Barbara Whitney, for a constructive report that helped us improve the clarity and the solidity of the results presented in our paper. We would like to thank Dr. Jesús Hernández, who supplied us with spectral types for members of 25Ori and OB1bf.
References
- Alexander & Armitage (2009) Alexander R. D., Armitage P. J., 2009, ApJ, 704, 989
- Alexander et al. (2006a) Alexander R. D., Clarke C. J., Pringle J. E., 2006a, MNRAS, 369, 216
- Alexander et al. (2006b) Alexander R. D., Clarke C. J., Pringle J. E., 2006b, MNRAS, 369, 229
- Allen et al. (2004) Allen L. E. et al., 2004, ApJ Suppl., 154, 363
- Baxter et al. (2009) Baxter E. J., Covey K. R., Muench A. A., Fűrész G., Rebull L., Szentgyorgyi A. H., 2009, AJ, 138, 963
- Bouwman et al. (2006) Bouwman J., Lawson W. A., Dominik C., Feigelson E. D., Henning T., Tielens A. G. G. M., Waters L. B. F. M., 2006, ApJ Letters, 653, L57
- Briceño et al. (2005) Briceño C., Calvet N., Hernández J., Vivas A. K., Hartmann L., Downes J. J., Berlind P., 2005, AJ, 129, 907
- Briceño et al. (2007) Briceño C., Hartmann L., Hernández J., Calvet N., Vivas A. K., Furesz G., Szentgyorgyi A., 2007, ApJ, 661, 1119
- Brott & Hauschildt (2005) Brott I., Hauschildt P. H., 2005, in ESA Special Publication, Vol. 576, The Three-Dimensional Universe with Gaia, Turon C., O’Flaherty K. S., Perryman M. A. C., eds., p. 565
- Carpenter et al. (2006) Carpenter J. M., Mamajek E. E., Hillenbrand L. A., Meyer M. R., 2006, ApJ Letters, 651, L49
- Carpenter et al. (2009) Carpenter J. M., Mamajek E. E., Hillenbrand L. A., Meyer M. R., 2009, ApJ, 705, 1646
- Castelli & Kurucz (2004) Castelli F., Kurucz R. L., 2004, ArXiv Astrophysics e-prints
- Cernis (1993) Cernis K., 1993, Baltic Astronomy, 2, 214
- Cieza et al. (2009) Cieza L. A. et al., 2009, ApJ Letters, 696, L84
- Clarke et al. (2001) Clarke C. J., Gendrin A., Sotomayor M., 2001, MNRAS, 328, 485
- Contreras et al. (2002) Contreras M. E., Sicilia-Aguilar A., Muzerolle J., Calvet N., Berlind P., Hartmann L., 2002, AJ, 124, 1585
- Currie & Kenyon (2009) Currie T., Kenyon S. J., 2009, AJ, 138, 703
- Currie et al. (2009) Currie T., Lada C. J., Plavchan P., Robitaille T. P., Irwin J., Kenyon S. J., 2009, ApJ, 698, 1
- Cutri et al. (2003) Cutri R. M. et al., 2003, VizieR Online Data Catalog, 2246
- Dahm & Hillenbrand (2007) Dahm S. E., Hillenbrand L. A., 2007, AJ, 133, 2072
- de Zeeuw et al. (1999) de Zeeuw P. T., Hoogerwerf R., de Bruijne J. H. J., Brown A. G. A., Blaauw A., 1999, AJ, 117, 354
- Dullemond & Dominik (2005) Dullemond C. P., Dominik C., 2005, A&A, 434, 971
- Dzib et al. (2010) Dzib S., Loinard L., Mioduszewski A. J., Boden A. F., Rodríguez L. F., Torres R. M., 2010, ApJ, 718, 610
- Ercolano et al. (2011a) Ercolano B., Bastian N., Spezzi L., Owen J., 2011a, MNRAS, 416, 439
- Ercolano et al. (2011b) Ercolano B., Clarke C. J., Hall A. C., 2011b, MNRAS, 410, 671
- Espaillat et al. (2011) Espaillat C., Furlan E., D’Alessio P., Sargent B., Nagel E., Calvet N., Watson D. M., Muzerolle J., 2011, ApJ, 728, 49
- Evans et al. (2009) Evans, II N. J. et al., 2009, ApJ Suppl., 181, 321
- Fazio et al. (2004) Fazio G. G. et al., 2004, ApJ Suppl., 154, 10
- Fűrész et al. (2006) Fűrész G. et al., 2006, ApJ, 648, 1090
- Flaherty & Muzerolle (2008) Flaherty K. M., Muzerolle J., 2008, AJ, 135, 966
- Furlan et al. (2011) Furlan E. et al., 2011, ApJ Suppl., 195, 3
- Furlan et al. (2009) Furlan E. et al., 2009, ApJ, 703, 1964
- Gorti et al. (2009) Gorti U., Dullemond C. P., Hollenbach D., 2009, ApJ, 705, 1237
- Gutermuth et al. (2009) Gutermuth R. A., Megeath S. T., Myers P. C., Allen L. E., Pipher J. L., Fazio G. G., 2009, ApJ Suppl., 184, 18
- Hartmann et al. (1998) Hartmann L., Calvet N., Gullbring E., D’Alessio P., 1998, ApJ, 495, 385
- Herbig (1998) Herbig G. H., 1998, ApJ, 497, 736
- Herbst (2008) Herbst W., 2008, Star Formation in IC 348, PASP, p. 372
- Hernández et al. (2006) Hernández J., Briceño C., Calvet N., Hartmann L., Muzerolle J., Quintero A., 2006, ApJ, 652, 472
- Hernández et al. (2007a) Hernández J. et al., 2007a, ApJ, 671, 1784
- Hernández et al. (2005) Hernández J., Calvet N., Hartmann L., Briceño C., Sicilia-Aguilar A., Berlind P., 2005, AJ, 129, 856
- Hernández et al. (2007b) Hernández J. et al., 2007b, ApJ, 662, 1067
- Hernández (2011) Hernández J. p. c., 2011. (personal communication)
- Hirota et al. (2008) Hirota T. et al., 2008, PASJ, 60, 37
- Houck et al. (2004) Houck J. R. et al., 2004, ApJ Suppl., 154, 18
- Ireland & Kraus (2008) Ireland M. J., Kraus A. L., 2008, ApJ Letters, 678, L59
- Kenyon et al. (1994) Kenyon S. J., Dobrzycka D., Hartmann L., 1994, AJ, 108, 1872
- Luhman (2004) Luhman K. L., 2004, ApJ, 617, 1216
- Luhman (2007) Luhman K. L., 2007, ApJ Suppl., 173, 104
- Luhman et al. (2010) Luhman K. L., Allen P. R., Espaillat C., Hartmann L., Calvet N., 2010, ApJ Suppl., 186, 111
- Luhman et al. (2009) Luhman K. L., Mamajek E. E., Allen P. R., Cruz K. L., 2009, ApJ, 703, 399
- Luhman et al. (2003) Luhman K. L., Stauffer J. R., Muench A. A., Rieke G. H., Lada E. A., Bouvier J., Lada C. J., 2003, ApJ, 593, 1093
- Luhman & Steeghs (2004) Luhman K. L., Steeghs D., 2004, ApJ, 609, 917
- Mamajek et al. (1999) Mamajek E. E., Lawson W. A., Feigelson E. D., 1999, ApJ Letters, 516, L77
- Mayne & Naylor (2008) Mayne N. J., Naylor T., 2008, MNRAS, 386, 261
- McCaughrean & O’Dell (1996) McCaughrean M. J., O’Dell C. R., 1996, AJ, 111, 1977
- Merín et al. (2008) Merín B. et al., 2008, ApJ Suppl., 177, 551
- Monin et al. (2007) Monin J.-L., Clarke C. J., Prato L., McCabe C., 2007, Protostars and Planets V, 395
- Muench et al. (2003) Muench A. A. et al., 2003, AJ, 125, 2029
- Muzerolle et al. (2010) Muzerolle J., Allen L. E., Megeath S. T., Hernández J., Gutermuth R. A., 2010, ApJ, 708, 1107
- Oliveira et al. (2009) Oliveira I. et al., 2009, ApJ, 691, 672
- Owen & Clarke (2012) Owen J., Clarke C., 2012, ArXiv e-prints
- Owen et al. (2012) Owen J. E., Clarke C. J., Ercolano B., 2012, MNRAS, 422, 1880
- Owen et al. (2011a) Owen J. E., Ercolano B., Clarke C. J., 2011a, MNRAS, 412, 13
- Owen et al. (2011b) Owen J. E., Ercolano B., Clarke C. J., 2011b, MNRAS, 411, 1104
- Owen et al. (2010) Owen J. E., Ercolano B., Clarke C. J., Alexander R. D., 2010, MNRAS, 401, 1415
- Rebull et al. (2010) Rebull L. M. et al., 2010, ApJ Suppl., 186, 259
- Reipurth, B. (2008a) Reipurth, B., ed., 2008a, Handbook of Star Forming Regions, Volume I: The Northern Sky. PASP
- Reipurth, B. (2008b) Reipurth, B., ed., 2008b, Handbook of Star Forming Regions, Volume II: The Southern Sky. PASP
- Ricci et al. (2008) Ricci L., Robberto M., Soderblom D. R., 2008, AJ, 136, 2136
- Rieke et al. (2004) Rieke G. H. et al., 2004, ApJ Suppl., 154, 25
- Robitaille et al. (2007) Robitaille T. P., Whitney B. A., Indebetouw R., Wood K., 2007, ApJ Suppl., 169, 328
- Robitaille et al. (2006) Robitaille T. P., Whitney B. A., Indebetouw R., Wood K., Denzmore P., 2006, ApJ Suppl., 167, 256
- Scally & Clarke (2001) Scally A., Clarke C., 2001, MNRAS, 325, 449
- Scholz et al. (1999) Scholz R.-D. et al., 1999, A&A Suppl., 137, 305
- Sicilia-Aguilar et al. (2006) Sicilia-Aguilar A. et al., 2006, ApJ, 638, 897
- Sicilia-Aguilar et al. (2004) Sicilia-Aguilar A., Hartmann L. W., Briceño C., Muzerolle J., Calvet N., 2004, AJ, 128, 805
- Sicilia-Aguilar et al. (2005) Sicilia-Aguilar A., Hartmann L. W., Hernández J., Briceño C., Calvet N., 2005, AJ, 130, 188
- Spezzi et al. (2008) Spezzi L. et al., 2008, ApJ, 680, 1295
- Straižys et al. (1996) Straižys V., Černis K., Bartašiūte S., 1996, Baltic Astronomy, 5, 125
- Sung et al. (1997) Sung H., Bessell M. S., Lee S.-W., 1997, AJ, 114, 2644
- Teixeira (2008) Teixeira P. S., 2008, PhD thesis, Harvard-Smithsonian Center for Astrophysics, USA and University of Lisbon, Portugal
- Teixeira et al. (2012) Teixeira P. S., Lada C. J., Marengo M., Lada E. A., 2012, A&A, 540, A83
- Torres et al. (2007) Torres R. M., Loinard L., Mioduszewski A. J., Rodríguez L. F., 2007, ApJ, 671, 1813
- Werner et al. (2004) Werner M. W. et al., 2004, ApJ Suppl., 154, 1
- Whitney et al. (2003a) Whitney B. A., Wood K., Bjorkman J. E., Cohen M., 2003a, ApJ, 598, 1079
- Whitney et al. (2003b) Whitney B. A., Wood K., Bjorkman J. E., Wolff M. J., 2003b, ApJ, 591, 1049
- Whittet et al. (1997) Whittet D. C. B., Prusti T., Franco G. A. P., Gerakines P. A., Kilkenny D., Larson K. A., Wesselius P. R., 1997, A&A, 327, 1194
- Williams & Cieza (2011) Williams J. P., Cieza L. A., 2011, ARA&A, 49, 67
- Winston et al. (2009) Winston E. et al., 2009, AJ, 137, 4777
- Zhu et al. (2011) Zhu Z., Nelson R. P., Hartmann L., Espaillat C., Calvet N., 2011, ApJ, 729, 47
|
|
|
|
The values of the boundaries are given in the Appendix.

Appendix A
We list here the boundary points of the evolutionary boxes to allow automatized application to observational data.
From the IOC runs for finite-thickness discs, we can conclude further that all objects found in the D box with colours bluer in K - [24] than 4 can be considered as evolved ultra-settled objects. Objects redder in K - [24] than 5 represent the evolved discs which are either settled or mixed and/ or flared.
The boundaries for primordial discs with envelopes.