-titleTidal Distuption Workshop 11institutetext: Racah Institute for Physics, The Hebrew University, Jerusalem, 91904, Israel 22institutetext: Physics and Astronomy Department, Johns Hopkins University, Baltimore, MD 21218, USA
Time Scales in Tidal Disruption Events
Abstract
We explore the temporal structure of tidal disruption events pointing out the corresponding transitions in the lightcurves of the thermal accretion disk and of the jet emerging from such events. The hydrodynamic time scale of the disrupted star is the minimal time scale of building up the accretion disk and the jet and it sets a limit on the rise time. This suggest that Swift J1644+57, that shows several flares with a rise time as short as a few hundred seconds could not have arisen from a tidal disruption of a main sequence star whose hydrodynamic time is a few hours. The disrupted object must have been a white dwarf. A second important time scale is the Eddington time in which the accretion rate changes form super to sub Eddington. It is possible that such a transition was observed in the light curve of Swift J2058+05. If correct this provides intersting constraints on the parameters of the system.
1 Introduction
Tidal disruption events (TDE) of s stellar mass object by a massive black hole are a classical transient phenomenon that involves numerous time scales: (i) the gravitational time scale of the massive black hole (ii) the orbital period at the tidal radius, which equals the hydrodynamic time scale of the disrupted star, (iii) the orbital period at the innermost semi-major axis of the disrupted stellar material on which the accretion rate peaks, (iv) the transition from super so sub Eddington accretion and (v) the transition from radiation dominated inner disk region to gas pressure dominated. For typical parameters these values range from a few dozen seconds to several years, all but the second depend strongly on the black hole’s mass. If interpreted correctly, they provide invaluable information concerning the system. We examine these times scales and their implications to the interpretation of the observations of Swift J1644+57 and J2058+05.
2 Dynamical Time Scales
The shortest time scale expected in a TDE is the orbital period, , of the tidal radius, . It is comparable to the hydrodynamic time scale in which matter can be extracted from the disrupted star. Note that is independent of the disrupting black hole’s mass:
| (1) |
where is the mass of the star in solar units. for radiative stars, but is for convective ones (see phinney89 ; kp11 ; kp12 for details). We have approximated the main sequence mass-radius relation by ; kipp94 ; kp12 .
The disrupted star is spread out and the most bound matter, at , may have a binding energy as great as , where is the pericenter of the initial orbit and is the “penetration factor”. The corresponding period is:
| (2) |
The accretion rate peaks on this time scale rees88 ; phinney89 . Assuming that the disrupted stellar derbies have a uniform distribution in orbital binding energy per unit mass, matter returns to and accrets onto the black hole at a rate . Note that . Intersecting streams could lead to a conversion of orbital energy to heat, diminishing these orbital periods, but in no case we would expect time scales shorter than . Numerical simulations of the disruption of a main sequence star by a black hole Ayal+00 show a rather continuous accretion rate with a rise time of a few times sec and an overall duration of a few times sec, as expected from these analytic estimates.
3 Implication for Swift J1644+57
The flaring x-ray source Swift J1644+57 burrows+11 resembled initially a classical -ray burst. However, its repeated extremely short flares separated by a few thousand seconds and its long lasting emission revealed that this is not the case. The location of the burst at the center of its host galaxy led to the suggestion that it is a TDE driven jet bloom+11 ; levan+11 . Overall, Swift J1644+57 reveals a number of characteristic times: rise-times as short as sec; flare durations –10000 sec; quiescent periods sec long; a transition to a smooths flow around sec; and a total event duration of more than sec (see Fig. 1).
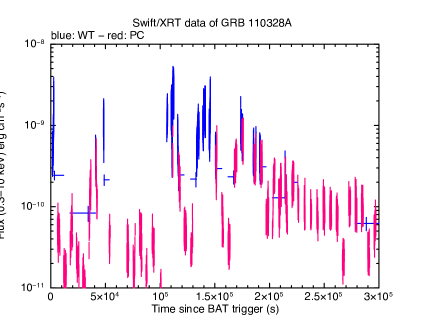
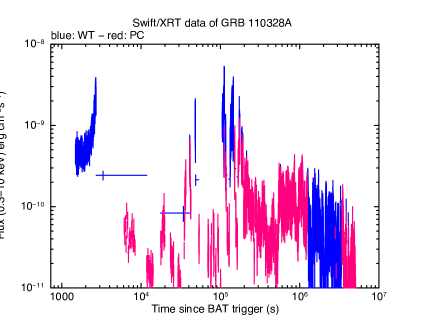
It is hard to reconcile these observed timescales with the dynamical estimates. The rise time in the consensus model, a main sequence star disrupted by a black hole, is said to reflect the light-crossing time across the black hole’s horizon, . But it is not clear what dynamics link that quantity to triggering a flare, nor is there any natural explanation for the flare duration. Moreover, as it takes to drain the mass from the disrupted star, it is not clear how a rise time significantly shorter than that arises. Furthermore, the timescale at which the flares merged into a smoother lightcurve and the power-law decay begins, sec, appears to be at least one order of magnitude shorter than expected . These difficulties have led us kp11 to suggest that Swift J1644+57 arises due to the disruption of a white dwarf (WD) by a – black hole. Furthermore, the WD it is not disrupted all at once, but instead it loses pieces of itself in several passes before dissolving. This suggestion is motivated by the fact that the fundamental timescale of a tidal disruption is dictated by the mean density of the star; the greater density of the WD corresponds to a hydrodynamic time scale of a few seconds which makes it much easier to achieve the short timescales of this event. While this resolves many of the problems associated with the light curve this solution requires a relatively light disrupting black hole, below typical masses observed in galactic centers and below the estimate based on the –bulge luminosity correlation, burrows+11 .
4 Accretion Time Scales
Once the matter returns to the vicinity of it is captured into an accretion disk whose inflow time . As the matter moves inward through this disk, there is local dissipation of the conventional accretion disk variety, and the heat is radiated in the usual quasi-thermal fashion. At the peak accretion rate estimated by lkp09 the luminosity would be:
| (3) |
for radiative efficiency (see also ulmer99 ; strubbe09 )111The Eddintgon luminosity ratio is for a radiative star, for a convective star it is lower by a factor of 4.. In a very narrow mass range222We have normalized most parameters to their canonical values.: the luminosity won’t exceed Eddington. If the black hole is more massive it swallows the star before tidally disrupting it.
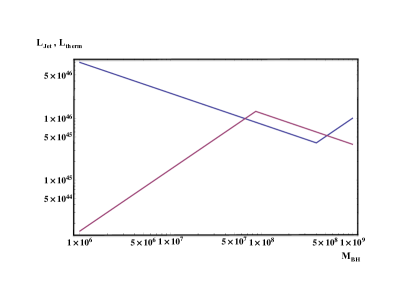
The accretion can lead also to the formation of a jet powered by a Blandford-Znajek process giannios11 . One can estimate the power of this jet as kp12 : , where is the mid pressure at the inner region of the disk and is the gravitational radius of the black hole (see Fig. 2).
As noted already by Ulmers ulmer99 the accretion is initially super Eddington. The transition to sub-Eddington takes place at:
| (4) |
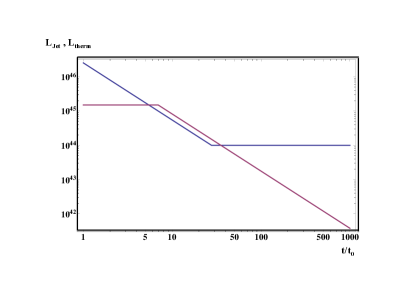
From the disk we expect for a roughly constant bolometric luminosity and a decreasing luminosity, at later times ulmer99 ; strubbe09 ; LR11 . We kp12 have found an accompanying transition at the jet luminosity at . For the jet power is proportional to the accretion rate and it decrease like . On the other hand for , the disk becomes thin and radiation dominated. In such a case the pressure in the innermost region of the disk is independent of the accretion rate moderski96 . This leads to a roughly constant jet luminosity in this regime. This constant phase will continue until the inner regions of the disk becomes gas dominated leading to a rapid decrease in the jet luminosity.
Figure 2b gives a schematic view, beginning at the time of peak accretion rate, of what might be expected in terms of the light curves for the jet power (before allowance for beaming and radiative efficiency) and the thermal disk luminosity. For the parameter values chosen (, all other scaling parameters unity), falls to the level of at almost the same time, , as enters the sub-Eddington regime and also begins to decline. From that time to , both fall together, maintaining similar power levels. Finally, after (i.e., a time larger by than the time at which the thermal luminosity begins to decline), the jet luminosity stabilizes, while continues to fall.
5 Implication for Swift J2058+05
Swift J2058+05 cenko+11 might be an example demonstrating these effects. The x-ray lightcurve is shown in Figure 3. For d, its flux stayed nearly constant; for the next three months, it declined . Starting at –100 d, the decline appears to have become much more shallow. In kp12 we compare these features in the light curve with the predictions of the model. If we identify the first break in the lightcurve with and the second one as then under reasonable assumptions we can estimate the mass of the black hole, , as well as other physical parameters of the system (see kp12 for details).

6 Conclusions
We have explored the various time scales in TDEs and have shown their implications for two TDE candidates, demonstrating the power of a detailed temporal analysis of such events.
This work was partially supported by NSF grants AST-0507455 and AST-0908336 (JHK) and by an ERC advanced research grant (TP).
References
- (1) Phinney, E. S. 1989, IAU Symposium, Vol. 136, The Center of the Galaxy, ed.M. Morris, 543
- (2) Krolik, J. H., & Piran, T. 2011, Ap. J., 743, 134
- (3) Krolik, J. H., & Piran, T. 2012, Ap. J., 749, 92
- (4) Kippenhahn, R., & Weigert, A. 1994, Stellar Structure and Evolution (Springer-Verlag Berlin)
- (5) Rees, M. J. 1988, Nature, 333, 523
- (6) Ayal, S., Livio, M., & Piran, T. 2000, Ap. J., 545, 772
- (7) Burrows, D. N., Kennea, J. A., Ghisellini, G., et al. 2011, Nature, 476, 421
- (8) Bloom, J. S., Giannios, D., Metzger, B. D., et al. 2011, Science, 333, 203
- (9) Levan, A. J., Tanvir, N. R., Cenko, S. B., et al. 2011, Science, 333, 199
- (10) Lodato, G., King, A. R., & Pringle, J. E. 2009, Mon. not. RAS., 392, 332
- (11) Ulmer, A. 1999, Ap. J., 514, 180
- (12) Strubbe, L. E., & Quataert, E. 2009, Mon. not. RAS., 400, 2070
- (13) Giannios, D., & Metzger, B. D. 2011, Mon. not. RAS., 1137
- (14) Lodato, G., & Rossi, E. M. 2011, Mon. not. RAS., 410, 359
- (15) Moderski, R., & Sikora, M. 1996, Mon. not. RAS., 283, 854
- (16) Cenko, S. B., Krimm, H. A., Horesh, A., et al. 2012, Ap. J., 753, 77