The Slow Death (or Rebirth?) of Extended Star Formation in Green Valley Early-Type Galaxies
Abstract
UV observations in the local universe have uncovered a population of early-type galaxies with UV flux consistent with low-level recent or ongoing star formation. Understanding the origin of such star formation remains an open issue. We present resolved UV-optical photometry of a sample of 19 SDSS early-type galaxies at drawn from the sample originally selected by Salim & Rich (2010) to lie in the bluer part of the green valley in the UV-optical color-magnitude diagram as measured by GALEX. Utilizing high-resolution HST far-UV imaging provides unique insight into the distribution of UV light in these galaxies, which we call “extended star-forming early-type galaxies” (ESF-ETGs) because of extended UV emission that is indicative of recent star formation. The UV-optical color profiles of all ESF-ETGs show red centers and blue outer parts. Their outer colors require the existence of a significant underlying population of older stars in the UV-bright regions. Analysis of stacked SDSS spectra reveals weak LINER-like emission in their centers. Using a cross-matched SDSS DR7/GALEX GR6 catalog, we search for other green valley galaxies with similar properties to these ESF-ETGs and estimate that of dust-corrected green valley galaxies of similar stellar mass and UV-optical color are likely ESF-candidates, i.e., ESF-ETGs are not rare. Our results are consistent with star formation that is gradually declining in existing disks, i.e., the ESF-ETGs are evolving onto the red sequence for the first time, or with rejuvenated star formation due to accreted gas in older disks provided that the gas does not disrupt the structure of the galaxy and the resulting star formation is not too recent and bursty. ESF-ETGs may typify an important subpopulation of galaxies that can linger in the green valley for up to several Gyrs, based on their resemblance to nearby gas-rich green valley galaxies with low-level ongoing star formation.
Subject headings:
Galaxies: elliptical and lenticular, cD – Galaxies: evolution – Galaxies: photometry – Ultraviolet: galaxies1. INTRODUCTION
Early-type galaxies (ETGs) are no longer viewed as a homogeneous population of “red and dead” systems that have ceased forming stars at late times. A mounting wealth of evidence indicates that some ETGs have experienced recent or ongoing star formation (SF). In the nearby universe, the SAURON survey (de Zeeuw et al., 2002) has uncovered recent SF in a subset of the ETGs in its sample. (Note that the SAURON galaxies are only a representative sample of local ETGs rather than a complete, volume-limited sample.) Shapiro et al. (2010) found that the of SAURON galaxies with infrared signatures of SF (i.e., PAH emission) are preferentially classified as “fast rotators” (galaxies harboring an embedded disc component), while the non-star forming galaxies are “slow rotators” (spheroidal, kinematically hot systems). This result was corroborated by a stellar population analysis of absorption line maps of the SAURON galaxies: a subset of the fast rotators have SSP-equivalent ages consistent with recent SF, while slow rotators have uniformly old ages (Kuntschner et al., 2010). Intriguingly, the fast rotators tend to be morphologically classified as S0 (lenticular) galaxies, while the slow rotators are almost exclusively E (elliptical) galaxies (Emsellem et al., 2007). This suggests a possible morphological dependence on the observed SF in ETGs, with recent SF preferentially occurring in S0 galaxies.
Evidence for recent or ongoing SF in ETGs is also found in much larger samples available from all-sky surveys, including the Sloan Digital Sky Survey (SDSS; Stoughton et al., 2002), and the Galaxy Evolution Explorer (GALEX; Martin et al., 2005). The latter provides UV measurements that are crucial in constraining recent SF (Kaviraj et al., 2009). Utilizing both SDSS and GALEX photometry, Yi et al. (2005) showed that at least of their sample of 160 nearby () ETGs have blue UV-optical colors that they argue can only be attributed to low-level recent SF. With a larger sample of morphologically selected SDSS ETGs, Kaviraj et al. (2007) concluded that of their sample have UV-optical colors consistent with SF occurring within the past 1 Gyr, forming – of the total stellar mass.
Given these results, it is clear that recent SF in ETGs is more prevalent than once believed. What remains uncertain is how to interpret such SF in the context of galaxy evolution. As is well known, galaxies exhibit a bimodal color distribution, with star-forming galaxies located in the “blue cloud” and passively evolving objects located in the “red sequence” (e.g., Strateva et al., 2001). In between the blue cloud and red sequence lies the “green valley” (GV), which is most apparent when studying UV-optical colors. The movement of galaxies through the GV is presumed to be a net flow from blue to red as a result of the quenching of SF in blue cloud galaxies and the resultant reddening of their colors (Bell et al., 2004; Faber et al., 2007; Martin et al., 2007). Within this framework, the ETGs with recent SF are a mystery: is the observed SF the most recent phase of the original (fading?) star formation, or is it a subsequent episode that has been triggered in a hitherto quiescent galaxy?
Much attention has been focused on the latter explanation of the recent SF in ETGs, which has been termed “rejuvenation” in the literature (e.g., Rampazzo et al., 2007; Thomas et al., 2010; Thilker et al., 2010; Marino et al., 2011). The newly triggered SF could drive a galaxy back into the GV from the (UV-optical) red sequence. In this paper, “rejuvenation” is used to describe SF that causes a quiescent red sequence galaxy to move back into the GV.
One possible cause of rejuvenated SF is gas accretion during gas-rich minor mergers (e.g., Kaviraj et al., 2009). Recently, Thilker et al. (2010) showed that the SF observed by GALEX in the outer regions of the nearby S0 galaxy NGC 404 is most likely fueled by an external reservoir of H I gas formed during a recent merger with a gas-rich dwarf galaxy (del Río et al., 2004). Gas-rich major mergers can also trigger nuclear SF; however, the infalling gas is also predicted to trigger strong AGN feedback that expels or heats up the remaining cold gas, effectively quenching SF (e.g., Di Matteo et al., 2005; Hopkins et al., 2006).
Another possible trigger for rejuvenated SF is smooth accretion from the intergalactic medium (IGM). Direct evidence for such accretion has been difficult to observe. However, the presence of extended reservoirs of neutral gas around ETGs has been shown to be a fairly common phenomenon (e.g., Morganti et al., 2006; Catinella et al., 2010). The formation of some of these H I disks has been attributed to accretion from the IGM (e.g., Finkelman et al., 2011; Wang et al., 2011). Cortese & Hughes (2009) found that the “H I-normal” galaxies in their sample of GV galaxies are experiencing recent SF that in a few cases may be rejuvenated, owing to evidence for recently accreted H I disks (i.e., the H I disks show disturbed or ring-like morphologies indicative of external accretion).
It is important to note that the UV flux seen in ETGs is not necessarily due to recent SF. An excess of UV flux seen in elliptical galaxies (the “UV upturn”) is believed to be caused by hot, evolved stars (e.g., horizontal branch stars; Code, 1969; O’Connell, 1999). In this case, the UV emission is expected to be smoothly distributed and follow the optical light profile of the galaxy. Note, however, that UV upturn ETGs are found in the UV-optical red sequence and not in the GV (Yi et al., 2005). AGN activity can also contribute to the UV light seen in ETGs (e.g., Agüeros et al., 2005).
Our understanding of recent SF and rejuvenation in ETGs has been drastically improved thanks to the large samples provided by SDSS and GALEX. However, due to the limited spatial resolution of GALEX and the typical redshift of SDSS galaxies (), it has not been possible to resolve the actual physical location of the SF that is inferred based on integrated UV-optical colors. Combining high-resolution UV imaging with the large sample sizes of all-sky surveys could provide important information about the nature and origin of recent SF in ETGs.
As a follow-up to the SDSS/GALEX studies mentioned above, Salim & Rich (2010, hereafter SR2010) reported first results from high-resolution HST UV imaging of a sample of 29 SDSS ETGs detected by GALEX. These galaxies were chosen to have high SDSS concentration and blue UV-optical colors, yet no detectable emission lines in the 3″ SDSS fiber spectra. This unique combination was intended to select centrally quiescent ETGs yet with high UV excess. The emission line cut also had the effect of discarding ETGs with emission lines due to AGN activity, including most LINERs.
SR2010 found that of their sample show extended UV emission in rings, clumps, and/or spiral arms due to ongoing or recent SF. In Salim et al. (2012, hereafter Paper I), these galaxies were named “extended star-forming early-type galaxies” (ESF-ETGs), and we do the same in this work. The remaining of their sample had only small-scale SF or centrally compact111These compact-UV objects are referred to as “unresolved” UV objects in Paper I. UV emission. According to SR2010, the ESF-ETGs on average have fairly low far-UV (FUV) dust attenuation and large UV sizes with respect to other galaxies with similar specific star formation rates. The large UV sizes and low FUV dust attenuation were consistent, they argued, with rejuvenated SF taking place in large outer reservoirs of gas acquired in mergers with gas-rich dwarfs or directly from the IGM. However, fading of the original SF could not be ruled out in at least part of the ESF-ETG sample.
A more comprehensive exploration of the same sample is presented in Paper I, supplemented with deep, good-seeing -band images taken with the WIYN telescope. The discussion there is focused on the qualitative morphologies of the ESF-ETGs as determined from optical and UV images. Galaxies were classified according to their optical Hubble types as well as by their UV morphologies. Some key conclusions from Paper I are (1) the ESF-ETGs have smooth optical morphologies without signatures of recent merger activity, (2) the origin of the gas is either internal or smoothly accreted from the IGM, and (3) the extended SF phenomenon is preferentially found in S0s and not ellipticals.
The intriguing results discussed in SR2010 and Paper I call out for additional data and analysis to provide further insight into the nature of ESF-ETGs in the GV. Quantitative photometry from the optical and UV images can provide additional information about the stellar populations in the ESF-ETGs. In addition, a more careful comparison between the ESF-ETGs and the SDSS/GALEX parent population from which they were selected can help elucidate whether these objects are rare or common. To tackle these issues, we take advantage of the available UV and optical imaging to present a quantitative analysis of the star formation within each galaxy via aperture photometry and stellar population modeling. We show that the ESF-ETGs have characteristically red centers containing old stars and blue outer disks due to recent SF, which is expected given how they were selected. The outer disks have a significant population of old stars as well, and we show that the colors are consistent with either the gradual decline of SF or rejuvenation occurring on extended timescales. In addition, we show that a sizable fraction of massive GV galaxies are potentially ESF-ETGs.
The paper is structured as follows. We describe the SR2010 sample of 29 ETGs, sources of data, and data reduction in Section 2. Section 3.1 presents optical and UV photometry of the sample, revealing similarities among the ESF-ETGs. An analysis of the stellar populations in the outer disks of the ESF-ETGs is presented in Section 3.2. Section 3.3 presents stacked SDSS spectra of the bulges of the ESF-ETGs, revealing old central ages and hints of weak emission activity with LINER-like ratios. We search for additional candidate ESF-ETGs from a large sample of SDSS galaxies and estimate the ESF-ETG contribution to the GV in Section 3.4. An examination of various possible scenarios to explain the SF in the ESF-ETGs is given in Section 4. Our main conclusions are summarized in Section 5.
All magnitudes in this paper are on the AB system (Oke, 1974). A concordance CDM cosmology with and is assumed.
2. DATA AND REDUCTION
Descriptions of the sample selection criteria used in SR2010 as well as specifics about the UV and optical imaging are discussed in detail in Paper I. Briefly, a sample of 30 quiescent ETGs with strong UV excess (FUV ) were selected from a cross-matched SDSS DR4/GALEX IR1.1 catalog (Seibert et al., 2005). High-resolution HST Solar-Blind Channel FUV images were obtained for 29 objects. The numbering scheme used in Paper I to identify these objects is retained in this paper, e.g., SR01 is the first object in the sample. Objects are ordered by increasing FUV color.
As discussed in Paper I, two objects (SR22 and SR26) were removed from the analysis because of incorrect GALEX IR1.1 FUV magnitudes that resulted in erroneously blue FUV colors. It was shown that the remaining galaxies divide nicely into three categories based on their UV morphology: extended SF (UV rings and/or arms, 19 objects), small-scale SF (6 objects), and compact (central UV source only, 2 objects). Because the ESF-ETGs represent the majority of the sample and may furthermore represent the behavior of many massive GV galaxies, we focus exclusively on them in the rest of this paper.
2.1. SDSS and GALEX Data
Placing the ESF-ETGs into the broader context of evolution through the GV requires a broad suite of ancillary data. In particular, we take advantage of additional structural and spectral data available from the SDSS and GALEX databases. To make use of updated data since SR2010, we used SDSS DR7 (Abazajian et al., 2009) and GALEX GR6 for both the ESF-ETGs and a larger SDSS sample. This larger sample was constructed using the SDSS DR7/GALEX GR6 cross-matched catalog available through the GALEX CASJobs interface222http://galex.stsci.edu/casjobs/. SDSS galaxies with redshifts having a GALEX NUV and/or FUV detection in the Medium Imaging Survey (MIS) within a 5″ radius were selected. Objects were excluded if they were more than 055 from the center of the GALEX detector to ensure reliable photometry. The resulting galaxies are referred to in this paper as the “SDSS master sample.” In Section 3.4, we select galaxies from this sample and compare their properties with the 19 HST ESF-ETGs.
For both the ESF-ETGs and the SDSS master sample, integrated magnitudes in GALEX FUV, NUV, and SDSS were retrieved. Spectroscopic redshifts, Galactic extinction, optical Petrosian radii (enclosing 50% of the Petrosian flux), isophotal axis ratios (isob_r/isoa_r), and GALEX FWHM measurements (a measure of UV diameter) were also collected; the GALEX resolution is FWHM. All integrated magnitudes were corrected for Galactic extinction and -corrected to using the kcorrect code, version 4.2 (Blanton & Roweis, 2007). For reference, the median -correction for blue cloud (red sequence) galaxies is FUV and , where is the difference between observed and rest-frame color. Stellar mass estimates and emission line measurements were obtained from the MPA/JHU value-added catalogs for SDSS DR7333A Chabrier IMF was assumed in calculating stellar masses. Catalogs are available at http://www.mpa-garching.mpg.de/SDSS/DR7. Table 1 lists the various SDSS and GALEX quantities described above for the ESF-ETGs. We also obtained ugriz aperture photometry for the ESF-ETGs from the SDSS DR7 database’s frames pipeline. These data consist of radially averaged surface brightness profiles measured in a series of circular annuli centered on each object. Aperture colors are corrected for Galactic extinction only, i.e., they have not been -corrected. The optical aperture photometry is used in conjunction with the HST UV photometry to measure color profiles (Section 3.1). Flux-calibrated SDSS spectra for the ESF-ETGs were also obtained for use in characterizing their central bulges (Section 3.3).
| Object | Redshift | FUV | FUV FWHM | H EW | |||||
|---|---|---|---|---|---|---|---|---|---|
| (kpc) | (Å) | ||||||||
| SR01 | 0.119 | 10.94 | 16.72 | 2.98 | 0.059 | 91.87 | 1.251 | 0.86 | |
| SR02 | 0.081 | 10.15 | 17.72 | 3.09 | 0.044 | 57.60 | 0.603 | 0.92 | |
| SR03 | 0.057 | 10.58 | 16.35 | 4.34 | 0.016 | 43.19 | 0.200 | 0.61 | |
| SR04 | 0.114 | 10.64 | 17.28 | 4.20 | 0.028 | 60.38 | 1.352 | 0.68 | |
| SR05 | 0.101 | 10.56 | 17.24 | 4.18 | 0.061 | 23.14 | 2.098 | 0.56 | |
| SR06 | 0.095 | 10.81 | 16.51 | 4.33 | 0.040 | 44.57 | 0.587 | 0.56 | |
| SR07 | 0.107 | 10.73 | 17.04 | 4.69 | 0.036 | 31.42 | 1.406 | 0.75 | |
| SR08 | 0.111 | 10.75 | 17.10 | 4.01 | 0.027 | 57.57 | 0.514 | 0.75 | |
| SR09 | 0.092 | 10.42 | 17.39 | 4.93 | 0.042 | 25.58 | 0.645 | 0.57 | |
| SR10 | 0.111 | 11.22 | 16.04 | 4.92 | 0.026 | 41.76 | 0.714 | 0.65 | |
| SR11 | 0.077 | 10.68 | 16.25 | 4.46 | 0.027 | 47.33 | 0.779 | 0.76 | |
| SR12 | 0.114 | 11.03 | 16.26 | 4.83 | 0.024 | 54.43 | 0.852 | 0.57 | |
| SR14 | 0.085 | 11.02 | 15.93 | 5.27 | 0.088 | 29.48 | 0.736 | 0.42 | |
| SR17 | 0.118 | 10.96 | 16.69 | 5.13 | 0.051 | 38.78 | 2.061 | 0.75 | |
| SR18 | 0.116 | 10.72 | 17.31 | 4.88 | 0.022 | 34.67 | 2.232 | 0.46 | |
| SR20 | 0.114 | 10.87 | 16.97 | 5.13 | 0.025 | 45.98 | 2.160 | 0.59 | |
| SR23 | 0.114 | 11.13 | 16.32 | 5.22 | 0.039 | 55.80 | 0.799 | 0.95 | |
| SR28 | 0.104 | 10.73 | 17.02 | 5.38 | 0.033 | 33.82 | 2.326 | 0.48 | |
| SR29 | 0.059 | 10.38 | 16.37 | 5.36 | 0.014 | 18.10 | 0.889 | 0.70 |
Note. — Redshifts, stellar masses, and H equivalent widths from the SDSS DR7 MPA/JHU value-added catalog. Optical photometry and axis ratios () from the SDSS DR7 database. FUV magnitudes, FUV FWHM, and color excess from the GALEX GR6 database. All photometry in table -corrected to and corrected for Galactic extinction using the values listed.
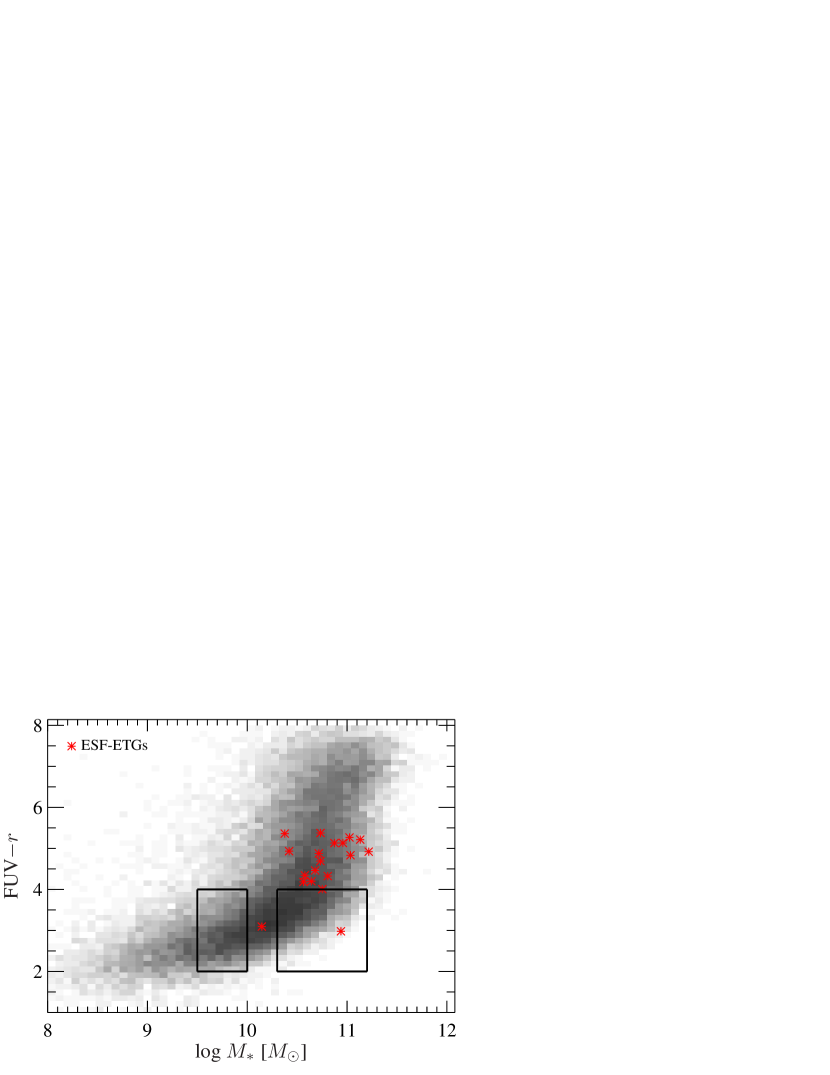
Figure 1 shows the distribution of the ESF-ETGs and the SDSS master sample in FUV color vs. stellar mass. This figure demonstrates how cleanly FUV separates the main galaxy population into well-defined blue and red sequences, with a clear GV in between. This is a major advantage of using a UV-optical color; we can easily separate fully quenched objects from those that have only recently quenched. An optical color does not have the dynamic range to do this, which is why the optical red sequence appears more prominent. In other words, the red sequence in Figure 1 appears less well-defined due to the “resolving power” of FUV color. In addition the figure does not show a volume-limited sample, which reduces the number of low-mass, red objects in the plot. Note that the ESF-ETGs are located among the higher-mass galaxies in the GV (and blue sequence).
2.2. Aperture Photometry
Aperture photometry of the UV images was measured using Source Extractor, version 2.8.6 (Bertin & Arnouts, 1996). To be consistent with the SDSS optical measurements, UV fluxes were measured using the circular apertures defined by the SDSS frames pipeline. The radii of the apertures used are . While elliptical apertures are better suited for this particular sample, we show below that the typical color profile in the outer parts of the galaxies is fairly flat, and thus our measurements are not that sensitive to the exact shape of the aperture. To check this, we compared the SDSS -band surface brightness profiles to those measured in elliptical apertures from deeper -band images taken with the WIYN telescope (presented in Paper I); no significant difference was found between the shapes of the SDSS and WIYN profiles. The WIYN data are not used here because they exist for only 16 of the 19 ESF-ETGs and because they have not been flux-calibrated. To avoid spurious color gradients, the HST UV images were first smoothed to match the 14 seeing (1) of the SDSS telescope. In a few cases (SR08 and SR17) nearby UV companions located within the outermost aperture were masked out prior to measuring photometry.
The UV sky background in each individual frame was determined by measuring fluxes in a number of -pixel boxes placed in source-free regions of the image. The average value of all the box fluxes was taken to be the sky value and was subtracted from each individual frame prior to co-adding them (Paper I). The sky is not uniform across the image, and this represents an additional source of uncertainty in the photometry. We accounted for this by measuring the rms scatter of the residual sky values in the co-added frames, defined to be the standard deviation of the distribution of box fluxes in source-free regions. The total error in each aperture flux measurement consists of Poisson noise of the source and sky and the rms scatter in the residual sky, all added in quadrature. Note that the SBC detector has no read noise. Flux errors in the optical photometry are small (a few percent at most), and the errors on the colors are dominated by the UV measurements.
To check for any zeropoint offset between the GALEX FUV and HST FUV filters,444Our adopted HST zeropoint was obtained at http://www.stsci.edu/hst/acs/analysis/zeropoints. we compared integrated magnitudes measured from the HST images to the GALEX GR6 “mag_auto” magnitudes. As seen in Figure 2, the agreement between the two measurements is generally good, with a median offset of HSTGALEX mag. Since the offset is much smaller than the FUV colors, no correction was made to the HST magnitudes. Note that the magnitudes in Figure 2 have not been corrected for Galactic extinction.

3. RESULTS
3.1. UV-Optical Color Profiles
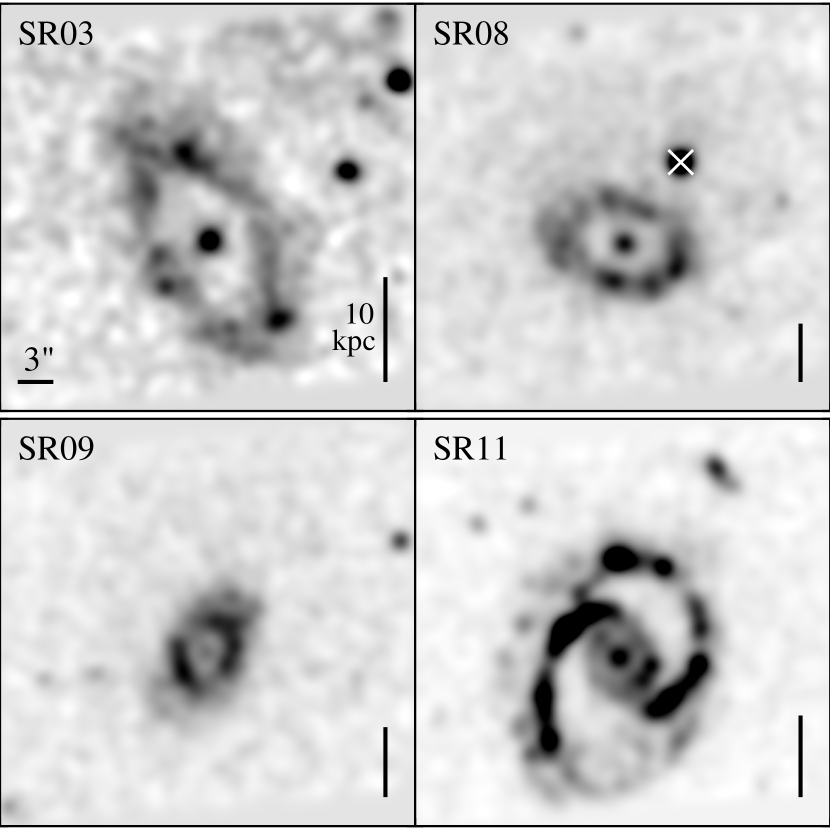
To give an idea of the UV morphologies seen in the ESF-ETGs, Figure 3 presents a montage of four ESF-ETGs in the sample. As discussed in Paper I, UV rings are seen in all but one of the ESF-ETGs, and clear spiral arms are found in two objects. Crucially, the UV emission is extended over tens of kpc in all cases. Compact, central UV emission is also seen in nearly all the ESF-ETGs. The reader is referred to Paper I for a compilation and discussion of the UV and optical images and morphologies of the complete sample.
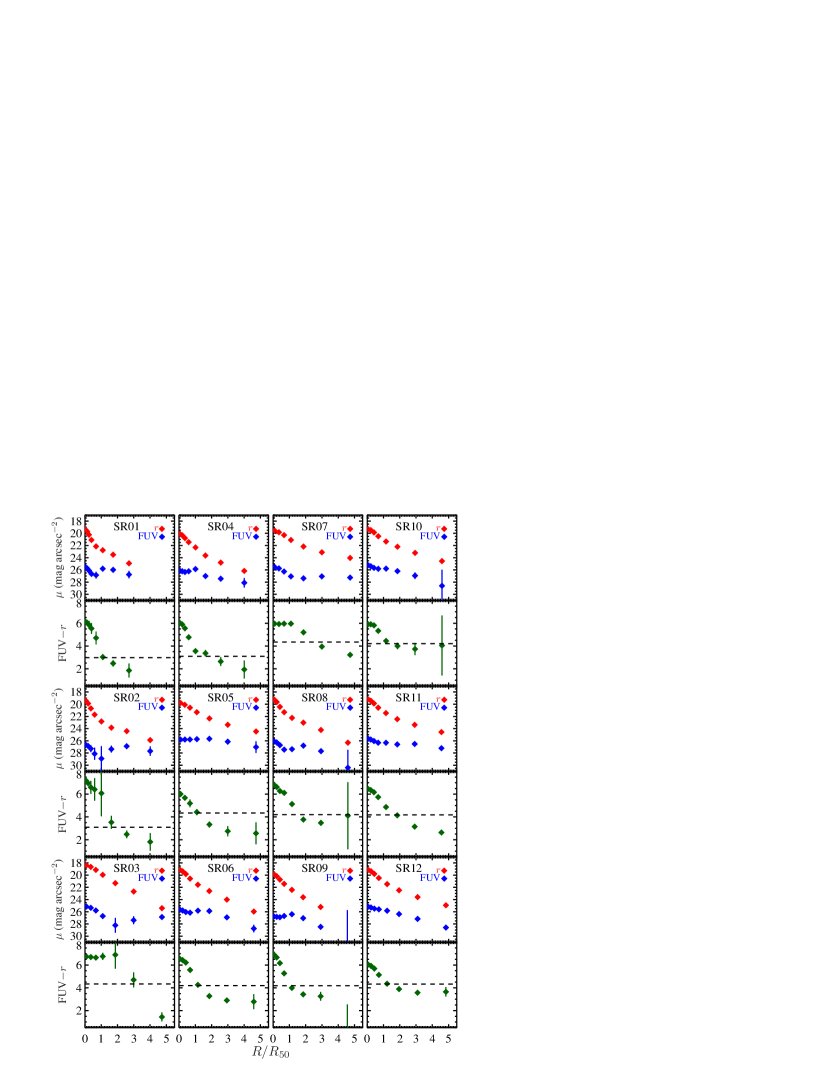
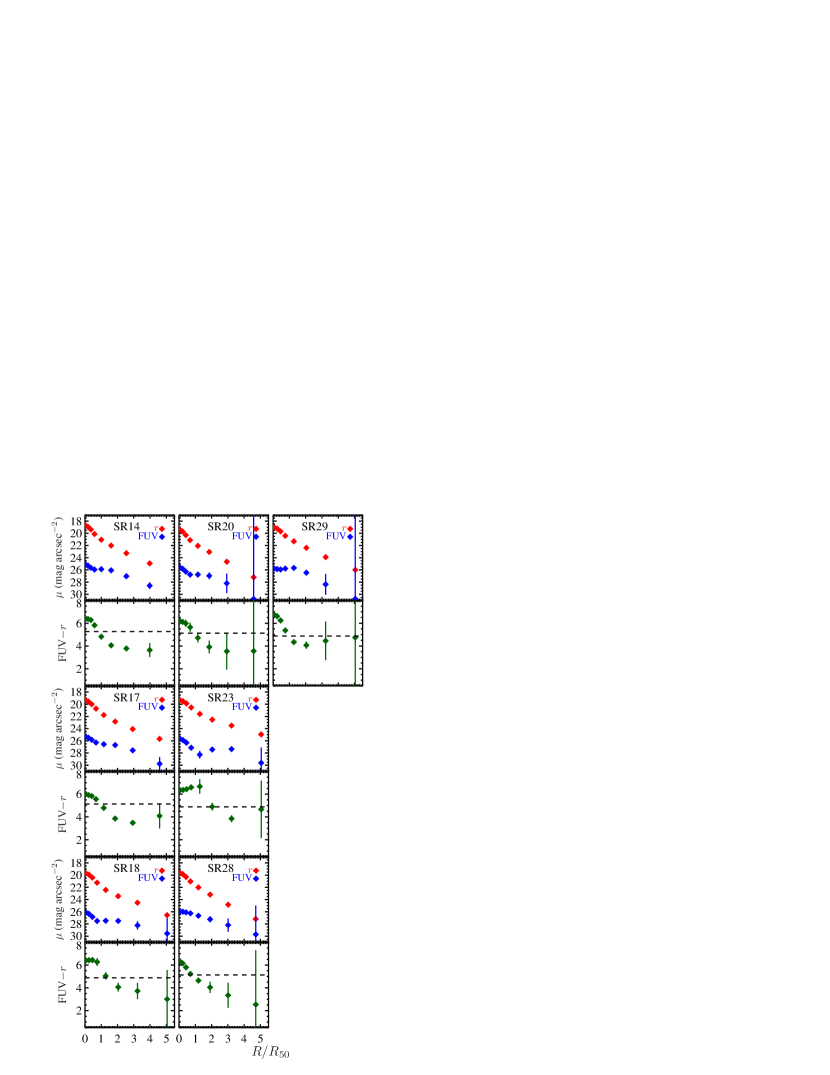
New in this paper are the SDSS -band and HST UV surface brightness and color profiles, presented in Figure 4. Surface brightness measurements are also listed in Table 2 for reference (negative fluxes are arbitrarily assigned a surface brightness of 35 mag arcsec-2). Since the surface brightness values are averages within each annulus, each point has been plotted at the midpoint of each annulus. To facilitate comparison between galaxies, the radial coordinate has been scaled to the Petrosian half-light radius () for each galaxy. The photometry quantitatively highlights the disconnect between optical and UV light in tracing young stars and underscores the leverage one gains with UV data when studying recent SF in ETGs. Compared to the -band surface brightness profiles, the UV profiles are much shallower in general, particularly in the outer parts. In principle, one could measure UV surface brightnesses to larger radii to investigate where the UV light falls off. However, larger apertures would often reach beyond the edge of the detector, making accurate sky measurements difficult, especially for the larger galaxies.
| Object | |||||||||
|---|---|---|---|---|---|---|---|---|---|
| SR01 | |||||||||
| SR02 | |||||||||
| SR03 | |||||||||
| SR04 | |||||||||
| SR05 | |||||||||
| SR06 | |||||||||
| SR07 | |||||||||
| SR08 | |||||||||
| SR09 | |||||||||
| SR10 | |||||||||
| SR11 | |||||||||
| SR12 | |||||||||
| SR14 | |||||||||
| SR17 | |||||||||
| SR18 | |||||||||
| SR20 | |||||||||
| SR23 | |||||||||
| SR28 | |||||||||
| SR29 | |||||||||
Note. — HST FUV and SDSS -band surface brightnesses (in mag arcsec-2) are measured in circular annuli with outer radii specified in the column headings. Measurements are corrected for Galactic extinction but are not -corrected. Negative fluxes are assigned the value .
Another feature seen in Figure 4 is the broad similarity in the overall shape of the color profiles of the ESF-ETGs. The FUV color profiles show that their centers are quite red: they typically have a color FUV, which is consistent with old, red sequence stellar populations (Figure 1; Rich et al., 2005; Donas et al., 2007). This is not too surprising given that the ESF-ETGs were selected to have no central emission. By contrast, their outer parts (, or kpc) show very blue FUV colors, typically between 2 and 4. These are values typical of star-forming, blue cloud galaxies (Figure 1). Note that, despite the visual prominence of the central UV emission in the images, it only accounts for of the total UV flux in each galaxy and negligibly contributes to the integrated FUV colors. A similar observation was made by Kauffmann et al. (2007), who showed that the UV flux in their sample of GV ETGs was primarily due to SF on extended scales, even in objects with AGN activity.
3.2. Stellar Population Analysis of the ESF-ETGs
The color profiles in Figure 4 quantitatively show that young stars exist in the outer disks of the ESF-ETGs, confirming the result in SR2010 and Paper I. However, one cannot immediately determine whether those stars represent the vestiges of the original, fading SF or whether those young stars were produced in a rejuvenated burst of SF following a quiescent phase. Fortunately, a key question that can be answered using broadband photometry is whether the outer disks consist purely of young stars or whether the young-star light is frosting on top of an older stellar population.
Figure 6 presents color-color diagrams showing the outer colors of the ESF-ETGs (magenta diamonds). Depending on the UV extent of each galaxy, the outer colors (FUV and ) were computed by adding up the flux within the annuli that enclosed the outer UV rings/arms. The typical range of radii was between 463 and 1142. Note that the outer colors have been corrected for Galactic extinction but have not been -corrected.

Included in Figure 6 is a selection of stellar population models constructed using the 2007 version of the Bruzual & Charlot (2003) synthesis code. The models were generated assuming (1) a Chabrier IMF, (2) solar metallicity, and (3) a formation age of 12 Gyr. The various tracks were chosen to represent a range of possible SF histories for the ESF-ETGs (discussed in Section 4). The blue and red tracks in the figure are two exponentially declining SF histories (-models), with e-folding times and 2 Gyr, respectively. The orange track describes a “double-” model: the first -model has Gyr on top of which a second Gyr model is added 10 Gyr later (which produces 7% of the total stellar mass). All three of these tracks include the two-component dust model of Charlot & Fall (2000). The default dust model parameters were chosen, i.e., the effective optical depth suffered by stars younger than yr is assumed to be , and the fraction of the attenuation due to the diffuse ISM is taken to be . Finally, the green track assumes an instantaneous burst at and a second instantaneous burst 0.25 Gyr before the epoch of observation (taken to be ) that produces 2% of the total stellar mass. This model is dust-free. For consistency with the ESF-ETG outer colors, which have not been -corrected, all the tracks show observed-frame colors at , the median redshift of the ESF-ETGs.
Before comparing to the data, we first discuss the behavior of the models themselves. The -models represent gradually declining SF and are meant to represent the gradual decline of SF expected in massive blue galaxies (e.g., Noeske et al., 2007). As Figure 6 shows, at a fixed age, a longer results in bluer colors. This is because the SF rate at a given age is higher in longer models, and thus the colors “hover” at bluer values for longer than a model with shorter . Overall, the -models span about 7 Gyr in age for the ESF-ETG color range plotted in Figure 6. The double- track is identical to the Gyr track up to Gyr, when the second episode of SF begins. The colors then become bluer before looping back and approaching the original Gyr track. In other words, the double- model is virtually indistinguishable from the single- model Gyr after the second SF episode begins.
By contrast, the behavior of the two-burst model is rather different and simulates the effect of rapidly rejuvenated SF in a quiescent galaxy. The second burst occurs on top of an evolved stellar population, and thus affects the FUV color (which is sensitive to young stars) more strongly than the color (which is dominated by older stars). This causes the track to rapidly redden in FUV as the OB stars die off while the optical color changes little. As seen in the figure, the FUV color reddens within Myr, implying that any significant bluing in the UV due to bursty SF would have to be short-lived.
What do the models tell us about the stellar populations in the outer disks of the ESF-ETGs? As seen in Figure 6(a), the outer ESF-ETG colors are generally consistent with the declining -models (both single- and double-) and imply intermediate to old ages for the underlying stellar populations in these galaxies. By contrast, the two-burst model colors are somewhat offset from the mean colors of the ESF-ETGs. One could argue that adjusting the mass fraction of the second burst (set to 2% in the figure) or incorporating dust reddening could bring the colors more in agreement. However, regardless of the values used, bursts evolve very quickly through the region occupied by the ESF-ETGs, and thus it is statistically unlikely that most ESF-ETGs are bursts unless they are exceedingly rare objects. We return to this issue in Section 3.4 and show that this is probably not the case.
Collectively, this comparison shows that the SF in the outer disks of the ESF-ETGs is taking place in regions with old stars. Moreover, it demonstrates that bursty rejuvenation is not likely responsible for the SF we see. This last point is consistent with SR2010’s selection against galaxies with post-starburst signatures or optical disturbances indicative of recent, short-duration bursts.
In addition to the model comparison above, it is useful to demonstrate the existence of old stellar populations in the ESF-ETG disks in an empirical manner. To that end, we now compare the outer disk colors of the ESF-ETGs to two sets of galaxies chosen from the SDSS master sample. These sets are indicated by the rectangles in Figure 1. The comparison sample in Figure 6(a) consists of high-mass () galaxies matched in redshift to the ESF-ETGs () that have the same integrated FUV color as the outer parts of the ESF-ETGs, namely FUV , i.e., they reside in the blue cloud. The integrated colors of these galaxies have been corrected for Galactic extinction but are not -corrected. We note that the -correction to is small, i.e., mag for FUV and mag for . As can be seen, the outer ESF-ETG colors are fully consistent with the integrated colors of these comparison galaxies. Because the latter are massive, they have significant old stellar populations, and hence red colors (the effect of dust attenuation is discussed below). This bolsters the conclusion from comparing to models above that old stars are present in the outer disks of the ESF-ETGs.
By contrast, the sample in Figure 6(b) is comprised of low-mass () blue cloud galaxies within the same redshift range as the ESF-ETGs (). Their colors seem systematically too blue compared to the ESF-ETGs, reflecting the fact that they have higher specific SF rates than their more massive counterparts (e.g., Salim et al., 2007). This results in a higher fraction of younger, and hence bluer, stars in the low-mass objects, driving their color blueward. Indeed, visual inspection of the SDSS color images of the low- and high-mass comparison galaxies clearly shows that the former have blue disks, while the latter have red bulges and disks. The point is that the integrated colors of more massive, optically redder comparison galaxies are a good match to the outer colors of the ESF-ETGs whereas the less massive, optically bluer comparison sample does not match. Thus we have seen that both data and theory lead to the same conclusion: old stars are abundant in the outer star-forming regions of the ESF-ETGs.
Our discussion so far has neglected the effects of dust attenuation on the observed colors of the comparison galaxies. Indeed, the amount of dust attenuation in SF galaxies increases with stellar mass (e.g., Brinchmann et al., 2004; Salim et al., 2007; Wuyts et al., 2011), potentially complicating our comparison with the ESF-ETGs, especially for the massive sample shown in Figure 6(a). We attempted to remove the most dust-reddened objects by excluding edge-on systems with axis ratio . This makes no difference in the distribution of points in Figure 6. In any case, assuming that the dust-corrected colors of the comparison galaxies are bluer than shown in Figure 6 only strengthens our conclusion that the outer disks of the ESF-ETGs contain old stars.
3.3. Stacked SDSS Spectra
The SDSS fiber spectra, which probe the central 3″ ( kpc at ), can provide additional insight into the stellar populations and any potential emission activity that may be responsible for the central UV light seen in nearly all the ESF-ETGs. Also, they can inform our discussion about how SF is evolving in the ESF-ETGs, particularly the possible role of AGN feedback in shutting down SF (e.g., Schawinski et al., 2007). SR2010 tentatively ascribed the central UV emission to weak AGN activity based on a stacked BPT classification. Stacking was necessary because the ESF-ETGs do not have securely detected emission lines, meaning any (potentially weak) emission features will not be readily apparent in the individual spectra.
We reach similar conclusions based on stacking the spectra themselves. The stacking method is detailed in Graves et al. (2009). Figure 7 shows the resulting stacked spectrum of the ESF-ETGs. Interestingly, weak emission lines due to [O II] and [N II] that were not apparent in the individual spectra are clearly evident in the stack. These emission lines are characteristic of LINER emission (e.g., Heckman, 1980; Yan et al., 2006; Graves et al., 2007). If LINERs are indeed a weak phase in the AGN life cycle, this might indicate that AGN feedback played a role in shutting down SF, at least in the centers of these galaxies. However, AGN feedback has historically been proposed as a mechanism that quenches SF globally in a galaxy, not just in the center (e.g., Di Matteo et al., 2005; Hopkins et al., 2006). Given the extended SF seen in the outer parts of the ESF-ETGs, it would appear that AGN feedback is most effective at removing (or heating up) the central gas and less so at disrupting SF in the outer parts. Interestingly, recent observations of X-ray-selected AGN hosts at may suggest that AGN feedback quenches SF only within the central kpc (Ammons et al., 2011).

It is also possible that the LINER emission observed in ESF-ETGs is unrelated to AGN (e.g., Filippenko, 2003). It has been suggested that LINER emission is dominated by emission from hot gas in the ISM ionized by extended UV sources, such as post-AGB stars, rather than an AGN (e.g., Binette et al., 1994; Goudfrooij et al., 1994; Sarzi et al., 2010; Yan & Blanton, 2011). In any case, the emission in the stacked spectrum is both weak and uncharacteristic of young stars, which is the point we wish to establish.
With our resolved photometry we are able to say more about the nature of the central UV emission in the ESF-ETGs. The central FUV colors of the ESF-ETGs (FUV ) in Figure 4 are consistent with old, red sequence galaxies (Figure 1; Rich et al., 2005; Donas et al., 2007). The possibility that LINER emission is due to ionization by old, UV-bright (e.g., post-AGB) stars bolsters the observation that the central UV emission is not due to recent SF. To summarize, the stacked spectra indicate weak LINER-like activity, but the red FUV colors do not require anything besides old UV upturn stars.
With spectra one can also compute mean ages of the central stellar populations from absorption features. To gain quantitative insight into the typical age of the stars in the central regions of the ESF-ETGs, the publicly available code EZ_Ages (Schiavon, 2007; Graves & Schiavon, 2008) was used to compute a mean luminosity-weighted age from the stacked spectrum. Stellar absorption templates are fit to the spectrum, and an age is derived based on the calculated strength of age-sensitive absorption features, such as H. Caution must be taken to account for any absorption line infill due to nearby emission. The H absorption line strength measured here was corrected for infill by first determining the EW of the [O III] emission [visible only in the continuum-subtracted spectrum (not shown)], then calculating the appropriate H correction using Equation (A1) of Appendix A in Graves & Faber (2010). The correction was subtracted from the H line strengths before estimating ages. The resulting mean luminosity-weighted age (determined using primarily H and Fe) of the central regions of the ESF-ETGs is Gyr. This derived age is younger than a pure, maximally old passively evolving stellar population, but it is consistent with light-weighted ages of the central regions of other ETGs in the local universe (e.g., Trager et al., 2000). Moreover, an age of Gyr is not consistent with any significant contribution from young stars. For example, the SAURON galaxies with recently formed young stellar populations have H-based light-weighted ages younger than Gyr (Kuntschner et al., 2010).
3.4. The SR2010 ESF-ETGs in Context
With their characteristic blue outer colors and distinctive UV rings, the ESF-ETGs represent a clearly identifiable stage of evolution of massive ETGs through the GV. While the UV properties of only a small number of ESF-ETGs have been presented in this work, it is useful, if possible, to place our results in the broader context of evolution through the GV. To do so requires answering two questions. First, are ESF-ETGs rare or common among the GV population? Second, what is the “residence time” of ESF-ETGs in the GV? The answer to the first question can help establish whether or not extended SF is a dominant phenomenon among GV galaxies. Answering the second question can help distinguish between plausible SF histories of the ESF-ETGs, such as those discussed in Section 3.2.
Accordingly, in this section a search is conducted for further potential ESF-ETG candidates in the SDSS master sample defined in Section 2.1. We first review the selection cuts made by SR2010 in defining their HST sample and explain the motivations behind them. Then we apply a modified version of the SR2010 cuts on the SDSS master sample and examine the properties of the resulting objects, many hundreds of which we also believe to be ESF-ETGs. Sources of contamination that need to be accounted for when counting GV galaxies are discussed, and a rough estimate of the fraction of ESF-ETGs in the GV is presented. This is followed by a discussion of the ESF-ETG GV residence time and its use in constraining potential SF histories for the ESF-ETGs.
3.4.1 SR2010’s Selection Criteria
At first blush, the small number of galaxies selected by SR2010 would seem to suggest that ESF-ETGs comprise an insignificant part of the GV. In the following sections we show that this is not the case. Recall that SR2010 selected an initial sample of objects with strong UV excess and no spectral signatures of SF or AGN activity starting with a cross-matched SDSS DR4/GALEX IR1.1 catalog (Seibert et al., 2005) containing 18,127 galaxies555This number includes the subset of galaxies with both NUV and FUV detections and redshift located within 055 of the center of the GALEX field of view. The catalog sky coverage is 645 deg2.. The second column of Table 3 shows the number of galaxies we obtain from the same catalog that satisfy each successive SR2010 cut, until the final sample is obtained. To review, the first cut made by SR2010 selected for ETGs by choosing galaxies with -band concentration . To exclude objects with emission due to SF or AGN, only galaxies in the “Unclassifiable” category as defined by Brinchmann et al. (2004) were kept (these are galaxies with generally weak emission). To further prune remaining galaxies with weak emission, SR2010 required H S/N and excluded any galaxies located within the LINER region of the BPT diagram, i.e., ([N II]/H) and ([O III]/H) , regardless of line S/N. Finally, a color cut was made to select galaxies with strong UV excess (FUV ). As can be seen in the second column of Table 3, their very small final sample is due mainly to the cuts on “Unclassifiable” galaxies and FUV color. We note that among these objects are galaxies with clear optical disturbances, late-type morphologies and post-starburst signatures. To arrive at their final sample of 30 objects, SR2010 excluded these contaminants. This is discussed further in Section 3.4.3.
| Cut | DR4/IR1.1aaSDSS/GALEX catalog from which SR2010 selected ESF-ETGs. | SDSS Master SamplebbSDSS DR7/GALEX GR6 catalog used in this work. |
|---|---|---|
| Initial SampleccRedshift , NUV- and FUV-detected in MIS, and within 055 of the center of the GALEX field of view. | 18127 (100%) | 31763 (100%) |
| Conc | 8119 (44.8%) | 15617 (49.2%) |
| “Unclassifiable”ddGalaxies lacking statistically significant emission lines according to Brinchmann et al. (2004). | 1819 (10.0%) | 4152 (13.1%) |
| H S/N eeA further cut to ensure weak emission; see text. | 1761 (9.7%) | 4026 (12.7%) |
| Not LINERff“Unclassifiable” galaxies outside the LINER region of the BPT diagram. | 1008 (5.6%) | 2338 (7.4%) |
| FUV | 67 (0.37%) | 186 (0.59%) |
We applied the SR2010 cuts on the SDSS master sample, which is based on SDSS DR7 and GALEX GR6 data and is roughly twice as large as the Seibert et al. (2005) dataset used by SR2010. This results in a sample of 186 galaxies, as shown in the third column of Table 3. Both samples include only galaxies with redshift that are detected in FUV at GALEX MIS depths. Starting with this larger sample yields a bigger bottom line, but apart from that the effect of the various cuts is very similar in the two samples. In other words, it appears that ESF-ETGs selected using the strict SR2010 criteria are still rather uncommon, comprising only of the entire SDSS master sample. It should be noted that the original goal of SR2010’s selection strategy was to study objects with unusually strong UV excess that was not obviously related to SF or AGN activity. Therefore, they purposely imposed very strict criteria on spectroscopic quiescence to reduce possible UV contamination from SF or AGN. Their selection criteria were not designed to obtain a complete sample of ESF-ETGs. To achieve that we modify some of their criteria below.
3.4.2 Searching for Additional ESF-ETGs in the Green Valley
The hallmark of ESF-ETGs is that they are characterized by extended SF in their outer parts, while their centers are devoid of SF. Nevertheless, as demonstrated in Section 3.3, their central regions may harbor weak emission consistent with LINERs. Regardless of the source of the LINER emission (Section 3.3), such emission may be a common feature of ESF-ETGs and may hold clues to their evolution through the GV. Thus a search for ESF-ETGs ought not to exclude a priori galaxies with weak (LINER) emission since such emission unlikely affects the UV flux (Section 3.3). Because SR2010 explicitly excluded galaxies with any central emission, their exclusion of LINERs probably also excluded many genuine non-star-forming galaxies. In what follows, we relax the SR2010 selection criteria to accept LINERs, and thereby demonstrate that a larger sample of ESF-candidates exists and that such a sample indeed shares many similarities with the ESF-ETGs observed by HST.
In selecting our new “ESF-candidate sample”, the most salient SR2010 selection criteria were retained, namely, the morphological cut (concentration ) and the FUV color cut (FUV ). However, we avoided selecting galaxies based on the spectral categories defined by Brinchmann et al. (2004), which relied on S/N cuts and BPT classification. Instead, weak central-star-forming galaxies were chosen based on H equivalent width (EW). Because the EW measures the continuum-normalized line strength, it can be used to compare the emission properties in galaxies with different intrinsic luminosities in a relatively uniform manner. Since we are interested in selecting (bright) galaxies with weak H emission, the EW provides a cleaner indicator of H line strength than a S/N cut on the emission line flux.
Shown in Figure 8(a) is the FUV vs. H EW distribution of the SDSS master sample, with the ESF-ETGs overplotted. We see that the ESF-ETGs lie within (or below) the GV in FUV (by selection) and also have low H EWs for their FUV color. The low EWs are consistent with SR2010’s selection against detectable emission lines using S/N cuts. The maximum H EW among the ESF-ETGs is approximately log H EW [Å] , and we adopt this as the upper boundary for the ESF-candidates. Thus our final sample of new ESF-candidate galaxies satisfies the following criteria: (1) FUV , (2) -band concentration666SR2010 selected galaxies using -band concentration. However, the difference between the - and -band concentrations is negligible. , and (3) log H EW . Because galaxies are now included regardless of spectral classification, the ESF-candidate sample includes objects spectroscopically categorized as LINERs but still excludes star-forming galaxies, which have higher H EWs. By casting a wider net, we now find that the ESF-candidate sample contains 1226 galaxies, almost seven times more than the SR2010 criteria returned. Moreover, like the ESF-ETGs, the ESF-candidate galaxies lie on the optical red sequence despite their blue FUV colors. Table 4 lists the number of galaxies remaining after each of the new selection cuts. Evidently including galaxies with weak emission yields many more galaxies.
| Cut | SDSS Master Sample |
|---|---|
| Initial Sample | 31763 (100%) |
| Conc | 15617 (49.2%) |
| log H EW | 6732 (21.2%) |
| FUV | 1226aaBefore correction for potential contamination, which reduces this number by half (Section 3.4.3). (3.9%) |
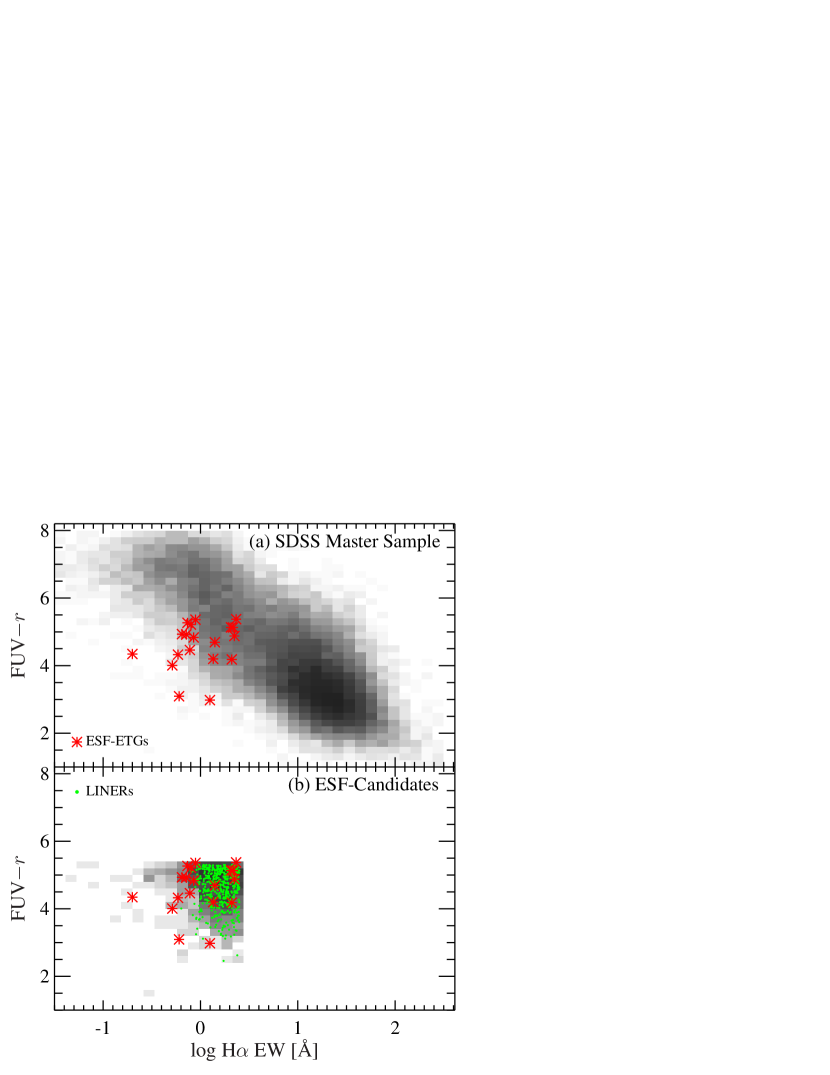
Figure 8(b) presents the distribution of the original ESF-ETGs and the new ESF-candidate sample in FUV vs. H EW. ESF-candidates classified as LINERs according to Brinchmann et al. (2004) are plotted as green dots. Three things to note are: (1) The new ESF-candidate sample has a similar distribution as the ESF-ETGs, (2) the LINERs make up a significant fraction of the ESF-candidate sample (), and (3) most of the original ESF-ETGs have H EWs comparable to the LINERs. Point (1) is simply due to selecting galaxies with similar color and EWs as the ESF-ETGs. Point (2) suggests that many of the ESF-candidates have weak emission that in the stronger cases has been classified as LINERs. Point (3) is consistent with the results of Section 3.3, where LINER emission lines, including H, were detected in the stacked spectrum of the ESF-ETGs. If one assumes that LINER activity is common in aging stellar populations, then it is reassuring to find that a significant fraction of the ESF-candidate sample are LINERs. Moreover, it is of interest to see whether the LINER galaxies have other properties in common with the ESF-ETGs.
A notable characteristic of the ESF-ETGs is their large UV sizes (SR2010). This is important because it may be a clue to the origin of the gas fueling the extended SF. SR2010 showed that the GALEX FUV FWHM sizes of the ESF-ETGs (roughly their UV diameters) tend to be larger than other GV galaxies with similar specific SF rates (their Figure 5). We obtain a similar result in Figure 9(a), where the distribution of FUV FWHM vs. FUV color is plotted in a similar style as Figure 8. Figure 9(a) shows the ESF-ETGs compared to the full SDSS master sample. Clearly, the ESF-ETGs are systematically larger than the average of all other GV galaxies of similar FUV color.
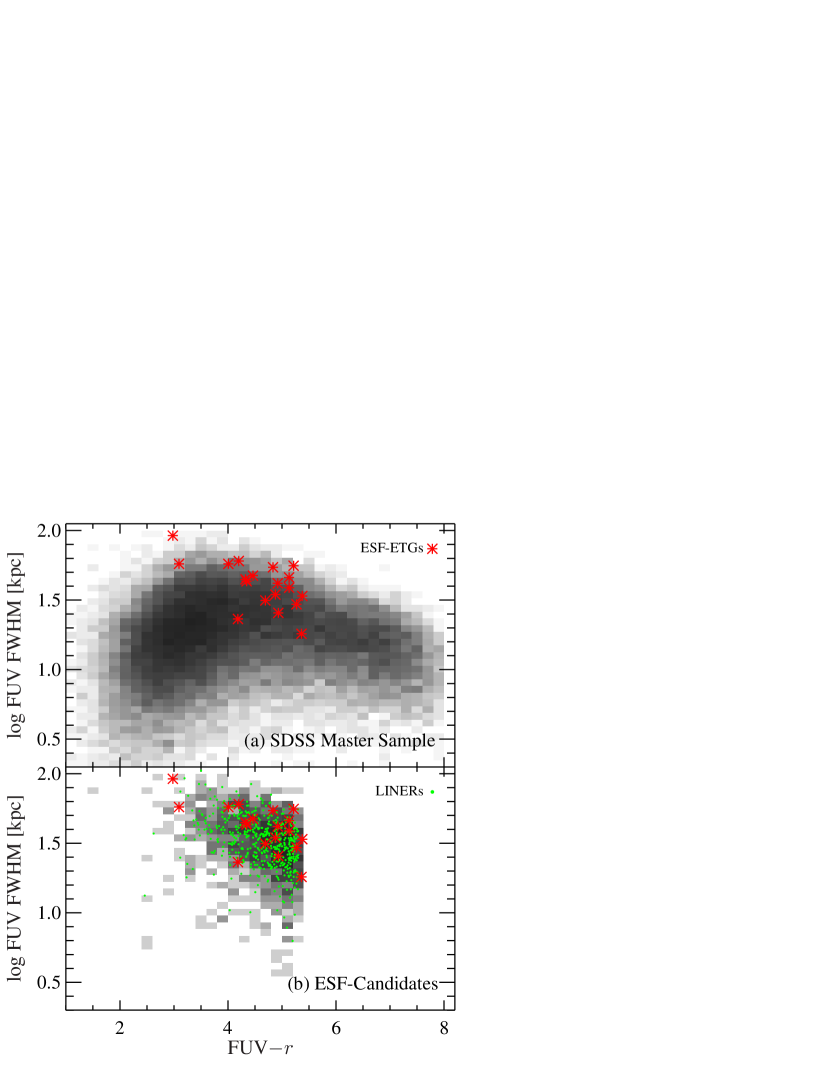
Since we aim to establish the similarity between the true ESF-ETGs and the ESF-candidates, we proceed to compare the UV sizes of the ESF-ETGs with the ESF-candidates. We refrain from making comparisons with the rest of the GV. Figure 9(b) shows the UV sizes of the ESF-ETGs and ESF-candidates. Since the latter were chosen in a similar way as the ESF-ETGs, it is not too surprising that their UV sizes are roughly consistent with those of the ESF-ETGs. The higher-H galaxies in the GV prove to have smaller UV sizes, and agreement with the ESF-ETG sample is improved when they are eliminated.
To quantify any remaining offset between the ESF-candidates and the ESF-ETGs, a linear fit was made to the ESF-candidate sample and the residuals in FUV FWHM of the ESF-ETGs were computed. The median FUV FWHM residual for the ESF-ETGs is dex. This implies that the ESF-ETGs are larger than the ESF-candidate galaxies. This slightly larger size may be because the ESF-ETGs were chosen to satisfy strict criteria that may have biased the sample to larger UV sizes, whereas the ESF-candidate sample has not been vetted in a similarly stringent manner. In particular, SR2010 excluded post-starburst galaxies and other blue interlopers, which tend to have smaller UV sizes. We also note that the LINERs in Figure 9(b) are not systematically larger or smaller than the ESF-candidates or the ESF-ETGs. This similarity between the ESF-ETGs and LINERs reinforces our assertion that many of the LINER galaxies have large UV diameters consistent with the ESF-ETGs, and that a larger population of GV galaxies with extended UV emission exists.
An additional comparison is made in Figure 10, where we show the distribution of FUV size as a function of stellar mass. Figure 10(a) shows the SDSS master sample, while Figure 10(b) plots only the ESF-candidate sample. A strong trend is apparent in both panels, with more massive galaxies having larger UV diameters. Notably, the ESF-ETGs are consistent with this trend. The median FUV FWHM residual of the ESF-ETGs from a linear fit to the ESF-candidate sample is now only dex, i.e., at fixed stellar mass, the ESF-ETGs are larger. This median UV size residual is smaller than in the previous comparison in Figure 9(b), which did not take into account the strong trend with stellar mass. Again, the existence of LINER galaxies with similarly large UV sizes strengthens our point that such UV-extended galaxies comprise a non-negligible fraction of massive GV ETGs (see below).
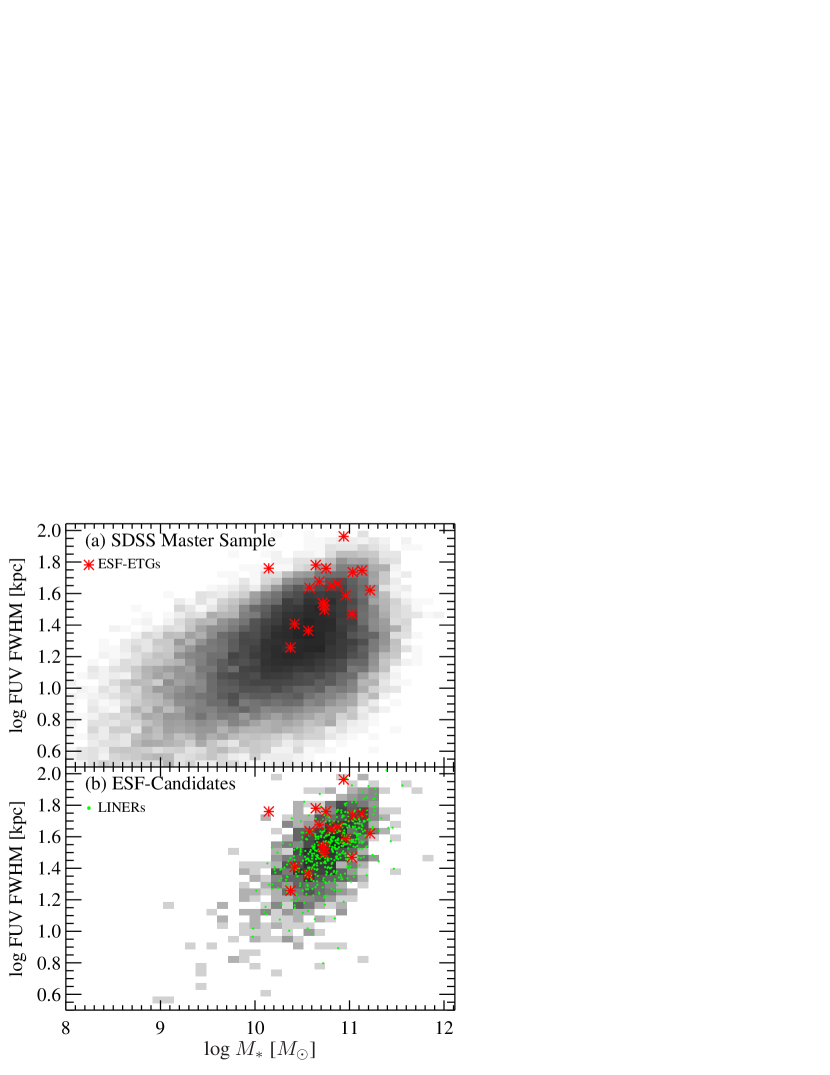
To summarize, we conclude that the stellar masses and UV sizes of the 19 HST ESF-ETGs are consistent with a much larger sample of ESF-candidate objects. This analysis lends support to our claim that the ESF-ETGs are only a small subset of a larger population of galaxies with similar properties.
3.4.3 The Contribution of ESF-ETGs to the GV
Investigating a sample with weak or marginally detected properties is always challenging because of the inherent inhomogeneities present within it due to measurement error or misidentification. The ESF-candidate sample is no exception, and properly screening its members is necessary to obtain useful results. Indeed, prior to formulating their final HST program, SR2010 visually inspected their candidate objects for possible contamination due to nearby companions, tidal disturbances, or post-starburst galaxies and wound up discarding half of them on these accounts. We repeated this exercise on their objects and found 20 contaminants, or of the sample. Most of the contamination is due to nearby UV-bright objects that in some cases induce a large () offset between the SDSS and GALEX positions. Five contaminants have post-starburst spectra and appear rather blue in optical color; these were eliminated by SR2010 because their UV emission is obviously due to SF. In addition to the 1/3 of the sample excluded by our new visual inspections, HST UV imaging revealed that about 1/3 of the actually imaged galaxies had UV morphologies unlike the ESF-ETGs; their UV emission is either compact or on small scales (Section 2 and Paper I). Taken together, these cuts imply that almost half of the galaxies in the initial sample of are not bona fide ESF-ETGs. Assuming that this fraction is representative of the larger ESF-candidate sample, the estimated number of true ESF-ETGs is reduced from to .
A key question is whether the ESF-candidate sample represents the typical galaxy evolving through the GV. However, determining this requires some care. Because the ESF-ETGs and the ESF-candidates have high stellar masses (), we can only make statements about the massive end of the GV. We define the massive end of the GV in FUV color-mass space to be bounded by FUV and . This mass range spans most of the ESF-ETGs and contains galaxies in the SDSS master sample. To avoid potential contamination due to dust-reddened, star-forming galaxies, we further exclude highly inclined galaxies with axis ratio . This is a significant cut that removes galaxies. This cut is motivated by the observation that nearly all of the ESF-ETGs tend to be nearly face-on, with (Table 1). To be consistent with the cuts made to identify massive GV galaxies, we cut the ESF-candidate sample to have the same range in stellar mass, FUV color, and axis ratio. This results in galaxies, and implies that the relative fraction of ESF-candidates among massive GV galaxies in this UV color-mass bin is . Exact numbers are presented in Table 5 for reference.
Note that this quoted fraction has not been corrected for contamination by superposed companions, post-starburst galaxies, etc., as discussed above. If such contamination is random, then the resulting fraction remains unchanged. However, if some forms of contamination affect the ESF-candidate sample more than the general GV population, then the fraction can be smaller. For example, post-starburst galaxies ought to be excluded from the ESF-candidates but not the general GV because they are truly transitioning from blue to red but are not ESF-ETGs. We have attempted to estimate this “differential contamination” by applying cuts to the ESF-candidate sample that mimic the results of the visual inspection described earlier. Specifically, contaminants are excluded if they satisfy any of the following conditions: (1) H to remove post-starbursts, (2) FUV-to-optical size ratio to remove galaxies without extended SF, or (3) GALEX-SDSS separation to remove obvious superpositions. Applying these cuts lowers the ESF-candidate fraction to , i.e., contamination may reduce the fraction by .
| Cut | SDSS Master Sample |
|---|---|
| Initial Sample | 31763 (100%) |
| Massive GVaaGalaxies with and . | 5199 (16.4%) |
| Face-on () | 3389 (10.7%) |
| ESF-CandidatesbbESF-candidates (Table 4) located in the massive GV. | 670 (2.1%) |
By defining a suitable ESF-candidate sample, we have shown that many other objects exist with similar properties (FUV color, H EW, stellar mass, and UV size) to the original ESF-ETGs. Within these selection cuts, ESF-candidates classified as LINERs have similar properties as well. This bolsters our belief that ESF-ETGs are accompanied by weak LINER-like emission. We have therefore shown that the 19 ESF-ETGs studied in this paper are part of a larger population of similar galaxies. Moreover, we have shown that extended SF in ETGs is not a rare phenomenon among massive GV galaxies.
3.4.4 Constraining the Timescale of Recent SF in the ESF-ETGs
In the previous section we showed that a modest fraction () of massive GV galaxies are likely to be ESF-ETGs. However, this by itself does not constrain the star formation timescale of the ESF-ETGs. This quantity is important as it will be used later to identify plausible SF histories for the ESF-ETGs, in particular focusing on the recent SF traced by the UV. In this section we estimate the contribution of rapid, bursty SF as triggered by a minor merger to the fraction of ETGs in the GV. The goal of this analysis is to determine if such bursty SF is sufficient to explain the abundance of ESF-candidates in the GV identified in the previous section.
The expected number of ETGs found in the GV due to minor-merger-driven SF is calculated as follows. We assume the progenitors are ETGs in the UV-optical red sequence (FUV ) or not detected at all in FUV. This color cut is made on the assumption that ESF-ETG progenitors were initially quiescent and not star-forming and that the subsequent, rejuvenated SF moved them back into the GV. The progenitors are restricted to galaxies with (1) , (2) concentration , and (3) axis ratio . These cuts are made to be consistent with the ESF-candidates, which are the presumed descendants. This gives 11875 galaxies.
The minor merger rate is estimated using the theoretical predictions given in Kaviraj et al. (2009). Specifically, a minor merger rate of 0.03 (1:10 mass ratio) is assumed. In addition we estimate the time spent in the GV due to enhanced SF to be Myr. This estimate assumes three pericentric passages of the satellite, each causing an enhancement of the SF rate (and bluer FUV colors) lasting for Myr (Kaviraj et al., 2009; Peirani et al., 2010). Note that the final coalescence is not included in this estimate because the resulting SF is expected to be centrally concentrated and hence unlike the SF seen in the ESF-ETGs. Combining these values, we estimate ETGs to be present in the GV due to (ring-like) minor-merger-driven SF. Compared with the 670 ESF-candidates identified in the previous section, we see that bursty SF resulting from minor mergers can only account for of ESF-candidates. It is interesting to note that this fraction is not too different from the differential contamination presented in the previous section. In other words, the contaminating galaxies are quite possibly a subset of the minor-merger-driven SF galaxies. Note that the above discussion is meant to constrain the role of bursty star formation due to minor mergers; we are not requiring that the gas fueling the observed SF cannot have come from minor mergers.
It should be noted that the 40% estimate is subject to uncertainties in both the merger rate and GV residence time. In particular, (minor) merger rates are uncertain at the factor of level at least (e.g., Hopkins et al., 2010; Lotz et al., 2011). Also, the GV residence time is sensitive to the duration of each burst of SF and the number of passages, which depend on the merger geometry, mass ratio, etc. (e.g., Cox et al., 2008; Peirani et al., 2010). It is difficult to quantify such uncertainties, and the 40% contribution estimated above should be viewed as a rough estimate at best. Thus we tentatively suggest that bursty SF is unlikely to be the dominant cause of the SF in the ESF-ETGs, though it cannot be firmly ruled out by this analysis. However, Section 4 below highlights other evidence that indicates that the SF in the majority of ESF-ETGs is likely due to more gradual processes.
4. HOW DO ESF-ETGs MOVE THROUGH THE GREEN VALLEY?
Given the photometric and spectroscopic results presented for the ESF-ETGs, along with the selection and examination of the ESF-candidates, we are now in a stronger position to interpret the recent SF observed in the ESF-ETGs. The main question motivating this study is whether the ESF-ETGs are fading out or are rejuvenated. This question is directly tied to how these galaxies are evolving through the GV. To provide a framework for discussion, we present three possible evolutionary scenarios to explain the SF in the ESF-ETGs: (1) rapid quenching, (2) disk rejuvenation (SF in a pre-existing disk), and (3) gradual decline. We evaluate the plausibility of each scenario in light of the results in this paper and Paper I. The present discussion supplements the close examination in Paper I of the origin of the gas fueling the extended SF in the ESF-ETGs.
(1) Rapid quenching. In this scenario, SF is quickly truncated as a result of a (gas-rich) major merger that triggers a rapid starburst and/or AGN. Centrally concentrated SF is expected to occur in galaxies undergoing such an event due to the funneling of gas toward the center during the merger (e.g., Hernquist & Mihos, 1995; Hopkins et al., 2006). The gas can also power an AGN that ejects any remaining gas out of the galaxy (Di Matteo et al., 2005). The timescale for SF is expected to be short (a few 100 Myr; Di Matteo et al., 2005; Hopkins et al., 2008), owing to the strong AGN feedback that effectively quenches any remaining SF. The resulting remnant is predicted to have spheroidal morphology. Note that this scenario applies equally well to a galaxy that is moving from the blue cloud to the red sequence for the first time or has been rejuvenated back into the GV.
Though it is possible that the ESF-ETGs have undergone rapid quenching in the past, the recent SF observed is unlikely to be related to the end phase of such an event. Their optical morphologies, while bulge-dominated, include a disk component, are undisturbed, and do not reveal any signs of recent mergers or interactions with nearby companions (SR17 is an exception; Paper I). In addition, we find that the stellar populations at the centers of the ESF-ETGs are uniformly old, arguing against centrally concentrated recent SF. There does exist evidence for rapid quenching of SF via major mergers in certain kinds of galaxies, notably post-starburst galaxies. However, the spectra of such objects show signatures of a few 100-Myr old stellar population superimposed on old stars (e.g., Quintero et al., 2004), and many are morphologically disturbed. In contrast, none of the SDSS spectra of the ESF-ETGs displays the strong Balmer lines characteristic of post-starbursts, as expected from how they were selected. We note that only five of the original 60 SR2010 candidates were excluded because they appeared to be post-starbursts based on their large H values; these may be the post-major merger objects. The lack of central SF in the ESF-ETGs is not too surprising given the SR2010 selection criteria, which selected galaxies without detectable emission in the centers yet had blue FUV colors. This unique combination of parameters is thus a useful method of finding GV galaxies dominated by extended UV emission.
Based on their undisturbed morphologies and lack of centrally concentrated SF, we conclude that the ESF-ETGs have not experienced recent rapid quenching and that their SF is the result of some other, less violent process. We are not implying, however, that such a scenario is impossible for at least some GV galaxies. Rapid quenching is seriously considered as the main channel for some galaxies to evolve onto the red sequence (Faber et al., 2007; Martin et al., 2007).
(2) Disk rejuvenation. In this scenario recent SF takes place in an existing (formerly quiescent) stellar disk, such as those found in S0 galaxies. The newly formed stars cause the FUV color to become bluer. Because the new young stars form on top of the existing old stellar population, galaxies undergoing disk rejuvenation would be expected to have similar colors to the outer colors seen in the ESF-ETGs in our sample. In the nearby universe, this phenomenon is exemplified by the discovery of extended-UV (XUV) disks (e.g., Thilker et al., 2005, 2007). XUV-disk galaxies are characterized by extended UV emission located beyond the SF threshold. In most cases, this translates to SF being located beyond the optical extent of the galaxy, though in some objects the XUV emission is found within the optical extent. XUV-disks have been found in galaxies of all Hubble types, notably even in E/S0 galaxies (Lemonias et al., 2011; Moffett et al., 2012). Thus it is possible that the ESF-ETGs are examples of early-type XUV-disks, especially since their SF occurs primarily in the outskirts of the optical disks (Figure 4; Paper I).
Thilker et al. (2007) adopted a threshold UV surface brightness of AB mag arcsec-2 to characterize XUV disks, which corresponds to a threshold SF surface density of . According to that criterion, our ESF-ETG UV disks hover near that level, as may be seen in Figure 4, thus qualifying them as XUV disks or very near that level. Indeed, a study of the space density of XUV-disk galaxies by Lemonias et al. (2011) has shown that XUV-disks are more common among red sequence and GV galaxies. In one respect, however, our galaxies differ strongly in that their outer FUV colors are a full 1.5-2.5 mag bluer than their integrated FUV colors. In Lemonias et al., by contrast, outer FUV colors correlate closely with integrated FUV colors, and there are no blue outer disks at all among their red galaxies (their Figure 12). Thus, it is not clear that they are detecting the same phenomenon that we are.
Different mechanisms can deliver gas into the outer regions of a galaxy and trigger disk rejuvenation. Lemonias et al. (2011) proposed that cold gas accretion from the intergalactic medium (IGM) is responsible for triggering SF in the XUV-disks. This picture is a possible manifestation of late-time cold mode accretion predicted in simulations (Kereš & Hernquist, 2009). In addition, minor, gas-rich mergers can also trigger recent SF in ETGs (Kaviraj et al., 2009), perhaps leading to disk rejuvenation in addition to nuclear SF.
Disk rejuvenation may be a viable explanation for the SF seen in at least some of the ESF-ETGs. All the ESF-ETGs in the sample are classified as S0 or later (Paper I), so the presence of extended UV emission is not unreasonable given the literature results discussed above. As discussed in Section 3.2, the outer disks of the ESF-ETGs contain a significant underlying old stellar population upon which new stars have formed. However, any disk rejuvenation cannot have been triggered recently or very rapidly. For one thing, the highly symmetric UV morphologies of the ESF-ETGs would require any gas to be resident in the galaxies for a few rotation periods, which in the outer parts is likely to exceed Gyr. IGM accretion is consistent with this picture as long as it occurs smoothly on extended timescales, allowing the gas to settle into an axisymmetric disk before forming stars.
In addition, as Figure 6 indicates, a burst superimposed on an old stellar population reddens too quickly. We roughly estimated in Section 3.4.4 that bursty SF due to minor mergers produces less than half the number of ESF-candidates identified in the GV (Section 3.4.3), tentatively suggesting that minor mergers are not the dominant cause of the SF in the ESF-ETGs. Moreover, the SF histories predicted from minor merger simulations are bursty with typical timescales of a few to several 100 Myr (Cox et al., 2008; Kaviraj et al., 2009). Also, the newly formed stars tend to be centrally concentrated (Cox et al., 2008; Peirani et al., 2010), in contrast with the red colors seen in the bulges of the ESF-ETGs (Figure 4). Taken together, these points suggest that disk rejuvenation is only viable if (1) the gas has not been recently accreted and (2) the resulting SF has been ongoing for an extended period of time.
In a study of the recent SF histories of SDSS galaxies, Kauffmann et al. (2006) hypothesized that galaxies above a transitional surface mass density experience intense bursty SF that consumes infalling gas on timescales of Gyr. Such (rejuvenated) SF is likely to drive galaxies from the red sequence into the green valley. The morphological and photometric data of the ESF-ETGs can provide useful constraints on this model. In particular, assuming a rotation speed of 200 km s-1 at a radius of 10 kpc, and hence a rotation period of 300 Myr, recently infalling gas would have experienced rotation periods in 1 Gyr. This is likely sufficient time for the gas to settle into an axisymmetric disk. The average galaxy would be observed halfway through this period, and one would expect to see a distribution of morphologies corresponding to various stages of gas rearrangement. However, we do not see such diversity in the UV morphologies of the ESF-ETGs. In addition, stellar population analysis of the outer disks (Section 3.2) indicates that SF in the outer parts of the ESF-ETGs takes place on timescales longer than 1 Gyr. Also, the similarity between the outer colors of the ESF-ETGs and massive blue cloud galaxies [where SF proceeds on Gyr timescales (Noeske et al., 2007)] points to a longer gas consumption timescale than that suggested by Kauffmann et al. (2006).
(3) Gradual decline. In this scenario, a galaxy’s original SF gradually shuts down as its existing gas supply is used to form stars (Noeske et al., 2007). No mergers or interactions are required to explain the recent SF, and the galaxy’s original (disky) morphology is preserved. This model reflects the general expectation that most galaxies are evolving from blue to red for the first time. Gradual decline implies that SF is steadily decreasing over time, and hence that there exists an underlying population of older stars.
While the timescale for evolution from blue to red is generally believed to be fairly rapid ( Gyr; Martin et al., 2007), it is certainly not expected that all galaxies need transition through the GV in such a rapid manner. Indeed, local observations have shown the existence of a population of galaxies in the GV, primarily S0s, whose cold gas properties imply a much longer GV residence time (e.g., van Driel & van Woerden, 1991; Noordermeer et al., 2005; Cortese & Hughes, 2009). Specifically, radio observations of S0s have revealed that some harbor large H I reservoirs containing of gas or more. The gas surface density in these reservoirs, , fall within the H I-to-H2 transition regime, where the SF rate declines non-linearly with (Krumholz et al., 2009). Specifically, the SF rate is predicted to be times lower than in normal spiral galaxies, i.e., . These results imply a gas consumption time of up to 10 Gyr in these gas-rich S0s. In other words, there likely exists a subpopulation of GV galaxies whose SF can persist at a very low level for a very long time.
We find this gradual decline scenario to be another possible explanation for the recent SF seen in the ESF-ETGs. Their undisturbed and symmetric morphologies indicate a lack of recent mergers or interactions. The blue outer disks plus red bulges are a possible extension of morphologies of galaxies slightly later along the Hubble sequence, which sometimes show a hole in their central gas distributions and a lack of young stars in their bulges (Pahre et al., 2004; Gil de Paz et al., 2007). Moreover, the H I distributions of the S0 galaxies described above are typically ring-like with central depressions in gas surface density (e.g., van Driel & van Woerden, 1991; del Río et al., 2004; Noordermeer et al., 2005). Moreover, GALEX imaging of some of these S0s show UV rings reminiscent of those seen in the ESF-ETGs (Cortese & Hughes, 2009). Thus it is conceivable that the ESF-ETGs harbor similar reservoirs of low-surface-density cold gas. Obtaining radio observations of the ESF-ETGs would be extremely useful in characterizing the amount and distribution of cold gas in these objects.
Finally, we showed in Section 3.2 that the stellar populations in the UV rings contain a significant contribution from old stars, and that their SF histories are consistent with fading -models. Assuming that the fading model applies to ESF-ETGs in general, and because fading is considered an important mode of evolution through the GV, one would expect to find a significant fraction of GV galaxies with ESF-like properties. Section 3.4.3 showed that of massive galaxies in the bluest part of the GV are ESF-candidates. Though not a majority in this region, ESF-candidates nonetheless make up a non-negligible portion of it, and we cannot rule out fading for at least a subset of these objects. We note that gas-rich GV galaxies comprise of the total GV sample presented in Cortese & Hughes (2009). The close agreement between their fraction and the ESF-ETG GV fraction found here is intriguing and indicates that gradual decline of SF on Gyr timescales should not be discounted as an important evolutionary path through the GV for some objects.
To summarize, only certain models for the SF in the ESF-ETGs survive comparison with the results presented in this paper. The viable models are the slow decline of the original SF and/or (non-bursty) disk rejuvenation. SR2010 and Paper I reach similar conclusions based on the integrated properties of the ESF-ETGs. In particular, both works found that the decline of the original SF is possible in a subset of the ESF-ETGs, and we come to a similar conclusion based on stellar population analysis of the outer disks of the ESF-ETGs.
SR2010 also argue that the SF in some of the ESF-ETGs is most consistent with rejuvenation because of their lower intrinsic dust content and larger-than-average UV sizes relative to the entire GV. While SR2010 supported rejuvenated SF, they were unable to constrain whether the necessary gas was accreted via mergers or directly from the IGM. We find that mergers (in the rapid quenching model) are unlikely to produce the observed morphologies and lack of central SF in the ESF-ETGs, but IGM accretion is permissible as long as it does not disrupt the galaxy and the resulting SF is not too recent and bursty. Paper I reaches a similar conclusion, finding that of the ESF-ETGs have UV and optical morphologies consistent with smooth IGM accretion. Rejuvenation is permitted as long as the new stars began forming long ago in a gradual manner. We have not been able to think of tests that could tell the difference, definitively, between this kind of “extended rejuvenation” and a simple decline of the existing SF.
5. SUMMARY AND CONCLUSIONS
This paper complements the work of SR2010 and Paper I. Using high-resolution UV imaging from HST and optical photometry from SDSS, we measure surface brightness and UV-optical color profiles of 19 ESF-ETGs selected from a cross-matched SDSS/GALEX catalog. These galaxies were selected to have high concentration, blue FUV color, and no detectable emission lines within the SDSS fiber. This combination of selection criteria yielded a sample dominated by objects with extended UV emission. Our main results are summarized below.
-
1.
The UV-optical color profiles of the ESF-ETGs all show red centers and blue outer parts, as expected given how they were selected. The central FUV colors are consistent with red sequence galaxies (FUV ), implying that the observed central UV emission is unlikely due to recently formed stars. By contrast, the outer FUV colors are all quite blue (FUV ), which is similar to star-forming, blue cloud galaxies. Blue colors together with well-formed UV structures in the regions of extended UV emission point to recent SF in the outer regions of these galaxies.
-
2.
A comparison of the outer colors of the ESF-ETGs with blue cloud galaxies in different mass ranges shows that the stellar populations in the outer disks of the ESF-ETGs contain many old stars. Additionally, their outer colors are consistent with gradually declining -models that indicate old stellar population ages, as well as with a “double-” model representing a prolonged rejuvenation event. The colors are also marginally consistent with a recent-burst model. However, we roughly estimate that a bursty SF history triggered by minor mergers underpredicts the number of ESF-candidates we find (Point 4 below) by a factor of .
-
3.
Based on stacked SDSS spectra, we determine a mean light-weighted age of Gyr for the centers of the ESF-ETGs, consistent with their red FUV colors. We find evidence for weak LINER-like emission (i.e., [O II] and [N II] emission) in the central regions of the ESF-ETGs. If the emission is due to weak AGN activity, this suggests that AGN feedback may have played a role in quenching SF, particularly in the centers of these objects. If instead the LINER emission is caused by gas ionization due to old stars, then this strengthens our conclusion that the centers are dominated by evolved stellar populations.
-
4.
By using a larger, updated SDSS/GALEX catalog, we find ESF-candidate galaxies that have similar spectral and structural properties to the ESF-ETGs. The key change in sample selection that yielded a much larger number of ESF-candidates was admitting all H-weak objects, including LINERs. We find that the ESF-candidates and true ESF-ETGs have similar distributions in FUV color, H EW, UV size, and stellar mass. A rough estimate suggests that ESF-ETGs comprise of massive GV galaxies in their UV color-mass range.
-
5.
We present three possible scenarios to explain the recent SF in the ESF-ETGs. Based on the results presented, we are able to rule out rapid quenching following a merger-induced starburst. However, our results are consistent with disk rejuvenation (via smooth IGM accretion) and/or the gradual decline of the original SF. Both scenarios can explain the regular morphologies of the ESF-ETGs and the presence of underlying stars in the regions of recent SF. The similarity of some ESF-ETGs to local, gas-rich S0s in the GV suggests that they are among a class of GV galaxies that may take Gyrs to fully quench and reach the red sequence.
The discovery of recent SF in ETGs has challenged traditional explanations of the evolution of these galaxies. Our understanding has benefitted greatly from all-sky surveys in the optical and, crucially, in the UV. The ability of the UV to detect even faint signatures of SF in seemingly quiescent objects highlights the richness and diversity of ETGs and raises many important questions, some of which we examined in this work. Our study of the ESF-ETGs represents an initial attempt to constrain the evolution of galaxies in the GV. Future work will systematically examine the properties and numbers of a wider range of galaxies to study the mass-dependent evolution of galaxies through the GV.
References
- Abazajian et al. (2009) Abazajian, K. N., et al. 2009, ApJS, 182, 543
- Agüeros et al. (2005) Agüeros, M. A., et al. 2005, AJ, 130, 1022
- Ammons et al. (2011) Ammons, S. M., et al. 2011, ApJ, 740, 3
- Bell et al. (2004) Bell, E. F., et al. 2004, ApJ, 608, 752
- Bertin & Arnouts (1996) Bertin, E., & Arnouts, S. 1996, A&AS, 117, 393
- Binette et al. (1994) Binette, L., Magris, C. G., Stasińska, G., & Bruzual, A. G. 1994, A&A, 292, 13
- Blanton & Roweis (2007) Blanton, M. R., & Roweis, S. 2007, AJ, 133, 734
- Brinchmann et al. (2004) Brinchmann, J., Charlot, S., White, S. D. M., Tremonti, C., Kauffmann, G., Heckman, T., & Brinkmann, J. 2004, MNRAS, 351, 1151
- Bruzual & Charlot (2003) Bruzual, G., & Charlot, S. 2003, MNRAS, 344, 1000
- Calzetti et al. (2000) Calzetti, D., Armus, L., Bohlin, R. C., Kinney, A. L., Koornneef, J., & Storchi-Bergmann, T. 2000, ApJ, 533, 682
- Catinella et al. (2010) Catinella, B., et al. 2010, MNRAS, 403, 683
- Charlot & Fall (2000) Charlot, S., & Fall, S. M. 2000, ApJ, 539, 718
- Code (1969) Code, A. D. 1969, PASP, 81, 475
- Cortese & Hughes (2009) Cortese, L., & Hughes, T. M. 2009, MNRAS, 400, 1225
- Cox et al. (2008) Cox, T. J., Jonsson, P., Somerville, R. S., Primack, J. R., & Dekel, A. 2008, MNRAS, 384, 386
- de Zeeuw et al. (2002) de Zeeuw, P. T., et al. 2002, MNRAS, 329, 513
- del Río et al. (2004) del Río, M. S., Brinks, E., & Cepa, J. 2004, AJ, 128, 89
- Di Matteo et al. (2005) Di Matteo, T., Springel, V., & Hernquist, L. 2005, Nature, 433, 604
- Donas et al. (2007) Donas, J., et al. 2007, ApJS, 173, 597
- Emsellem et al. (2007) Emsellem, E., et al. 2007, MNRAS, 379, 401
- Faber et al. (2007) Faber, S. M., et al. 2007, ApJ, 665, 265
- Filippenko (2003) Filippenko, A. V. 2003, in Astronomical Society of the Pacific Conference Series, Vol. 290, Active Galactic Nuclei: From Central Engine to Host Galaxy, ed. S. Collin, F. Combes, & I. Shlosman, 369–+
- Finkelman et al. (2011) Finkelman, I., Moiseev, A., Brosch, N., & Katkov, I. 2011, MNRAS, 418, 1834
- Gil de Paz et al. (2007) Gil de Paz, A., et al. 2007, ApJS, 173, 185
- Goudfrooij et al. (1994) Goudfrooij, P., Hansen, L., Jorgensen, H. E., & Norgaard-Nielsen, H. U. 1994, A&AS, 105, 341
- Graves & Faber (2010) Graves, G. J., & Faber, S. M. 2010, ApJ, 717, 803
- Graves et al. (2009) Graves, G. J., Faber, S. M., & Schiavon, R. P. 2009, ApJ, 693, 486
- Graves et al. (2007) Graves, G. J., Faber, S. M., Schiavon, R. P., & Yan, R. 2007, ApJ, 671, 243
- Graves & Schiavon (2008) Graves, G. J., & Schiavon, R. P. 2008, ApJS, 177, 446
- Heckman (1980) Heckman, T. M. 1980, A&A, 87, 152
- Hernquist & Mihos (1995) Hernquist, L., & Mihos, J. C. 1995, ApJ, 448, 41
- Hopkins et al. (2006) Hopkins, P. F., Hernquist, L., Cox, T. J., Di Matteo, T., Robertson, B., & Springel, V. 2006, ApJS, 163, 1
- Hopkins et al. (2008) Hopkins, P. F., Hernquist, L., Cox, T. J., & Kereš, D. 2008, ApJS, 175, 356
- Hopkins et al. (2010) Hopkins, P. F., et al. 2010, ApJ, 724, 915
- Kauffmann et al. (2006) Kauffmann, G., Heckman, T. M., De Lucia, G., Brinchmann, J., Charlot, S., Tremonti, C., White, S. D. M., & Brinkmann, J. 2006, MNRAS, 367, 1394
- Kauffmann et al. (2007) Kauffmann, G., et al. 2007, ApJS, 173, 357
- Kaviraj et al. (2009) Kaviraj, S., Peirani, S., Khochfar, S., Silk, J., & Kay, S. 2009, MNRAS, 394, 1713
- Kaviraj et al. (2007) Kaviraj, S., et al. 2007, ApJS, 173, 619
- Kereš & Hernquist (2009) Kereš, D., & Hernquist, L. 2009, ApJ, 700, L1
- Krumholz et al. (2009) Krumholz, M. R., McKee, C. F., & Tumlinson, J. 2009, ApJ, 699, 850
- Kuntschner et al. (2010) Kuntschner, H., et al. 2010, MNRAS, 408, 97
- Lemonias et al. (2011) Lemonias, J. J., et al. 2011, ApJ, 733, 74
- Lotz et al. (2011) Lotz, J. M., Jonsson, P., Cox, T. J., Croton, D., Primack, J. R., Somerville, R. S., & Stewart, K. 2011, ApJ, 742, 103
- Marino et al. (2011) Marino, A., Bianchi, L., Rampazzo, R., Thilker, D. A., Annibali, F., Bressan, A., & Buson, L. M. 2011, ApJ, 736, 154
- Martin et al. (2005) Martin, D. C., et al. 2005, ApJ, 619, L1
- Martin et al. (2007) —. 2007, ApJS, 173, 342
- Moffett et al. (2012) Moffett, A. J., Kannappan, S. J., Baker, A. J., & Laine, S. 2012, ApJ, 745, 34
- Morganti et al. (2006) Morganti, R., et al. 2006, MNRAS, 371, 157
- Noeske et al. (2007) Noeske, K. G., et al. 2007, ApJ, 660, L47
- Noordermeer et al. (2005) Noordermeer, E., van der Hulst, J. M., Sancisi, R., Swaters, R. A., & van Albada, T. S. 2005, A&A, 442, 137
- O’Connell (1999) O’Connell, R. W. 1999, ARA&A, 37, 603
- Oke (1974) Oke, J. B. 1974, ApJS, 27, 21
- Pahre et al. (2004) Pahre, M. A., Ashby, M. L. N., Fazio, G. G., & Willner, S. P. 2004, ApJS, 154, 235
- Peirani et al. (2010) Peirani, S., Crockett, R. M., Geen, S., Khochfar, S., Kaviraj, S., & Silk, J. 2010, MNRAS, 405, 2327
- Quintero et al. (2004) Quintero, A. D., et al. 2004, ApJ, 602, 190
- Rampazzo et al. (2007) Rampazzo, R., et al. 2007, MNRAS, 381, 245
- Rich et al. (2005) Rich, R. M., et al. 2005, ApJ, 619, L107
- Salim et al. (2012) Salim, S., Fang, J. J., Rich, R. M., Faber, S. M., & Thilker, D. A. 2012, ApJ, 755, 105
- Salim & Rich (2010) Salim, S., & Rich, R. M. 2010, ApJ, 714, L290
- Salim et al. (2007) Salim, S., et al. 2007, ApJS, 173, 267
- Sarzi et al. (2010) Sarzi, M., et al. 2010, MNRAS, 402, 2187
- Schawinski et al. (2007) Schawinski, K., Thomas, D., Sarzi, M., Maraston, C., Kaviraj, S., Joo, S.-J., Yi, S. K., & Silk, J. 2007, MNRAS, 382, 1415
- Schiavon (2007) Schiavon, R. P. 2007, ApJS, 171, 146
- Seibert et al. (2005) Seibert, M., et al. 2005, ApJ, 619, L23
- Shapiro et al. (2010) Shapiro, K. L., et al. 2010, MNRAS, 402, 2140
- Stoughton et al. (2002) Stoughton, C., et al. 2002, AJ, 123, 485
- Strateva et al. (2001) Strateva, I., et al. 2001, AJ, 122, 1861
- Thilker et al. (2005) Thilker, D. A., et al. 2005, ApJ, 619, L79
- Thilker et al. (2007) —. 2007, ApJS, 173, 538
- Thilker et al. (2010) —. 2010, ApJ, 714, L171
- Thomas et al. (2010) Thomas, D., Maraston, C., Schawinski, K., Sarzi, M., & Silk, J. 2010, MNRAS, 404, 1775
- Trager et al. (2000) Trager, S. C., Faber, S. M., Worthey, G., & González, J. J. 2000, AJ, 119, 1645
- van Driel & van Woerden (1991) van Driel, W., & van Woerden, H. 1991, A&A, 243, 71
- Wang et al. (2011) Wang, J., et al. 2011, MNRAS, 412, 1081
- Wuyts et al. (2011) Wuyts, S., et al. 2011, ApJ, 742, 96
- Yan & Blanton (2011) Yan, R., & Blanton, M. R. 2011, ArXiv e-prints
- Yan et al. (2006) Yan, R., Newman, J. A., Faber, S. M., Konidaris, N., Koo, D., & Davis, M. 2006, ApJ, 648, 281
- Yi et al. (2005) Yi, S. K., et al. 2005, ApJ, 619, L111