A three-dimensional view of the remnant of Nova Persei 1901 (GK Per)
Abstract
We present a kinematical study of the optical ejecta of GK Per. It is based on proper motions measurements of 282 knots from 20 images spanning 25 years. Doppler-shifts are also computed for 217 knots. The combination of proper motions and radial velocities allows a unique 3-D view of the ejecta to be obtained. The main results are: (1) the outflow is a thick shell in which knots expand with a significant range of velocities, mostly between 600 and 1000 km s-1; (2) kinematical ages indicate that knots have suffered only a modest deceleration since their ejection a century ago; (3) no evidence for anisotropy in the expansion rate is found; (4) velocity vectors are generally aligned along the radial direction but a symmetric pattern of non-radial velocities is also observed at specific directions; (5) the total +[N II] flux has been linearly decreasing at a rate of 2.6% per year in the last decade. The Eastern nebular side is fading at a slower rate than the Western one. Some of the knots displayed a rapid change of brightness during the 2004-2011 period. Over a longer timescale, a progressive circularization and homogenization of the nebula is taking place; (6) a kinematic distance of 40030 pc is determined. These results raise some problems to the previous interpretations of the evolution of GK Per. In particular, the idea of a strong interaction of the outflow with the surrounding medium in the Southwest quadrant is not supported by our data.
1 INTRODUCTION
Nova Persei 1901 (GK Per) was discovered by Anderson in 1901 February 21 at a visual magnitude of 2.7. Only one day before, its brightness must have been fainter than 12 mag (Williams, 1901). It reached the maximum light on February 22 when it was as bright as Vega (0.2 mag). GK Per was the first object around which superluminal light echoes were detected (e.g. Ritchey 1902). The actual ejecta of the nova outburst was discovered in 1916 by Barnard (1916) and is still easily observable now: indeed, it is considered to be the longest lived and most energetic nova remnant ever found.
The earliest optical images of the remnant showed an emission only in the Southwest (SW) side of the remnant (e.g. Seaquist et al. 1989). Gradually more material became visible around the central source, however, the asymmetric nature of the remnant has remained. Radio observations obtained during 1984–1986 showed that the SW quadrant of the remnant is the source of non-thermal (synchrotron) emission (Seaquist et al., 1989). This would be caused by particle acceleration and enhanced magnetic fields in a fast shock where the expelled matter is meeting some pre-existing material, most probably the result of previous mass ejections from the system, possibly an ancient planetary nebula (Bode et al. 2004). This scenario is supported by the analysis of the X-ray emission from the remnant (Balman, 2005). A lumpy, highly asymmetric X-ray nebula is observed, with brightness enhancement in the SW quadrant and wing-like extensions in the Southeast (SE) and Northwest (NW) directions. It is concluded that a density gradient in the circumstellar medium causes the expansion of the X-ray shell to be faster in the NW and SE directions, reaching velocities as high as 2600 - 2800 km s-1, than toward the SW, where velocities are less than half of that, around 1100 km s-1. This strong interaction is expected to cause deceleration of the expansion of the SW part of the outflow (Bode et al., 2004).
At a distance of half a kiloparsec (e.g. McLaughlin 1960) and with an expansion velocity of a thousand km s-1, the apparent growth of the nebula is about one arcsec per year, which is easily resolvable from ground-based optical imagery even on a timescale of few months. Therefore GK Per offers the opportunity to study the evolution of a stellar outflow in real-time, and to determine not only the expansion velocities but also their derivatives (i.e. acceleration, thus the forces at work), or deviations from pure radial expansion, an important information that is generally not available for dynamical studies of astrophysical outflows. If the expansion in the plane of the sky is coupled with Doppler shift velocities, information about five of the six dimensions of the phase-space is gained, and an almost complete dynamical picture can be drawn. For these reasons, starting on 2004 we embarked in a program of frequent imaging monitoring of the expansion of the GK Per remnant. We present here the results of the work. Doppler shift velocities of 217 knots from long-slit spectroscopy are combined with high-precision measurements of the motion in the plane of the sky for 282 knots. The latter ones are computed using good-quality, ground-based +[NII] images spanning 25 years, with a particularly intensive time coverage since 2004.
At the beginning of the article we describe our data and archival data. Then designations used in this article are given (Section 4). Proper motions and radial velocities for individual knots are discussed in Section 5 and 6, and the kinematical analysis is presented in Section 7. Section 8 presents the brightness evolution of the nebula, and Section 9 presents the discussion.
2 OBSERVATIONS AND DATA REDUCTION
2.1 New Imaging
Most of the imaging was carried out at the 2.5m Isaac Newton Telescope (INT) at the Observatorio del Roque de los Muchachos (ORM), La Palma, Spain. Images were taken with the Wide Field Camera (WFC) and a narrow band filter having a central wavelength of 6568 Å and a bandpass of 95 Å. The pixel scale is pix-1.
Other images were taken with the Andalucia Faint Object Spectrograph and Camera (ALFOSC) at the 2.6m Nordic Optical Telescope (NOT) of the ORM. An filter (6577/180 Å) was used, and the pixel scale was pix-1. Both the INT and NOT filters are broad enough to include the emission from the [NII] 6548 Å and 6583 Å doublet, which are the strongest optical emission lines in the ejecta, and to cover its whole radial velocity range ( km s-1).
All images were obtained with a seeing better than 1.3 arcsec full-width at half-maximum (FWHM).
2.1.1 Archival imaging
We also searched for archival images of the nebula. INT images obtained on 1999 (Bode et al., 2004) with the WFC, and on 1987 (Seaquist et al., 1989) with the Prime Focus Cone Unit (PFCU, pixel scale pix-1) were downloaded from the Isaac Newton Group archive. The 1999 data have been obtained with the same filter as our recent INT+WFC observations. The 1987 frame was observed in a broadband R filter.
The [NII] Hubble Space Telescope (HST) 1995 and 1997 images discussed by Shara et al. (2012) were downloaded from the MAST public archive. They were obtained with the Wide Field Planetary Camera 2 (WFPC2): the relatively large remnant fills the field of view of the camera, and is sampled at a pix-1 by the WF detectors, and pix-1 by the PC CCD. In both epochs, the filter F658N was used, which has a central wavelength 6590 Å and a bandpass of 22 Å. This is narrower than the range covered by the ejecta and some knots with the most extreme radial velocity shifts are missed.
The Digitized Sky Survey (DSS) images from the Palomar 48-inch Samuel Oschin telescope (Pal48) obtained on 1953 (pixel scale pix-1) and 1989 (pixel scale pix-1) were retrieved via the Aladin interface. In both cases observations were done on red-sensitive photographic plates with a bandpass approximately equivalent to an R filter. In 1953 a plate Kodak 103a-E and in 1989 a IIIaF was used. The 1953 image is used for visual comparison with the recent images, but not used for any quantitative measurements. The 1989 image could instead be used to measure the position of several knots recognized in our most recent imagery.
The log of all the imaging observations is presented in Table 1.
| Date | JD | Telescope+ | Filter | Total exp. | Number | Original seeing |
|---|---|---|---|---|---|---|
| Instrument | CW/FWHM (Å) | time (sec) | of frames | (arcsec) | ||
| 1953-01-10 | 2434387.62 | Pal48 | phot. plate | 2400 | 1 | 5.0 |
| 1987-07-27aaPublished in Seaquist et al. (1989) | 2447003.69 | INT+PFCU | R | 300 | 1 | 2.8 |
| 1989-10-05 | 2447804.87 | Pal48 | phot. plate | 5100 | 1 | 4.9 |
| 1995-11-08bbPublished in Shara et al. (2012) | 2450030.42 | HST+WFPC2 | 6590/22 | 1400 | 2 | 0.2 |
| 1997-01-08bbPublished in Shara et al. (2012) | 2450457.18 | HST+WFPC2 | 6590/22 | 1200 | 2 | 0.2 |
| 1999-11-30∗ccPublished in Bode et al. (2004) | 2451513.56 | INT+WFC | 6568/95 | 7026 | 3 | 2.3 |
| 2004-01-29∗ | 2453034.37 | INT+WFC | 6568/95 | 900 | 3 | 1.2 |
| 2004-08-04∗ | 2453222.66 | INT+WFC | 6568/95 | 1500 | 5 | 1.2 |
| 2004-09-03∗ | 2453252.67 | INT+WFC | 6568/95 | 1500 | 5 | 1.1 |
| 2004-12-30∗ | 2453370.43 | INT+WFC | 6568/95 | 1200 | 4 | 1.1 |
| 2005-09-16∗ | 2453630.72 | INT+WFC | 6568/95 | 900 | 3 | 1.0 |
| 2006-10-12∗ | 2454021.53 | INT+WFC | 6568/95 | 1200 | 4 | 1.0 |
| 2007-01-04∗ | 2454105.49 | INT+WFC | 6568/95 | 300 | 1 | 1.0 |
| 2007-03-01∗ | 2454161.42 | INT+WFC | 6568/95 | 2100 | 7 | 1.2 |
| 2007-09-03 | 2454347.68 | NOT+ALFOSC | 6577/180 | 1800 | 3 | 0.6 |
| 2007-09-05 | 2454349.71 | NOT+ALFOSC | 6577/180 | 1800 | 3 | 0.5 |
| 2007-09-07∗ | 2454351.74 | INT+WFC | 6568/95 | 1200 | 4 | 1.1 |
| 2008-01-08∗ | 2454474.42 | INT+WFC | 6568/95 | 1200 | 4 | 0.8 |
| 2008-08-19∗ | 2454698.69 | INT+WFC | 6568/95 | 4650 | 31 | 1.1 |
| 2008-09-12 | 2454722.70 | INT+WFC | 6568/95 | 1200 | 4 | 1.3 |
| 2008-11-14∗ | 2454785.49 | INT+WFC | 6568/95 | 1500 | 5 | 1.2 |
| 2009-02-11 | 2454874.43 | NOT+ALFOSC | 6577/180 | 1200 | 2 | 0.8 |
| 2009-12-08 | 2455174.48 | INT+WFC | 6568/95 | 300 | 1 | 1.3 |
| 2010-02-09∗ | 2455237.37 | INT+WFC | 6568/95 | 1500 | 5 | 0.9 |
| 2011-12-13∗ | 2455909.41 | INT+WFC | 6568/95 | 2700 | 9 | 0.8 |
Note. — The date indicates the start of observing night in the format yyyy-mm-dd. The date marked in boldface corresponds to the image that was used as reference for the astrometry and flux match of all images. Images from all dates marked with ∗ were flux and PSF matched with the reference image. For 1999 only flux match was done due to its modest seeing. JD is the Julian Date at mid point of observations. In column 6 is the number of frames added together.
2.1.2 Imaging data reduction
The basic reduction (bias, flat field, combination of sub-exposures, and cosmics removal) of most of the images was done using standard routines in IRAF111IRAF is distributed by the National Optical Astronomy Observatory, which is operated by the Association of Universities for Research in Astronomy (AURA) under cooperative agreement with the National Science Foundation.. HST data were reduced using tasks in the package dither. All the frames were cropped to the same field of view (FOV) of 6.4x6.4 arcmin2 around the central star, except for the data from 1987, 1995, and 1997 which originally had a smaller FOV.
The next step was to carefully register all images to the same astrometric reference frame using stars from USNO-B1.0 catalogue with proper motion errors smaller than yr-1. About sixty stars were used in every frame, except in the older frames which had worse seeing and smaller FOV. Our first INT image, obtained on 20040129, was chosen to be the reference frame. The Python based Kapteyn Package was used to get the reference frame FITS header world coordinate system applied pixel-by-pixel to the reference frame. The other images were pixel-by-pixel matched to the reference frame using tasks wcsxymatch, geomap, and geotran in IRAF. The latter put all the frames in the same pixel scale of the reference image, pix-1. Results were checked using some twenty stars in the proximity or inside the remnant. The standard deviation of the position of these stars from the reference frame in the and directions is 0.08 arcsec except for the images taken before 2004 where it is occasionally slightly larger. We adopt this figure as representative of the uncertainty introduced by the astrometric registration of images of different epochs.
To investigate brightness variations of the remnant, all the INT+WFC frames marked with ∗ in Table 1, were also flux matched. First, all the frames were degraded down to seeing of the reference frame, 1.2 arcsec. Secondly, frames were flux matched using forty-eight well exposed stars in the FOV. No stars inside the remnant were used to avoid possible contamination from the moving knots. The rms of fluxes of the reference stars on different frames is 1.3 %.
2.2 Spectroscopy
Medium-resolution, long-slit spectra of the nebula were obtained during two observing periods. In 2007 January, the INT+IDS (Intermediate Dispersion Spectrograph) with grating R1200Y and a slit was used. This configuration covers a spectral range from 5730 Å to 7610 Å at a dispersion of 0.47 Å pix-1. In 2007 September, the NOT+ALFOSC with grism #17 and slit was used, giving spectral range from 6350 Å to 6850 Å, and a dispersion of 0.26 Å pix-1. The spectrographs slit was oriented at a dozen of different position angles with the aim to cover as many knots as possible. Details of the spectroscopic observations, including the orientation of the slit, the exposure times, and the spectral resolution with the adopted slit widths, can be found in Table 2. These data were reduced and wavelength calibrated using the standard routines in the package longslit in IRAF.
| Date | Telescope+ | Slit P.A. | Total exp. | Number | Resolution | Spectral range |
|---|---|---|---|---|---|---|
| Instrument | () | time (sec) | of frames | (Å) | (Å) | |
| 2007-01-13 | INT+IDS | 22.5 | 3600 | 2 | 1.3 | 5730 – 7610 |
| 48 | 3600 | 2 | ||||
| 315 | 1800 | 1 | ||||
| 2007-01-14 | INT+IDS | 69 | 1800 | 1 | 1.3 | 5730 – 7610 |
| 293 | 3600 | 2 | ||||
| 334 | 3600 | 2 | ||||
| 2007-09-03 | NOT+ALFOSC | 31 | 3600 | 2 | 0.7 | 6350 – 6850 |
| 2007-09-04 | NOT+ALFOSC | 86 | 1800 | 1 | 0.7 | 6350 – 6850 |
| 107 | 1500 | 1 | ||||
| 312 | 1800 | 1 | ||||
| 2007-09-05 | NOT+ALFOSC | 49 | 1800 | 1 | 0.7 | 6350 – 6850 |
| 173 | 1800 | 1 |
Note. — P.A. is measured from North to East. Column 5 indicates a number of frames added together. See text for more details.
3 DESCRIPTION OF THE NEBULA
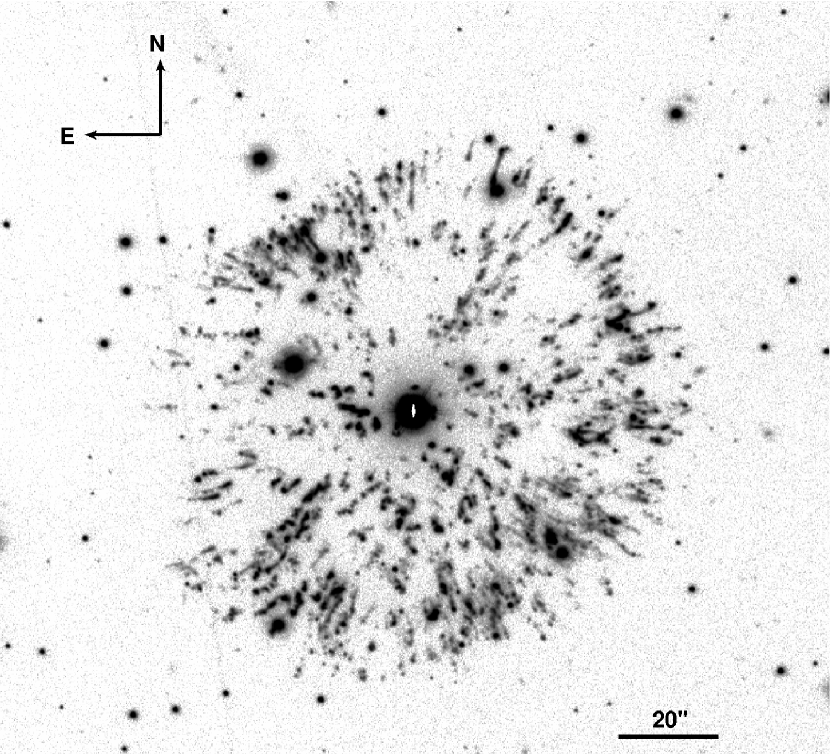
The optical nebula of GK Per, displayed in Figure 1, has a roundish, knotty morphology. Some deviation from the circular symmetry is however visible because the diameter of the nebula in the NE-SW direction is smaller ( as measured in the 2011 image) than in the NW-SE direction (). As described in details by Shara et al. (2012), the nebula is composed of hundreds of knots and filaments of different sizes and brightnesses. Many of the knots have tails pointing either toward or away from the central star. Shara et al. (2012) counted 937 knots in their HST images. Some of them are blended in our lower-resolution ground-based images. On the other hand, the limited bandpass of the [NII] F658N HST filter makes that some knots with the largest Doppler-shift displacements, which owing to the projection effects are located near the center of the remnant, are missed in the HST images.
4 GEOMETRICAL DESIGNATIONS
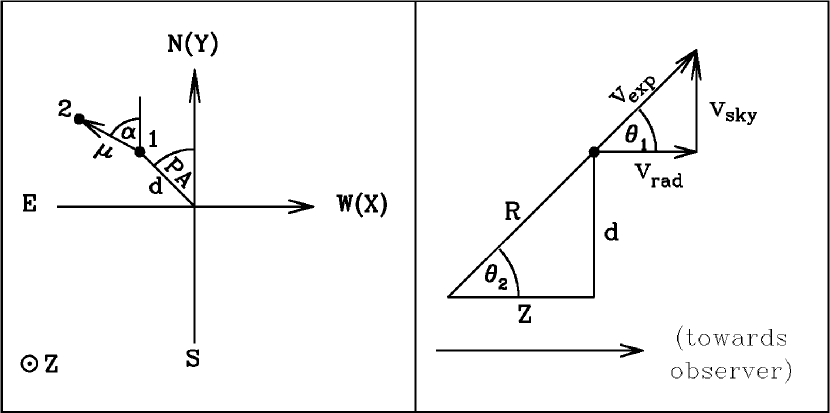
Throughout this article we use the designations as illustrated in Figure 2. In its left panel, we plot a view in the plane of the sky, where the line of sight corresponds to the axis and is perpendicular to the plane of the paper. The axis points toward West, and the axis to North (up). Points 1 and 2 indicate a knot’s position at two different epochs. The displacement over one year (proper motion) is indicated by [arcsec yr-1], and its angle in the plane of the sky is . PA indicates the position angle of the knot with respect to the central star as measured on our 20040129 frame. Both and PA are measured from North to East counterclockwise. The apparent distance of the knot from the central star in the plane of the sky is named as .
When deprojecting the observed positions, each knot has a spatial distance from the central source (right panel of the Figure 2). The plane indicated in the figure is defined by the central star, the observer, and the knot considered: it is therefore perpendicular to the XY plane, but changes depending on the knot under consideration. The speed of the knot is indicated by , and its components along the line of sight (radial velocity) and in the plane of the sky (tangential velocity) are indicated by and , respectively. The angle between the line of sight and the velocity vector is . The angle that the line joining the central star with the knot forms with the line of sight is : in the case of purely radial expansion, . Both angles are measured from the line of sight toward the velocity vector.
5 PROPER MOTIONS
Our multi-epoch imaging allows a precise determination of the apparent expansion of the GK Per nebula in the plane of the sky. This is illustrated in the video in Figure 3 (only available in the electronic version of the article). The animation includes the early photographic and CCD images, astrometrically matched to the recent ones but in an arbitrary intensity scale and with a generally poor resolution, as well as a selection of the best INT images in the sequence of highly homogeneous data taken starting on 2004, in the same linear intensity scale. In the latter part of the sequence, not only the overall expansion of the outflow is clearly revealed, but also changes in brightness of some of the knots, as it will be discussed in the Section 8.
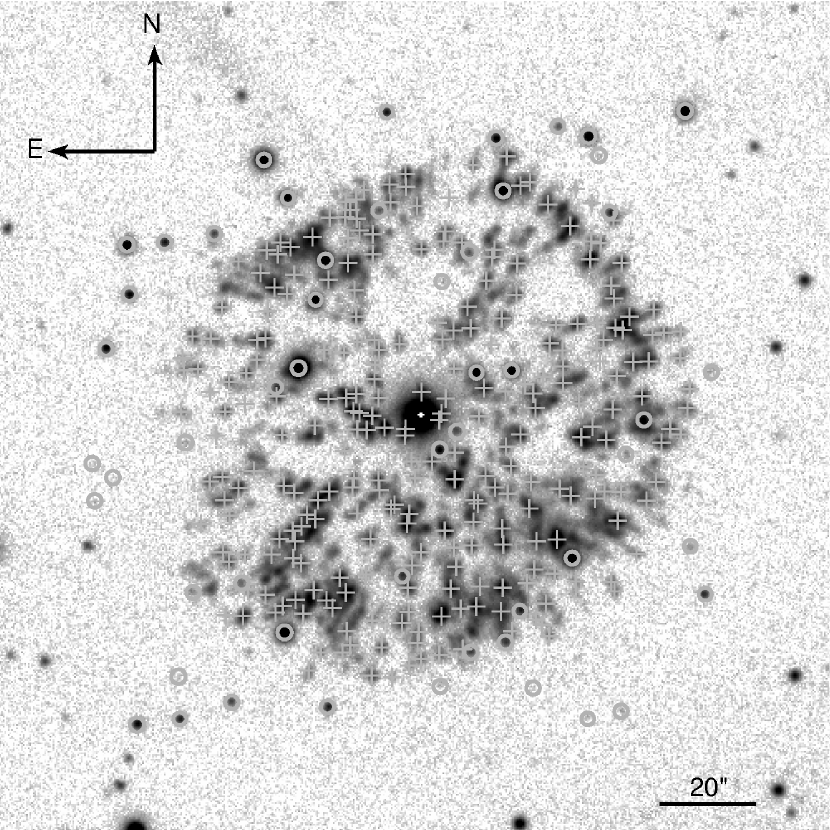
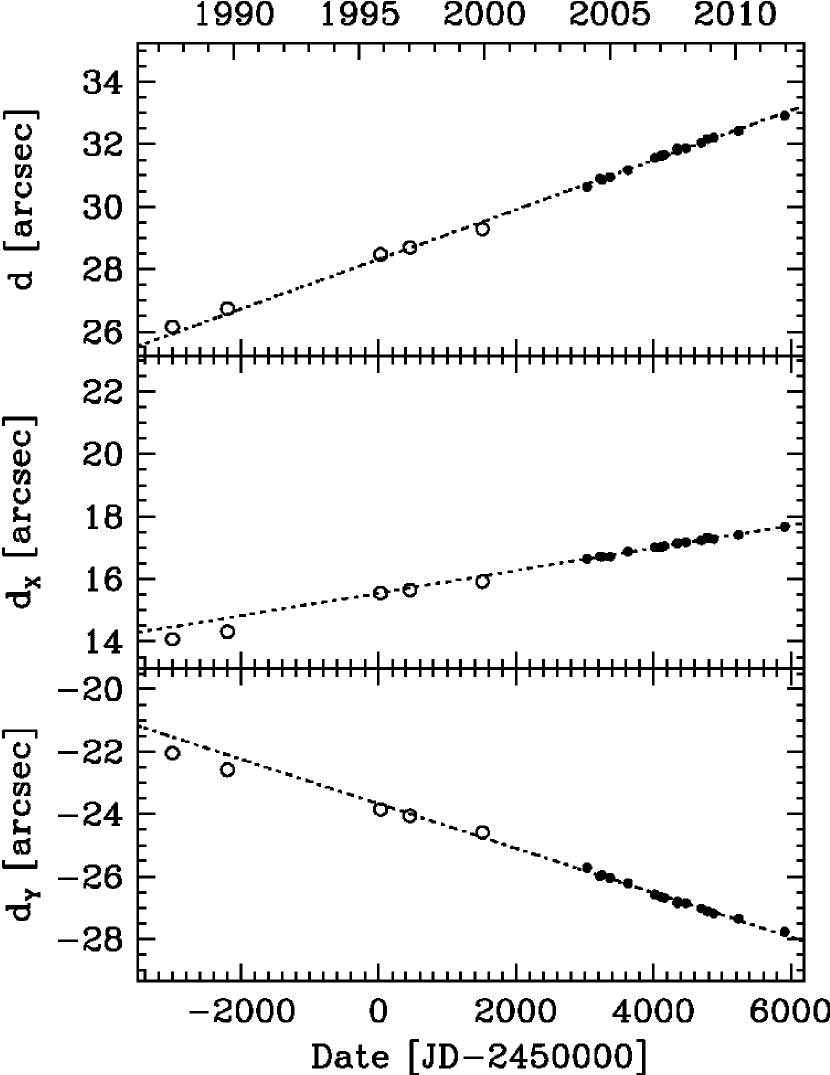
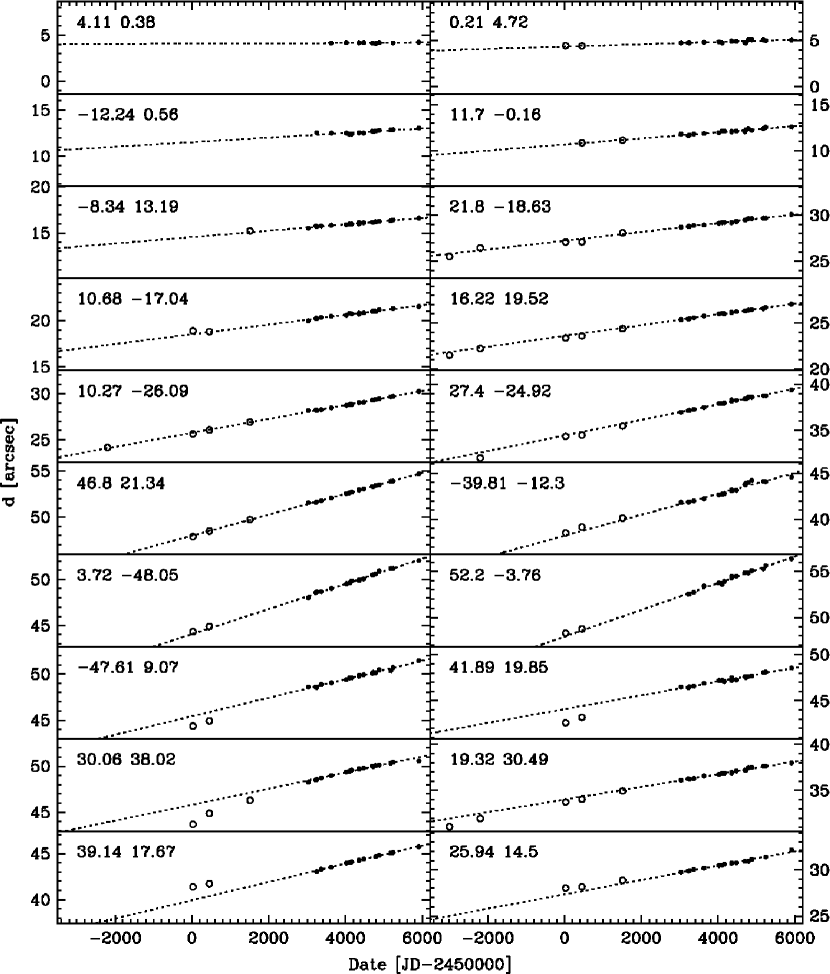
The motions in the plane of the sky for 282 individual knots were determined using the nineteen, carefully registered images obtained between 2004 and 2011. The measured knots are indicated in Figure 4. The position of knots at each epoch was computed by fitting independently in the and directions a Gaussian using the IRAF task imexamine, with fitting parameters adjusted to the mean characteristic of the knots. Only knots for which a reasonable Gaussian fit can be obtained were considered. Then the proper motion of each knot were determined by means of a least square fit of the positions at the different epochs. Both the distance variation from the central star, as well the separate motions in the and directions were computed, as illustrated in Figure 5. In this way, the proper motion vector is determined, which in addition to the magnitude of the spatial displacement also contains the information on its direction (angle , see Figure 2). For all of the knots, a straight line provides an excellent fit to the variation of during the 7.9-yr lapse of time considered. This is further illustrated in Figure 6. Proper motions range from yr-1 to yr-1.
The prime focus camera of the INT has well defined and small geometrical distortions222http://www.ast.cam.ac.uk/wfcsur/technical/astrometry/ in the limited FOV covered by the GK Per nova remnant, and which are robustly removed during the astrometric registering of images. Therefore, errors in the proper motion determination mainly depend on the goodness of the fit of the position of the knots at the different epochs, which in turn depends on the knot’s shape and brightness. As the proper motion error, we adopt the formal error of the least square fit: its average value is yr-1.
In the proper motion calculation, we did not use the images earlier than 2004 as they come from a less homogeneous set of observations with generally poorer resolution or astrometric properties, as well as different filters. They are however used to search for signs of acceleration/deceleration of knots in the last decade with respect to the previous 20 years. In this respect, we found no evidence for a systematic acceleration/deceleration, except in a few cases (see the lower three panels in Figure 6). Among these, a modest slow down is the most common case.
| PA | ||||||||||||
|---|---|---|---|---|---|---|---|---|---|---|---|---|
| () | () | () | () | () | () | () | () | () | () | () | () | (km s-1) |
| 0.06 | -27.43 | 0.242 | 0.005 | 0.005 | 0.004 | -0.242 | 0.005 | 180.1 | 0.3 | 181.2 | 0.9 | – |
| 0.09 | -48.91 | 0.448 | 0.006 | -0.009 | 0.012 | -0.448 | 0.006 | 180.1 | 0.2 | 178.8 | 1.5 | – |
| 0.21 | 4.72 | 0.046 | 0.011 | -0.007 | 0.012 | 0.046 | 0.011 | 357.5 | 2.0 | 8.9 | 14.7 | 808 |
| 0.21 | 4.72 | 0.046 | 0.011 | -0.007 | 0.012 | 0.046 | 0.011 | 357.5 | 2.0 | 8.9 | 14.7 | 919 |
| 0.22 | 33.44 | 0.261 | 0.003 | -0.005 | 0.004 | 0.261 | 0.003 | 359.6 | 0.3 | 1.0 | 0.8 | – |
| 2.25 | -9.25 | 0.081 | 0.004 | 0.010 | 0.010 | -0.080 | 0.005 | 193.7 | 1.0 | 186.8 | 7.1 | -822 |
| 3.41 | 18.67 | 0.153 | 0.013 | 0.003 | 0.019 | 0.155 | 0.014 | 349.7 | 0.5 | 358.9 | 7.1 | 721 |
| 3.69 | -0.88 | 0.048 | 0.017 | 0.041 | 0.015 | -0.033 | 0.022 | 256.6 | 2.5 | 231.4 | 21.0 | -894 |
| 3.72 | -48.07 | 0.497 | 0.012 | 0.057 | 0.007 | -0.494 | 0.012 | 184.4 | 0.2 | 186.5 | 0.9 | – |
| 4.11 | 0.38 | 0.007 | 0.006 | 0.006 | 0.006 | 0.007 | 0.011 | 275.3 | 2.3 | 317.3 | 54.0 | -794 |
Note. — The entire table is published only in the electronic edition of the article (For arXiv version see ancillary file tabel3_online.txt). The first 10 lines are shown here for guidance regarding its form and content.
The knots positions, their proper motions , , , and direction , position angles, radial velocities, and the errors associated to all these quantities, are listed in Table 3. An excerpt is presented in the paper, while the entire table is only available in the electronic version of the article. In the table, individual knots are identified by their X and Y distance in arcsec from the central source (, ) on the plane of the sky at the reference epoch as determined from the adopted least square fits.
5.1 Comparison with published data
A study of the proper motions in GK Persei remnant knots was recently done by Shara et al. (2012) using the 1995 and 1997 HST images listed in Table 1. The proper motions of 938 knots is estimated, but no quantitative comparison with our measurements is possible as Shara et al. (2012) did not publish data for individual knots. In spite of the higher resolution of the HST, the seven-times longer baseline of our observations, the large number of measurements (19, which reduce statistical errors), and the accurate knowledge of the astrometric properties of the INT prime-focus camera, provide proper motion measurements which are more accurate by a factor of four (cf. Figure 8 in Shara et al. 2012 with our average error of 0.”01 yr-1).
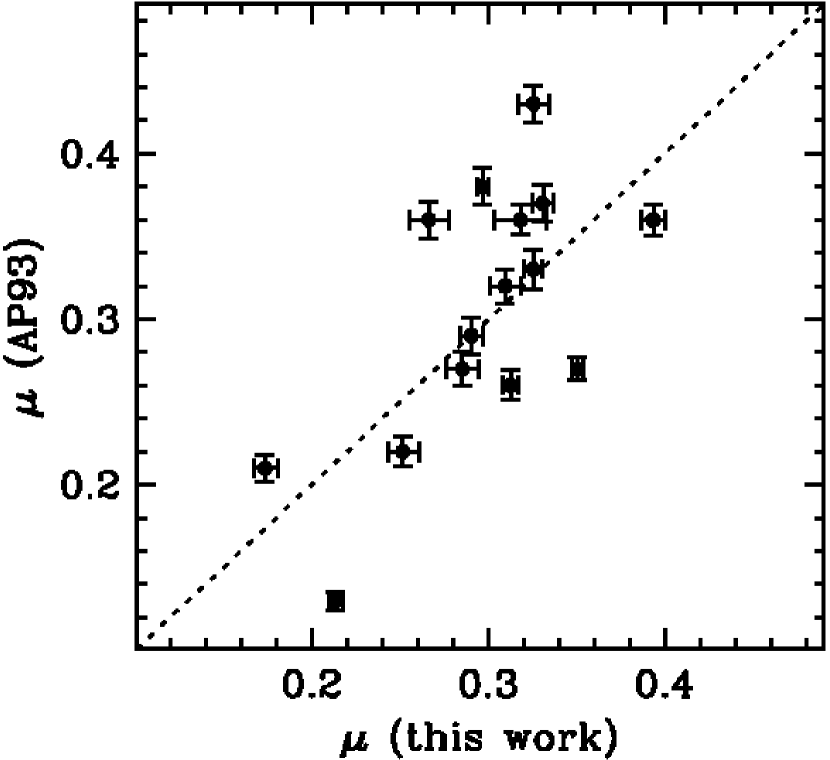
Anupama & Prabhu (1993) (AP93) have measured the motion in the plane of the sky of 20 individual bright knots using two ground based images obtained on 1984.63 and 1990.10 at Vainu Bappu Observatory (India), with a similar filter as in our observations. From visual inspection of their Figure 1, it is possible to safely identify 15 knots in common with our measurements. The comparison of their proper motions is presented in Figure 7. Individual differences between the two datasets are above the quoted errors, but no systematic effects appear. Given that our measurements come from the analysis of 19 accurately registered high-quality images, we keep our proper motion measurements for the following analysis.
6 RADIAL VELOCITIES
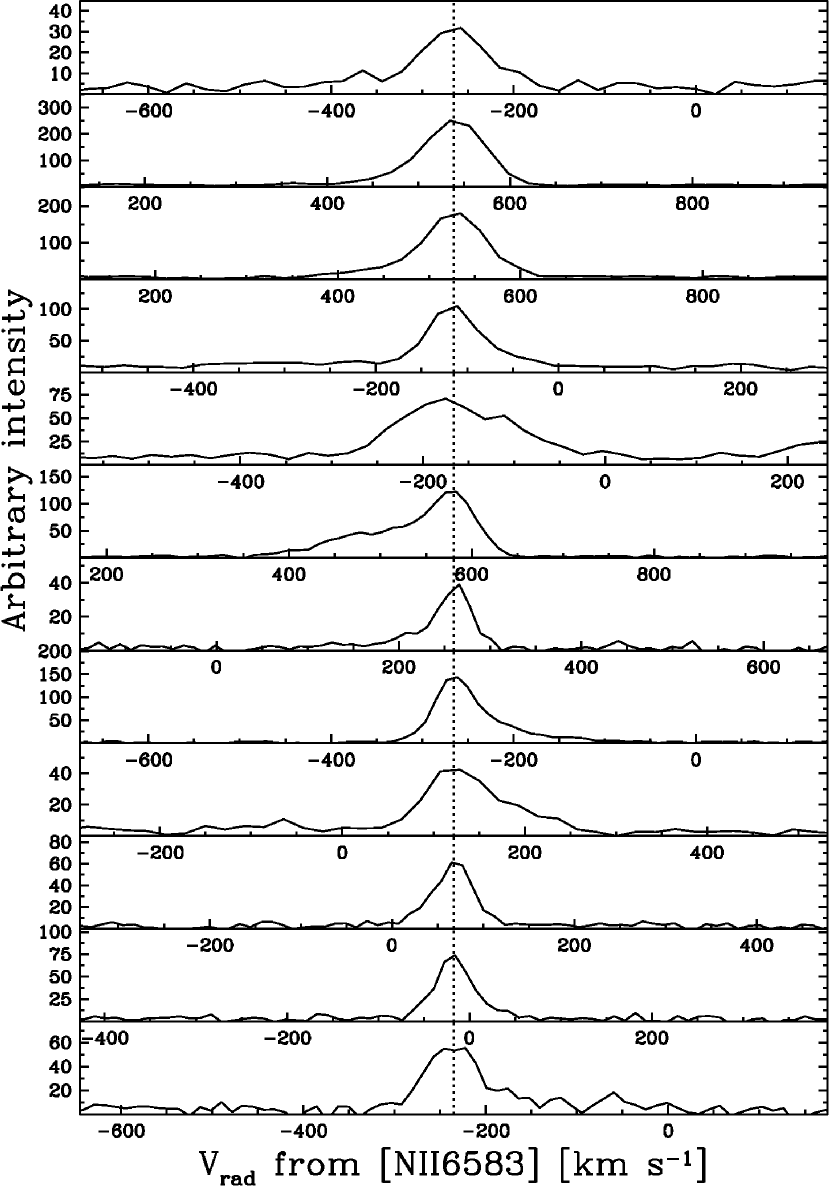
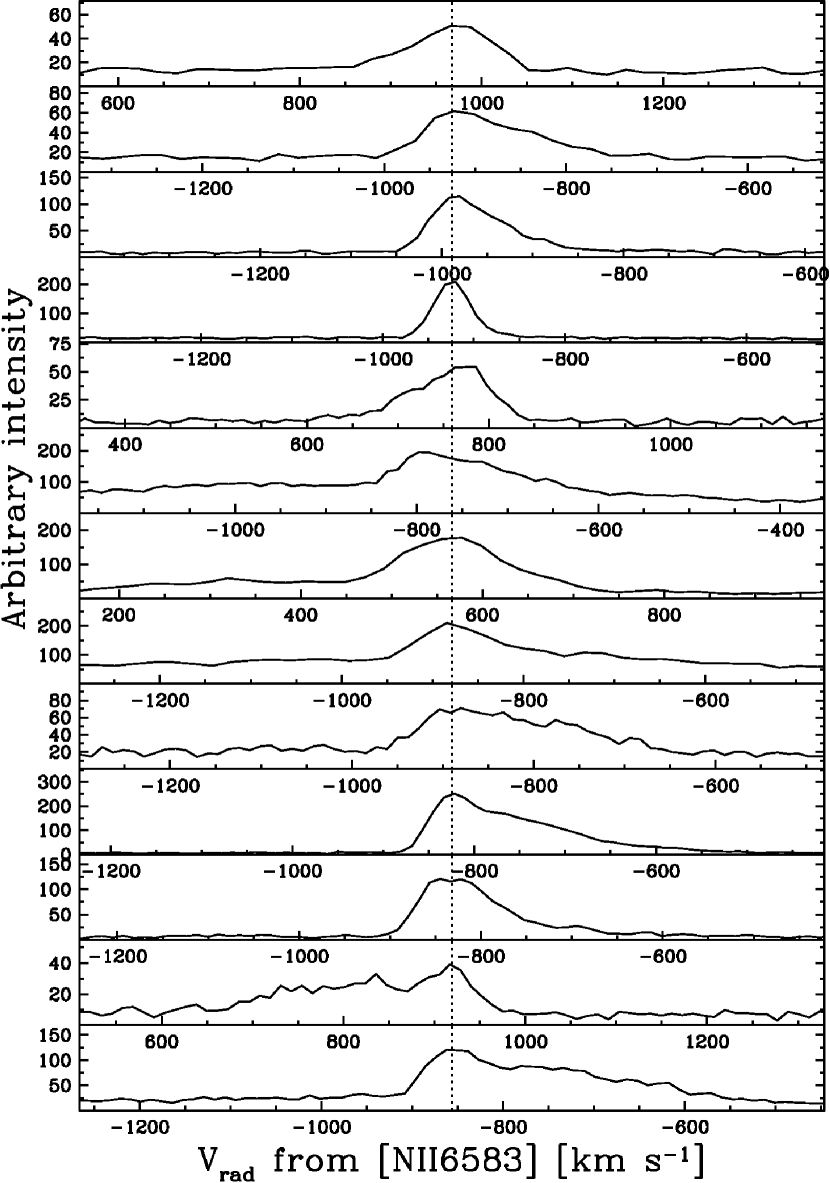
Our medium resolution spectra include the H line and the [NII] doublet. No other emission lines were detected at the depth of these observations in the relatively small spectral range covered (see Table 2). First, the spatial regions which clearly correspond to knots identified in the images obtained at the same epoch were extracted from the long-slit data. In this way, 217 knots could be identified and measured. Then the signal in each region was integrated to create the H and [NII] line profiles of each knot. They are generally broad, as also noted by Shara et al. (2012), with an instrument-corrected full width at half maximum up to 200 km s-1, as illustrated in Figure 8. The figure also shows that knots toward the center of the nebula (right panel) frequently have marked asymmetric shapes, with tails extending to velocities as large as 300 km s-1. Given the strong projection effects in these central regions, it is not clear if these tails are intrinsic to the knots, associated with related filaments, or caused by apparent superposition of more than one knot.
The radial velocities of each knot were then measured by Gaussian fitting the [NII] 6583 Å line profile. When the line clearly had more than one peak or possessed non-negligible wings, multi-Gaussian fitting was applied, but the secondary components (which takes into account the wings or minor peaks) were not used in the following kinematical analysis. Errors on the radial velocity have been estimated by comparing multiple measurements of the same knots in different nights and with the two different telescopes used. A typical error of km s-1 is adopted. All velocities were corrected to the Local Standard of Rest (LSR). As the LSR systemic velocity of GK Per was estimated by Bode et al. (2004) to be km s-1, radial velocities were also corrected by this value. Table 3 lists the radial velocities of knots with respect to the systemic velocity of GK Per. They range from to km s-1.
7 KINEMATICAL ANALYSIS
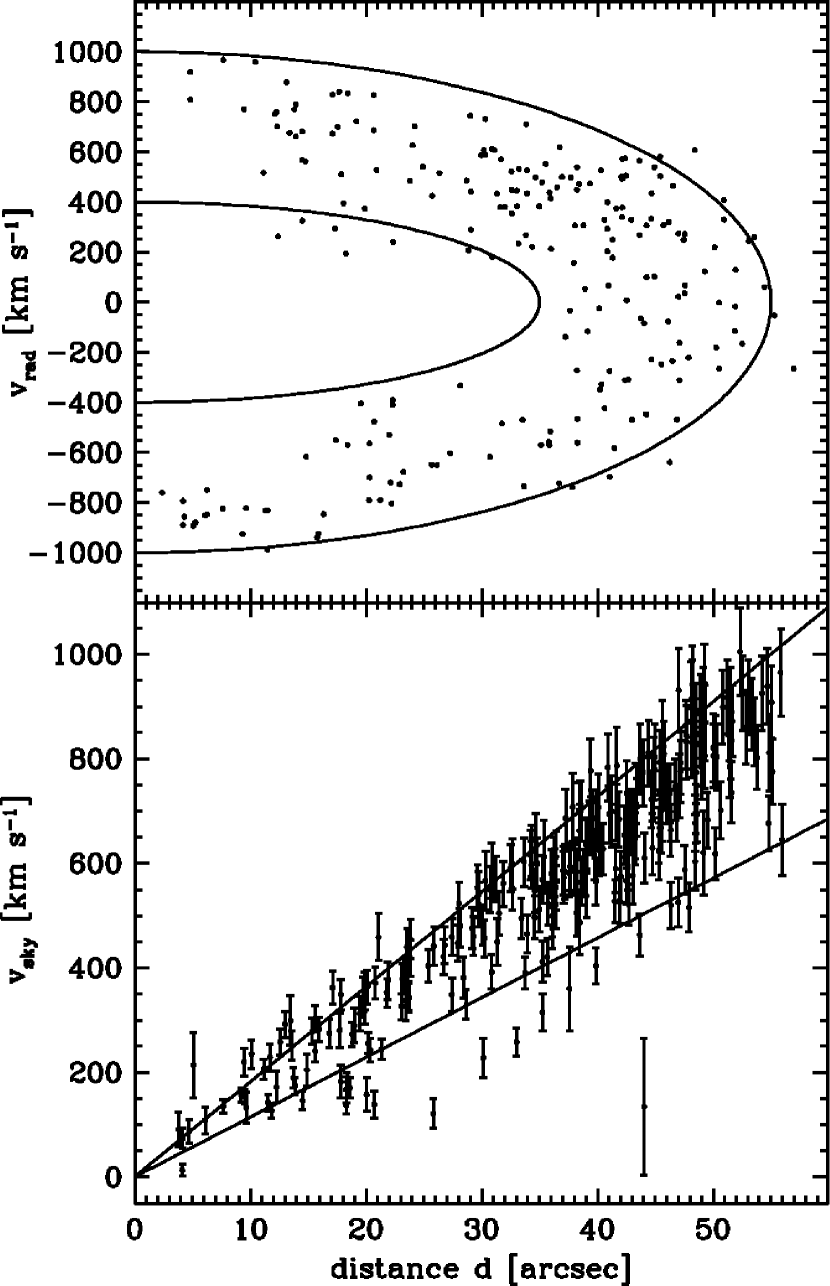
Given its roundish overall morphology, as a first approximation we consider the nebula of GK Per to be a quasi-spherical shell in which knots expand radially from the central star. This hypothesis is broadly consistent with the plot of the observed radial velocities of the knots as a function of their apparent distance from the central star (Figure 9, upper panel). The two solid lines in the figure indicate the expected distance-velocity plot for spherical shells of radii of 35 and 55 arcsec, and expansion velocities of 400 and 1000 km s-1, respectively. Most of the knots are comprised within these two limits, suggesting that the knots of the nebula of GK Per form a relatively thick shell expanding with a significant range of velocities.
This conclusion is supported by the behavior of the proper motions . The component of the expansion velocity in the plane of the sky immediately follows from according to equation (in convenient units)
| (1) |
where is the distance to GK Per. For a distance of pc (Section 7), of the measured knots varies between 13 and 1005 km s-1, and its variation with distance from the center is also consistent with a spherical thick shell model with parameters as described above (Figure 9, lower panel).
The combination of the velocity components in the plane of the sky and along the line of sight provides the velocity vectors of the knots (see the right panel of the Figure 2) once the distance to GK Per is fixed. We could measure both velocity components for 117 knots: their deprojected speed is , and is the angle between the line of sight and the velocity vector (as in Figure 2). Assuming a purely radial expansion, is also the angle that the line joining the central star with a knot forms with the line of sight, in Figure 2. The deprojected distance from the center would therefore be , and its projection along the line of sight is . We define the sign of so that it is positive when a knot is approaching us (i.e. blue-shifted) and negative when it is receding (red-shifted). We also define to be positive for all knots in the Northern side of the nebula and negative for those in the Southern half. With these notations, a representation of the “depth” of the nebula along the line of sight (i.e. its extension along the direction) is shown in Figure 10. In the figure, the observer is on the right side, and the plane represents the folding of all planes perpendicular to the plane of the sky and passing through the central star and the knots considered (right panel of Figure 2). 99 knots with a computed error on smaller than 10 arcsec are plotted. As stated above, the extension of the nebula along depends on the adopted distance . We assume that the distance value that better corresponds to an overall spherical shape of the nebula is our “expansion-parallax” determination of the distance to GK Per. The adopted value, estimated by visual inspection of the variation of the overall shape of the nebula as a function of , is 40030 pc. This is broadly equivalent to assuming that for knots at the outer apparent edge of the nebula is the same as for knots in the innermost regions.
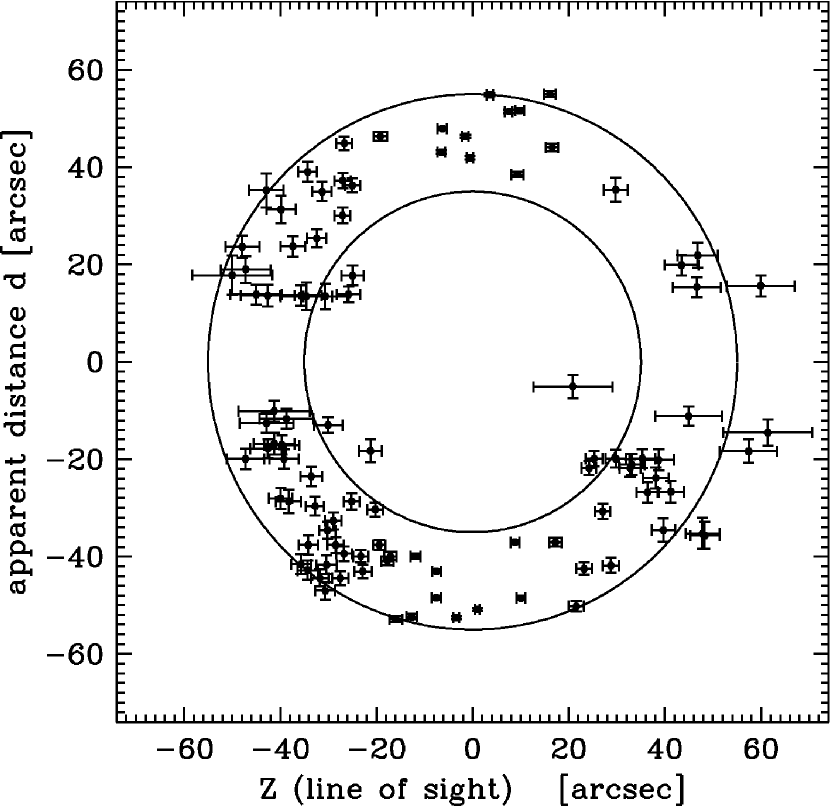
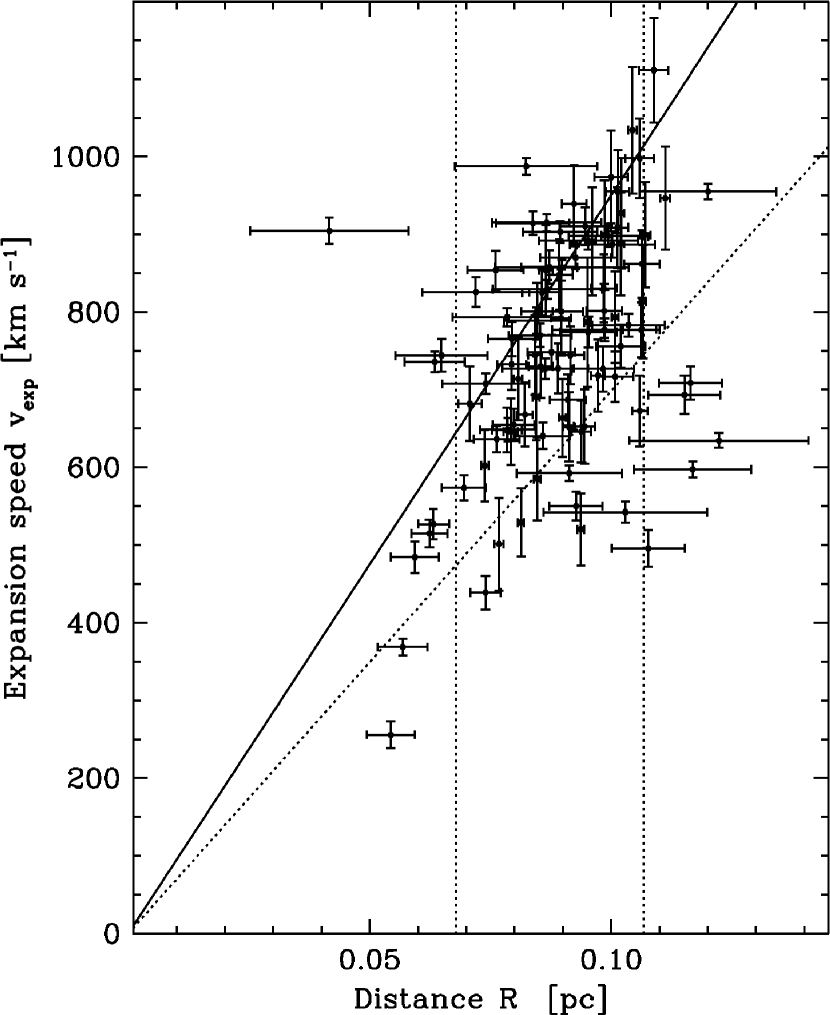
Figure 11 shows the relations between deprojected quantities, namely the speed and the distances from the central star. As in previous graphs, it confirms that the nova remnant is thick (nearly a half of its outer radius) and that the expansion speed of knots covers the significant range from 250 to 1100 km s-1, with the majority of them having a speed between 600 and 1000 km s-1. In the figure, we also indicate the expected relationship between velocity and distance for a ballistic ejection (Hubble-like flow) with an age =102.9 years, which is the time lapse between the nova maximum of 1901 Feb 22 and our reference epoch of 2004 Jan 29. Points above the solid line have a kinematical age smaller than , and those below the line have a larger kinematical age, which indicates that they suffered some deceleration in the course of the expansion. For comparison, in the figure we show as a dotted line also the relation expected for a ballistic expansion with an age of 140 years. The knots age is further investigated in the next section.
7.1 Kinematical ages
A direct estimate of the kinematical age of each knot can be obtained from the proper motion measurements, according to
| (2) |
where is the distance of the knot from the central star on the plane of the sky that we measured at our reference epoch (see Figure 2).
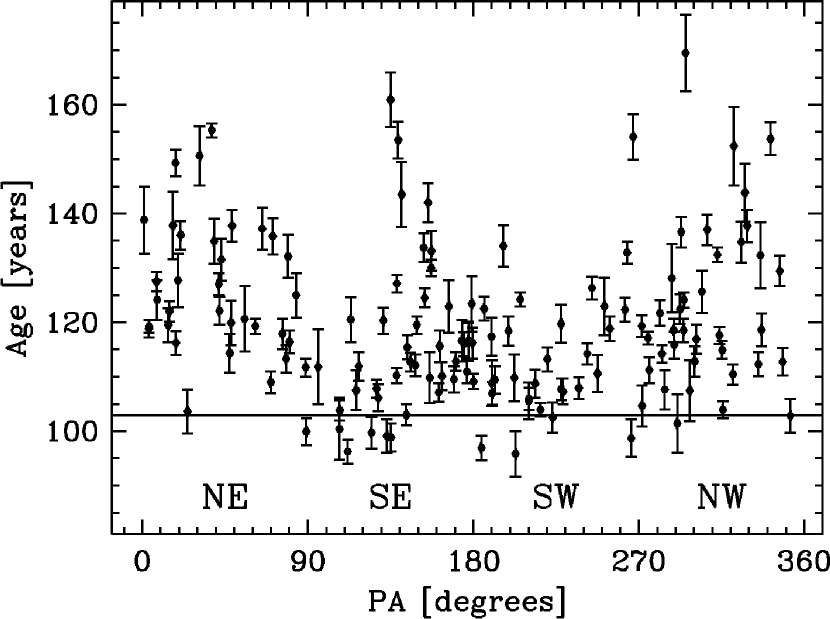
In Figure 12 we present the kinematical age computed in this way as a function of the knots position angle. In the figure, only the 151 knots with an estimated error on the age smaller than 8 years, and with an apparent distance from the centre 35 arcsec (in order to focus on the directions close to the plane of the sky and minimize projection effects) are included. Ages vary between 96 and 170 years, the mean value, weighted by errors, being years. The horizontal line indicates the nova age , and shows that in general knots have suffered only a modest deceleration since their ejection. This conclusion is consistent with the comparison between the knots speeds of up to 1100 km s-1 determined above (Figure 11), and an initial expansion of the outflow of 1300 km s-1 (Pottasch, 1959). Indeed, in the simplistic hypothesis of constant deceleration throughout the knots lifetime (Duerbeck, 1987), their observed mean age of 118 years implies that the present-day average speed is 77% of the original ejection velocity. The time for individual knots to decrease in speed by a factor of two would be 220 years. Even for knots with an apparent age of 140 years (the upper limit for the vast majority of points in Figures 11 and 12), velocity would have decreased by only 42% in the 102.9 years since the nova explosion, and would be 120 years. Data therefore exclude the short timescale =58 years estimated by Duerbeck (1987).
The calculations of Duerbeck (1987) were based on the measurement of the radius of the SW side of the nebula from images taken between 1917 and 1984. These measurements were extended by Seaquist et al. (1989), who analyzed them using a more physical model which considered the expansion of an isothermal or adiabatic shock created by the interaction of the expanding outflow with a tenuous circumstellar medium. Such an analysis was further extended by Anupama & Kantharia (2005) with images taken till 2003. We refrain from further extending the method, as we found that the measurement of the size of the nebula is highly subjective, owing to the difficulty in defining the nebular edge due to the lack of an abrupt fall of surface brightness, clumpiness (which is enhanced by the better resolution of the recent images), and asymmetries. Indeed, our estimates of the size differ from those of Seaquist et al. (1989) and Anupama & Kantharia (2005) by up to several arcseconds, which prevents any detailed discussion or refinement of the results obtained by these authors.
7.2 Deviations from spherical symmetry
The proper motion measurements also allow us to measure any deviation from circular symmetry of the expansion pattern in the directions close to the plane of the sky. Anisotropies along the line of sight depends on the adopted distance of the system, and indeed in the previous section we used the argument inversely, having minimized any anisotropy in order to estimate a distance to the system.
Considering the data in Figure 12, the mean weighted age in the different quadrants is: yr (NE, 34 knots), yr (SE, 45 knots), yr (SW, 34 knots), and yr (NW, 38 knots). We conclude that no strong evidence exists for deviations from the circular symmetry in the expansion pattern. If any, knots in the Northern side of the nebula seem to have suffered a stronger deceleration throughout the remnant lifetime than those in the Southern part. Therefore, our calculations do not support the prediction of Bode et al. (2004) that knots in SW quarter should have been slowed down more than the rest. Smaller proper motions in the NW quadrant are also mentioned in Shara et al. (2012).
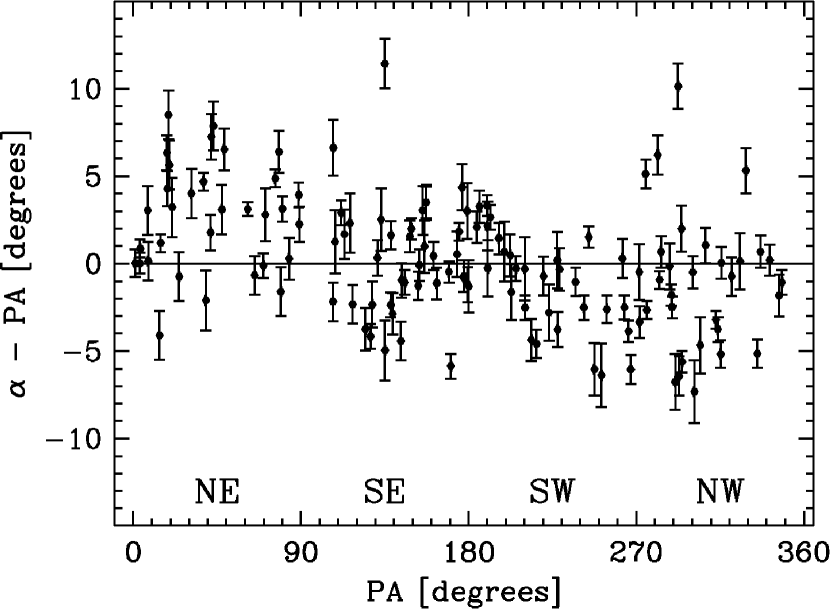
In addition, our initial hypothesis of purely radial motions can be tested by comparing the direction of the velocity vectors in the plane of the sky, , with the position angle PA of knots in the plane of the sky, i.e. their radial direction from the central star. As in Figure 12, only knots with 35 arcsec are considered in order to limit projection effects. Figure 13 shows that velocity vectors are generally aligned along the radial direction but a clear symmetric pattern of non-radial velocities is also observed. The maximum deviations are observed in the NE quadrant, where knots trajectories seems systematically bended toward the East with respect to the radial direction, and the Western part of the nebula, where knots velocity vectors are preferentially bended toward the South.
8 BRIGHTNESS EVOLUTION
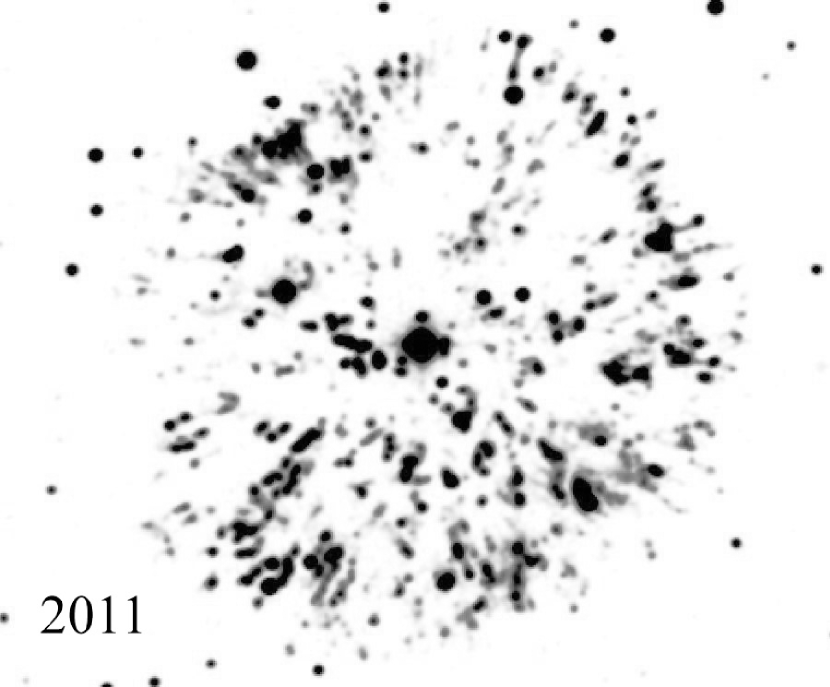
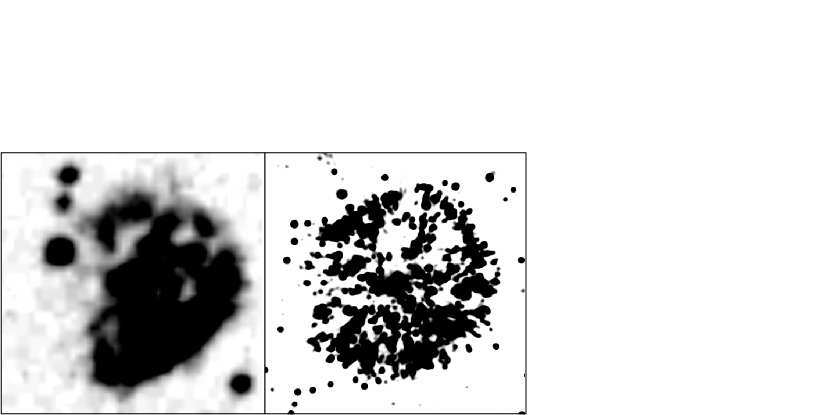
The GK Per optical nebula suffered clear morphological and brightness changes in the last 50 years. This is illustrated in Figure 14, where a 2 zoom of the 1953 image is compared to a smoothed version of our 2011 image. The main changes are a relative brightening of the whole Eastern side of the nebula compared to the Western side, and in particular the development of a more prominent “bar” in the NE edge (see also Anupama & Kantharia 2005), and a progressive circularization of the SW edge of the nebula, i.e. of the region of the strong interaction observed at radio and X-ray wavelengths. In general, the outflow looks more circular and uniform than in the past.
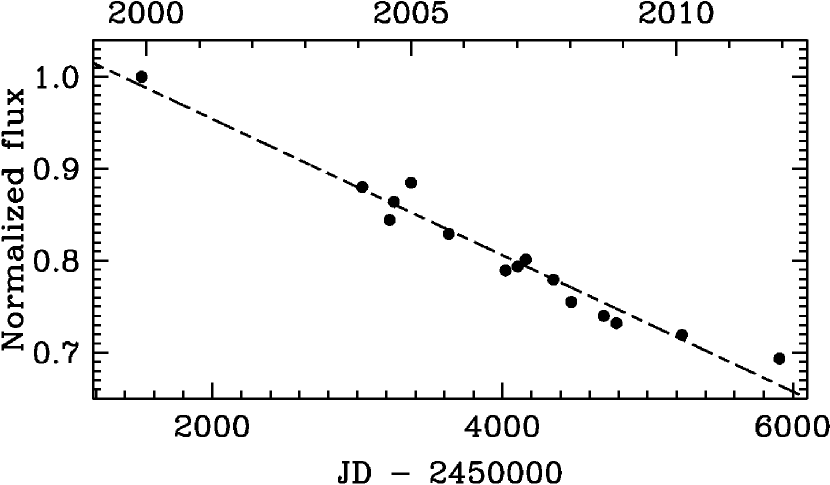
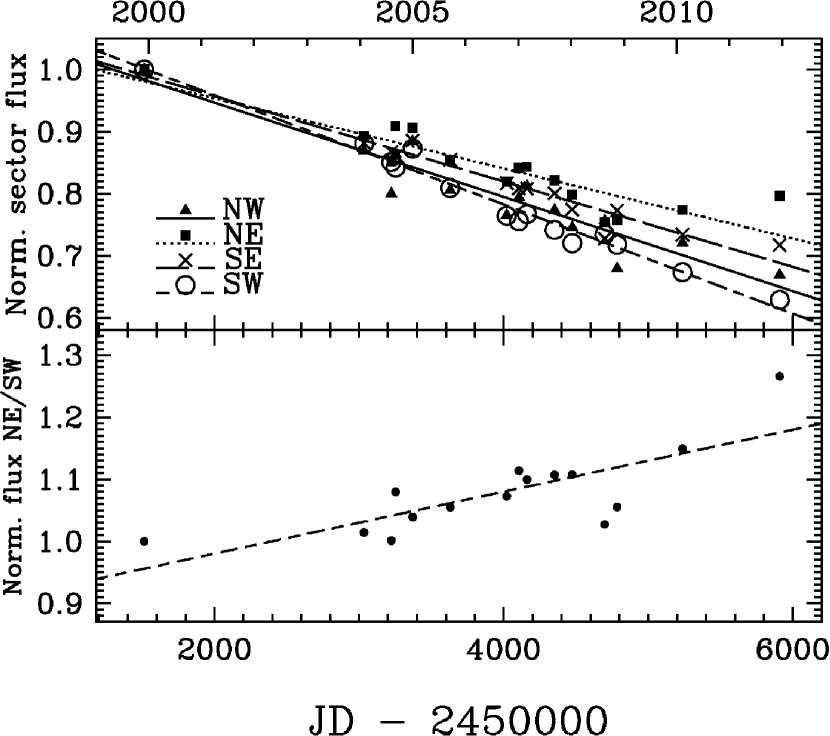
As most of our images were taken with the same instrument, detector, and filter, the brightness variation of the nebula in the last decade can be quantified. The 15 INT+WFC flux-matched frames marked with an asterisk in Table 1 were used. To measure the brightness of the nebula, all stars inside or nearby the remnant were masked. We first measured the brightness variation of the nebula as a whole. In Figure 15 we present the evolution of the total flux of the remnant normalized to the value that it had in 1999. It shows that the total +[NII] flux of the nebula has been linearly decreasing, for a total of 31% over the 12.04 years considered, i.e. at a rate of 2.6% per year, which is similar to what measured in the radio by Anupama & Kantharia (2005) and attributed to adiabatic expansion of the remnant into the surrounding medium.
Second, the flux variation for each of the four quadrants (NE, NW, SE, SW) was computed. As can be seen from Figure 16, the NE quadrant shows the shallowest decline, with even some possible re-brightening in the last 3 years. The quadrant fading at the largest rate is the SW one.
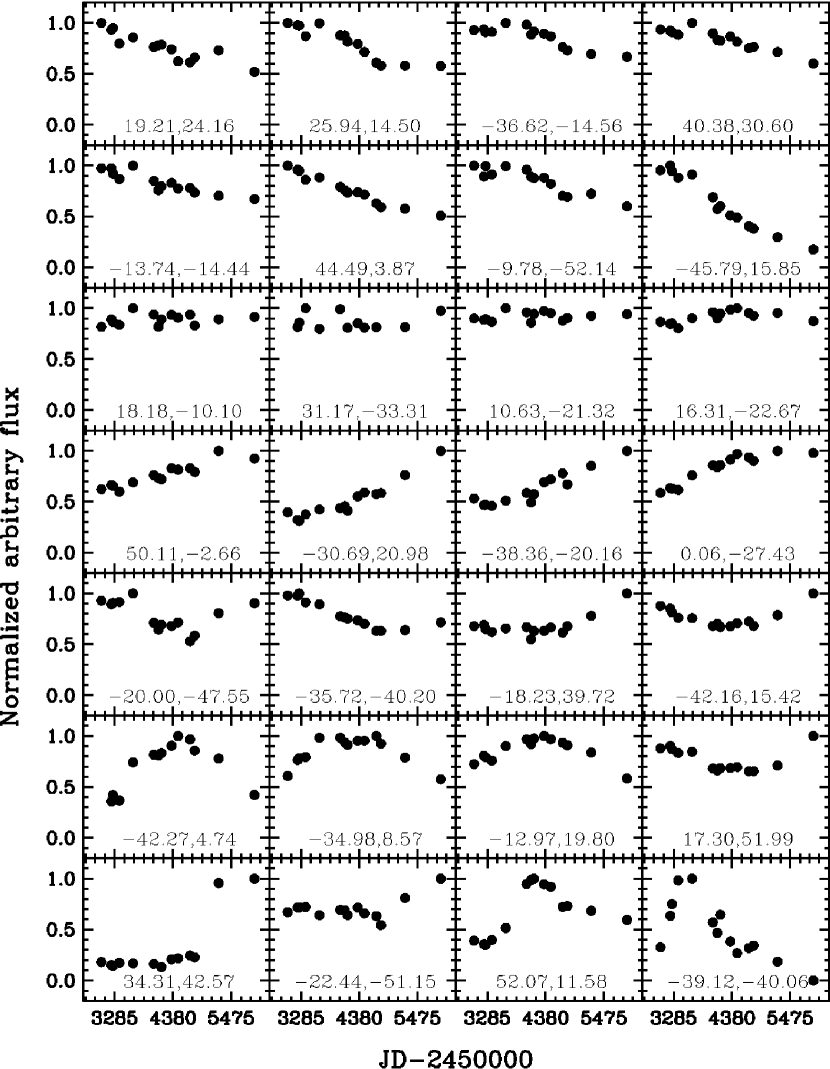
Third, we have also considered the flux variations for a number of individual knots. Their fluxes were measured using circular apertures matched to the knots size, using an external annulus for background subtraction. The 1999 image could not be used for the measurement of individual knots because of its poorer seeing. After excluding knots in crowded areas, we could measure the flux variation of 85 knots. Illustrative examples are presented in Figure 17. In the figure, the flux is normalized to the maximum flux of each knot in the period considered. Out of 85 knots, 50% show a similar fading as the nebula as a whole (first two rows in the figure). Some 15% have a constant flux (third row), while some 20% of the knots show instead a monotonic brightening (fourth row in Figure 17). Finally, 15% of the knots are rapidly fading or brightening (or both) during the 2004-2011 period (last three rows). The most extreme cases show a sudden brightening of a factor of 5 in one year (bottom-left panel), or a similarly fast brightening and then a dramatic fading on a timescale of less than three years (bottom-right panel). The brightness variations of individual knots is also discussed by Shara et al. (2012).
9 DISCUSSION
9.1 Distance
Our kinematical determination of a distance of 40030 pc for GK Per (Section 7) compares well with the value derived using the absolute peak luminosity of novae. We have considered four different relationships between at peak luminosity and the rate of the nova decline (Cohen 1985; Capaccioli et al. 1989; della Valle & Livio 1995; Downes & Duerbeck 2000), depending on (the time in days the nova takes to fade 2 mag from the peak brightness). Assuming the following for GK Per: d, a peak visual magnitude of =0.2 mag, and a reddening of (Wu et al. 1989), we have computed the distance to GK Per using the different relationships. The average distance is 44070 pc, in good agreement with our kinematic estimate.
Our distance also broadly agrees with (and should improve) the estimates from other authors using the expansion parallax of the remnant. The most widely used distance is 470 pc by McLaughlin (1960). Duerbeck (1981) found the distance to be 525 pc. A more recent determination by Slavin et al. (1995) states pc.
Finally, a rather short distance to GK Per, 337 pc, was determined in Warner (1987) using the Bailey’s method (Bailey 1981). This method considers the -band magnitude of the secondary star, which for cataclysmic variables is not easily separated from the disc contribution: therefore the calculated distance should be considered as a lower limit. The largest distance determination is the one by Sherrington & Jameson (1983), 726 pc, using again the mag and their estimated spectral type for the secondary star (K2 IV).
9.2 Dynamics of the ejecta
Our kinematical study, combining velocity measurements both in the plane of the sky and along the line of sights, has highlighted several basic properties of the dynamical evolution of the GK Per nova remnant. The outflow consists of a thick shell composed of about a thousand knots and filaments. Knots velocities range from 250 to 1100 km s-1, with the majority of them having a velocity between 600 and 1000 km s-1. The kinematical ages of knots from the proper motion measurements indicate that most of them have been only modestly slowed down in the 102.9 years from the ejection to the present, with no significant deceleration during the last 10-20 years. Clear evidence for systematic deviations of the expansion rate with direction is either not found.
On the other hand, some long-term evolution of the overall characteristics of the nebula is highlighted. The most notable changes are a progressive circularization of the SW nebular edge, and a relative brightening of the whole Eastern side compared to the Western part, with the development of a “bar” in the NE edge.
In few words, the nebula seems to expand nearly ballistically, and is progressively becoming rounder and more uniform in terms of surface brightness. These results are somewhat surprising considering the previous interpretation of the evolution of the GK Per remnant. In fact, the asymmetry observed at radio and X-ray wavelengths (Seaquist et al., 1989; Balman, 2005) seems to indicate that along the SW direction strong interaction of the remnant with relatively dense circumstellar material has occurred. This is however not reflected in enhanced deceleration of the optical knots along this direction.
The interpretation of the nebular dynamics should take into account these new results. A basic role in the discussion is played by the original circumbinary density distribution into which the nova ejecta expanded. Its most visible expression is the large bipolar nebula first detected from IRAS data by Bode et al. (1987). The strongest argument for the association between this bipolar structure and the nova is geometrical, that is, the emission is symmetrically placed around GK Per. The inherent problems of the classification of the bipolar nebulosity as an old planetary nebula from the primary star of the system were presented by Tweedy (1995). An alternative solution has been proposed by Dougherty et al. (1996): in it the secondary star could be responsible for the formation of the extended nebula as it evolved off the main sequence triggering a major transfer of material into the primary star causing a born-again asymptotic giant branch event. As revealed by deep optical imaging the extended emission presents a typical bipolar morphology with the polar axis oriented in the NW-SE direction. The nebula shows an asymmetry between the NE and SW edges that Bode et al. (2004) interpreted as the motion of the nebula to the SW assuming high relative velocity with respect to the ISM. Within this picture the non-thermal radio (Anupama & Prabhu, 1993) and the X-rays (Balman & Ögelman, 1999) emission in the SW direction is interpreted by Bode et al. (2004) to be a consequence of the nova ejecta ploughing the denser medium of the SW side of the bipolar nebula.
We can test this idea in the framework of the existing hydrodynamical models of nebular interaction with the ISM. The central binary is moving with a space velocity of km s-1 (Bode et al., 2004), or 4.6 pc yr-1. For simplification, we consider the central source as a single star (as successfully done for Mira, see Martin et al. 2007). Moreover, given that the direction of the movement is almost perpendicular to the axis of the bipolar lobes we can also assume spherical symmetry (the formation of a bipolar structure is complex and beyond the scope of the present work). With this simplifications at hand we can consider that the interaction process can be similar, at least regarding the discussion that follows, to that of the wind of an AGB star with the ISM (see e.g. Villaver et al. 2003, 2012). In particular, a simulation with a relative speed of km s-1 can be found in Villaver et al. (2012). These simulations show that once a bow-shock structure is formed, the subsequent stellar wind expands unperturbed inside the asymmetric outer cavity created by the interaction. In these conditions, never the stellar material ejected inside this cavity can feel the outer interaction if it is inside the bow-shock structure. The same idea could be applied to GK Per: if both the outer bipolar nebula and the nova ejecta are the result of the evolution of the central binary, and the nova shell is expanding inside the bipolar nebula, then the ejecta cannot see the interaction with the ISM, and should expand unperturbed. This interpretation is consistent with the lack of evidence for deviations of the expansion rate with direction found in this work. In particular, the SW side, where most of the interaction with the circumstellar medium was assumed to occurred in the past (see radio and X-ray data) does not show any sign of larger deceleration than the rest of the nebula. The asymmetry observed in the radio and X-rays, however, would remain unexplained in this scenario.
An alternative possibility is the existence of a mechanism that allows interaction with the ISM to permeate from the outer structure to the nova shell. An interaction with magnetized ISM could provide this mechanism (Soker & Dgani, 1997). In fact, the nature of the radio and X-ray emission could be explained as dense gas clouds moving supersonically through a magnetized low-density medium. Jones et al. (1994) show how the synchrotron emission from relativistic electrons increases rapidly when the cloud begins to fragment under a Rayleigh-Taylor instability. They also show how the interaction of this wind with dense condensations can lead to strong magnetic fields. If relativistic particles are formed as the fast wind is shocked, then the enhanced magnetic field will result in non-thermal radio emission.
At this point we can turn our attention back to the outburst mechanism that leads to the formation of the nova ejecta. Its thick shell geometry can be the result of an ejection with a range of initial velocities, or the dynamical evolution of the interaction of different components. We favour the latter hypothesis, which is supported by the observations of nova shells soon after outburst. It has been argued in the literature that two distinct outflow components of different origin are present at early times: an earlier, slow one from the circumbinary gas, and a later, fast one result of the outburst (see e.g. Cassatella et al. 2004; Williams & Mason 2010). In the case of Nova Cyg 1992, Cassatella et al. (2004) show that the main shell ejected at the moment of the outburst contains the bulk of the ejected matter and is located in the outermost region of the ejecta region, while a less massive impulsive event forms a faster expanding shell that eventually will catch up with the main shell generating a region of shock interaction where the two shells meet. Eventually, the process gives rise to the formation of a new shell formed by the merger of the two. A similar scenario in terms of discrete shell ejection events is proposed by Williams et al. (2008) and Williams & Mason (2010) to explain the absorption line spectra of the early ejecta of 15 nova shells.
In GK Per we are probably witnessing the late evolution of such of a process, and in this respect it is natural that any asymmetry originally present in the dense ejecta (see e.g. the 1917 images in Bode et al. 2004) disappears with time as the combined shell expands outward. This explains the progressive circularization and homogenization of the optical outflow. The original asymmetry can also be understood in terms of the binary interactions in the system (e.g. Sytov et al. 2009).
References
- Anupama & Prabhu (1993) Anupama, G. C., & Prabhu, T. P. 1993, MNRAS, 263, 335
- Anupama & Kantharia (2005) Anupama, G. C., & Kantharia, N. G. 2005, A&A, 435, 167
- Bailey (1981) Bailey, J. 1981, MNRAS, 197, 31
- Balman & Ögelman (1999) Balman, Ş., Ögelman, H. B. 1999, ApJ, 518, L111
- Balman (2005) Balman, Ş. 2005, ApJ, 627, 933
- Barnard (1916) Barnard, Frederick A. P. 1916, Harvard College Observatory Bulletin, 621, 1
- Bode et al. (1987) Bode, M. F., Seaquist, E. R., Frail, D. A., at al. 1987, Nature, 329, 519
- Bode et al. (2004) Bode, M. F., O’Brien, T. J., & Simpson, M. 2004, ApJ, 600, L63
- Capaccioli et al. (1989) Capaccioli, M., della Valle, M., Rosino, L., & D’Onofrio, M. 1989, AJ, 97, 1622
- Cassatella et al. (2004) Cassatella, A., Lamers, H. J. G. L. M., Rossi, C., Altamore, A., & González-Riestra, R. 2004, A&A, 420, 571
- Cohen (1985) Cohen, J. G. 1985, ApJ, 292, 90
- della Valle & Livio (1995) della Valle, M., & Livio, M. 1995, ApJ, 452, 704
- Dougherty et al. (1996) Dougherty, S. M., Waters, L. B. F. M., Bode, M. F., et al. 1996, A&A, 306, 547
- Downes & Duerbeck (2000) Downes, R. A., & Duerbeck, H. W. 2000, AJ, 120, 2007
- Duerbeck (1981) Duerbeck, H. W. 1981 in PASP, vol. 93, 165
- Duerbeck (1987) Duerbeck, H. W. 1987, Ap&SS, 131, 461
- Jones et al. (1994) Jones, T. W., Kang, H., & Tregillis, I. L. 1994, ApJ, 432, 194
- Martin et al. (2007) Martin, D. C., Seibert, M., Neill, J. D., et al., 2007, Nature, 448, 780
- McLaughlin (1960) McLaughlin, D. B. 1960, Stellar atmospheres, Vol. 6, ed. J. L. Greenstein (Chicago: University of Chicago Press), p. 585.
- Pottasch (1959) Pottasch, S 1959, Ann. d’Astrophys., 22, 297
- Ritchey (1902) Ritchey, G. W. 1902, ApJ, 15, 129
- Seaquist et al. (1989) Seaquist, E. R., Bode, M. F., Frail, D. A., et al. 1989, ApJ, 344, 805S
- Shara et al. (2012) Shara, M. M., Zurek, D., De Marco O., et al., 2012, AJ, 143, 143
- Sherrington & Jameson (1983) Sherrington, M. R., & Jameson, R. F. 1983, MNRAS,, 205, 265
- Slavin et al. (1995) Slavin, A. J., O’Brien, T. J., & Dunlop, J. S. 1995, MNRAS, 276, 353
- Soker & Dgani (1997) Soker, N., & Dgani, R. 1997, ApJ, 484, 277
- Sytov et al. (2009) Sytov, A. Y., Bisikalo, D. V., Kaigorodov, P. V., & Boyarchuk, A. A. 2009, Astronomy Reports, 53, 223
- Tweedy (1995) Tweedy, R. W. 1995, ApJ, 438, 917
- Villaver et al. (2003) Villaver, E., García-Segura, G., & Manchado, A. 2003, ApJ, 585, L49
- Villaver et al. (2012) Villaver, E., Manchado, A., & García-Segura, G. 2012, ApJ, 748, 94
- Warner (1987) Warner, B. 1987, MNRAS, 227, 23
- Williams (1901) Williams, A. S. 1901, MNRAS, 61, 337
- Williams et al. (2008) Williams, R., Mason, E., Della Valle, M., & Ederoclite, A. 2008, ApJ, 685, 451
- Williams & Mason (2010) Williams, R., & Mason, E. 2010, Ap&SS, 327, 207
- Wu et al. (1989) Wu, C.-C., Holm, A. V., Panek, R. J., et al. 1989, ApJ, 339, 443