The Long-Lived UV “Plateau” of SN 2012aw
Abstract
Observations with the Swift UVOT have unambiguously uncovered for the first time a long-lived, UV “plateau” in a Type II-P supernova (SN). Although this flattening in slope is hinted at in a few other SNe, due to its proximity and minimal line-of-sight extinction, SN 2012aw has afforded the first opportunity to clearly observe this UV plateau. The observations of SN 2012aw revealed all Swift UV and u-band lightcurves initially declined rapidly, but 27 days after explosion the light curves flattened. Some possible sources of the UV plateau are: the same thermal process that cause the optical plateau, heating from radioactive decay, or a combination of both processes.
Subject headings:
supernovae: general—supernovae: individual (SN 2012aw)1. Introduction
A Type II-P supernova (SN) is the most common type of SNe in a volume limited sample (Li et~al. 2011 and references therein) and results from the core collapse of a massive star, usually a red super giant (RSG). The gravitational binding energy is approximately ergs, but only a small percentage of this is eventually released as sustained emission with a life time of a few months. The luminosity in the optical is maintained by the recombination of hydrogen and excitation by radioactive isotopes even as the expanding photosphere cools. The initial emission is very blue, with the peak of the bolometric luminosity in the UV, but as the photosphere expands and cools, it becomes redder (Kirshner et~al., 1973; Kirshner & Kwan, 1975; Mitchell et~al., 2002; Leonard et~al., 2002; Brown et~al., 2007). Thus, the optical light curve often remains at nearly constant brightness (plateaus) for several weeks.
In spite of the copious number of Type II-P SNe, very few have been well studied in the UV since this requires space-based instruments and a nearby event with low extinction. Recent UV observations have been carried out by the Swift (Gehrels et~al., 2004) UV Optical Telescope (UVOT; Roming et~al. 2000, 2004, 2005), IUE (SN 1987A; Pun et~al. 1995), HST (SN 1999em; Baron et~al. 2000), and GALEX (SN 2005ay; Gal-Yam et~al. 2008). These SNe are UV bright early on and can be seen at great distances, but the UV flux usually fades after a few weeks as the photosphere cools (Brown et~al., 2009). For most distant SNe this means that the late-time UV flux is too faint to be observable. In the rare cases where the SNe were visible in the UV at late epochs, there are indications of a change to a flatter slope, but there is little data at these late times to determine anything definitive.111SN 1987A was extensively observed, but it was also peculiar. This has changed with the advent of SN 2012aw.
SN 2012aw was discovered on 2012 March 16.9 (Fagotti, 2012) in the nearby galaxy M95 (10 Mpc; Freedman et~al. 2001). M95 was observed on March 15.3 (Poznanski et~al., 2012) without a detection to a limiting magnitude of . From this constraint, Fraser et~al. (2012) adopt an explosion date of 2012 March 16.0 0.8d (JD 2456002.5), which we adopt as Day 0 throughout this paper. Pre-explosion images of M95 in the region of SN 2012aw indicate an IR bright star in the vicinity, likely a RSG (Fraser et~al., 2012; Van Dyk et~al., 2012). Follow up spectra (Munari, 2012; Itoh et~al., 2012; Siviero et~al., 2012) identified it as a core-collapse, with a preliminary classification as a Type II-P. The plateau classification is confirmed by the optical photometry from Swift as shown in this paper. The nearness and minimal total extinction (line-of-sight: , host: , with ; Van Dyk et~al. 2012) of SN 2012aw meant that unprecedented UV observations of a SN covering the first 111 days past explosion, could be obtained. We also observed this SN with the UVOT UV grism for approximately two weeks post-explosion, before it faded beyond a reasonable signal-to-noise threshold.
As in prior Type II-P SNe, SN 2012aw is initially UV bright followed by a rapid decline in flux. At about Day 27 the UV light curve slope significantly flattened to a very shallow sloped decline, a UV “plateau.” This UV plateau continued though to Day 111, at which time Swift could no longer observe the SN due to observing constraints. In this paper we present the Swift optical and UV light curves. We also present and compare the time-series UV spectra of SN 2012aw to previously observed spectral models of Type II-P SNe (SN 2005cs and SN 2006bp) and present possible causes of the UV flattening.
2. Observations and Data Reduction
2.1. Swift UVOT Photometry
| Photometric | Magnitudesa | |||||
| JD (+2450000) | uvw2 | uvm2 | uvw1 | u | b | v |
| 6006.2 | 12.200.22 | 12.090.32 | 12.160.12 | 12.320.08 | 13.560.08 | 13.710.07 |
| 6008.0 | 12.830.29 | … | … | … | … | … |
| 6009.8 | … | … | 12.640.09 | … | … | … |
| 6009.9 | 13.340.22 | … | … | … | … | … |
| 6011.9 | … | … | 12.56 | … | … | … |
| 6012.2 | 13.770.22 | … | … | … | … | … |
| 6012.5 | … | … | … | 12.470.14 | … | … |
| 6012.8 | … | … | 12.900.12 | … | … | … |
| 6014.0 | 14.160.25 | 14.010.21 | 13.170.21 | 12.520.12 | 13.530.11 | 13.500.10 |
| 6015.2 | … | 14.410.20 | … | … | … | … |
| 6015.5 | 14.520.11 | … | … | … | … | … |
| 6015.9 | 14.630.21 | 14.640.09 | 13.560.19 | 12.600.12 | 13.550.11 | 13.530.10 |
| 6017.0 | 14.910.17 | … | … | 12.710.27 | … | … |
| 6018.0 | 15.180.16 | 15.300.12 | 14.040.14 | 12.800.12 | 13.580.10 | 13.500.09 |
| 6018.6 | 15.390.10 | 15.680.08 | … | … | … | … |
| 6019.9 | 15.870.14 | 16.100.10 | 14.550.14 | 13.040.14 | 13.650.11 | 13.460.11 |
| 6024.0 | 17.000.11 | 17.640.09 | 15.530.11 | 13.760.14 | 13.790.13 | 13.450.11 |
| 6025.9 | 17.290.11 | 18.170.10 | 15.930.11 | 14.080.14 | 13.860.14 | 13.450.13 |
| 6028.1 | 17.500.11 | 18.360.10 | 16.100.09 | 14.390.12 | 13.960.12 | 13.460.11 |
| 6029.0 | 17.560.10 | … | … | 14.560.31 | … | … |
| 6029.6 | 17.610.10 | … | … | … | … | … |
| 6029.7 | 17.720.12 | … | … | … | … | … |
| 6030.7 | 17.720.10 | 18.940.13 | 16.530.08 | 14.770.10 | 14.090.11 | 13.510.10 |
| 6031.9 | 17.780.10 | … | 16.530.09 | … | … | … |
| 6032.7 | 17.860.13 | … | … | 14.820.09 | … | … |
| 6033.8 | 17.980.11 | 19.330.16 | 16.650.08 | 14.970.09 | 14.190.10 | 13.540.09 |
| 6035.8 | 18.110.11 | 19.440.15 | 16.870.09 | 15.200.11 | 14.270.13 | 13.600.12 |
| 6039.6 | … | 19.520.16 | … | … | … | 13.610.10 |
| 6039.7 | 18.290.11 | … | 16.950.09 | 15.450.10 | 14.360.13 | … |
| 6043.7 | 18.480.12 | 19.620.19 | 17.090.09 | 15.720.08 | 14.460.10 | 13.620.09 |
| 6045.7 | 18.420.11 | 19.660.17 | 17.190.09 | 15.760.09 | 14.520.12 | 13.640.11 |
| 6046.7 | 18.500.11 | 19.910.20 | 17.280.09 | 15.900.09 | 14.540.13 | 13.640.11 |
| 6050.9 | 18.630.12 | 20.190.23 | 17.370.09 | 16.140.09 | 14.640.13 | 13.660.12 |
| 6052.0 | 18.600.12 | 19.830.22 | 17.380.09 | 16.120.08 | 14.690.10 | 13.700.09 |
| 6054.2 | 18.470.11 | 20.080.22 | 17.510.09 | 16.200.09 | 14.670.12 | 13.640.11 |
| 6057.8 | 18.650.12 | 20.400.28 | 17.610.09 | 16.400.08 | 14.800.11 | 13.680.11 |
| 6061.8 | 18.820.12 | 20.530.32 | 17.680.09 | 16.630.08 | 14.840.11 | 13.730.10 |
| 6066.3 | … | … | 17.880.16 | … | … | … |
| 6074.1 | 19.300.16 | 20.260.29 | 17.820.10 | 17.020.09 | 15.030.09 | 13.790.09 |
| 6078.2 | 18.920.13 | 20.330.29 | 17.920.10 | 17.070.09 | 15.110.10 | 13.830.09 |
| 6113.4 | 19.670.20 | 20.70 | 18.420.13 | 18.110.15 | 15.660.08 | 14.220.08 |
| UV GRISM | Start Time | Stop Time | Start Time | Stop Time | exposure | |
| Number | (UT) | (UT) | (JD) | (JD) | (sec) | |
| 1 | 2012-03-21T00:16:24 | 2012-03-21T23:03:24 | 2456007.51 | 2456008.46 | 8287.4 | |
| 2 | 2012-03-23T00:41:04 | 2012-03-24T21:42:08 | 2456009.52 | 2456011.40 | 5116.7 | |
| 3 | 2012-03-25T00:48:24 | 2012-03-26T01:09:46 | 2456011.53 | 2456012.55 | 8021.7 | |
| 4 | 2012-03-28T08:47:25 | 2012-03-28T23:43:28 | 2456014.87 | 2456015.49 | 5663.9 | |
| 5 | 2012-03-30T05:44:24 | 2012-03-30T18:43:24 | 2456016.74 | 2456017.28 | 8978.1 | |
| 6 | 2012-04-11T01:42:00 | 2012-04-11T19:45:40 | 2456028.57 | 2456032.72 | 22759.8 | |
| Spectrophotometric | Magnitudes | |||||
| Number | uvw2b | uvm2 | uvw1 | u | b | vb |
| 1 | 12.979 | 12.494 | 12.348 | 12.327 | 13.335 | 13.019 |
| 2 | 13.467 | 12.963 | 12.545 | 12.344 | 13.353 | 13.028 |
| 3 | 14.701 | 13.522 | 12.897 | 12.390 | 13.330 | 12.989 |
| 4 | 14.867 | 14.520 | 13.566 | 12.560 | 13.369 | 13.063 |
| 5 | 15.050 | 14.929 | 13.934 | 12.685 | 13.435 | 13.120 |
| 6 | – c | – c | – c | 14.649 | 14.059 | 13.482 |
(a) Photometry values in italics are 3 upper limits. All photometric errors are 3.
(b) The spectrophotometric magnitudes for uvw2 and v are only limits as the UV grism does not fill these bandpasses.
(c) The last spectrum blueward of 2940 Å is in the noise level.
SN 2012aw was observed from 2012 March 19 (UT; 3 days post-explosion) to May 30 (JD 2456006.2 to 2456078.2) with the Swift UVOT with a cadence of every one to four days. The UVOT observed in six UV/optical filters: uvw2 ( Å), uvm2 ( Å), uvw1 ( Å), u ( Å), b ( Å), and v ( Å; Poole et~al. 2008). Photometry using a source aperture, including galaxy flux subtraction using a previous Swift UVOT observation of M95 as a template, was performed following the method outlined in Brown et~al. (2009). The data reduction pipeline used HEASOFT 6.6.3 and Swift Release 3.3 analysis tools with UVOT zero-points (Poole et~al., 2008) and updated calibrations (Breeveld et~al., 2011).
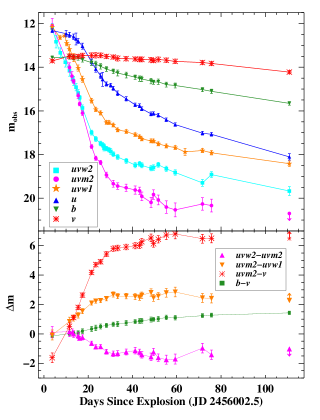
The upper panel of Table 1 gives a summary of the photometric observations. Figure 1 shows the multi-color light curve and UV/optical colors of SN 2012aw. The v- and b-band are largely flat, with declining slopes over the range of observations of and mag/day, respectively ( errors), the characterizing signature of a Type II-P SN. The SN is UV bright initially, but declines rapidly with slopes for the uvw2, uvm2, and uvw1, of , , and mag/day, respectively. After Day 27, the lightcurves flattened into a slowly declining plateau with slopes very similar to the b-band of , , and mag/day, respectively. The u-band light curve had two changes in slope. The initial trend was rather flat, similar to the optical light curves, with a slope of mag/day until about Day 15 (JD 2456018). Then, the u-band followed the trend of the UV light curves, decreasing in brightness at a rate of mag/day until about Day 27-30, where its light curve showed a slower decline of mag/day.
The uvm2 - v color overall becomes quite red, as expected as the photosphere cools. The uvw2 - uvm2 color does become blue initially. This is because the uvm2 flux declines faster than the uvw2 flux. Figure 2 shows the time-series UV spectra evolution, which is described in the following section. The flux near 1900 Å (uvw2) remains nearly constant as the blackbody peak moves through this waveband and there are not many metal lines at this temperature ( 20,000 K; bolometric temperature, see Section 4). Near 2100 Å (uvm2) in the first spectrum there is a flux peak from the absence of iron lines. In the later spectra, this is line blanketed most likely by Ni II. A similar phenomena happened with SN 1987A (Cassatella et~al., 1987).
2.2. Swift UVOT Spectroscopy
Swift UVOT started observing with the UV grism (calibrated for the range Å) on 2012 March 21 (UT; 5 days post-explosion). Spectra from individual images were summed in order to limit the noise in the spectrum (Figure 2). The bottom panel of Table 1 lists the start and end times of each summed observation and the total exposure time. The spectral features are red-shifted due to M95’s recessional velocity of 788 km/s.
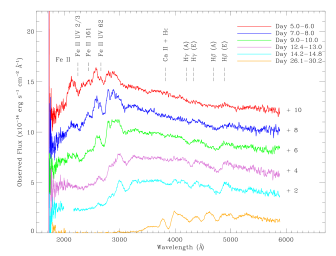
A feature of the Swift UV grism is the ability to observe at offsets from the center (default) position. These positions take advantage of the order separation, which is more pronounced when the grism is not at the default position. This means that the blue part of the spectrum can also be observed in second order, and the contamination of the first order by the second order is reduced substantially. All but the last spectrum were observed at offset positions. The offset was moved closer to the central position as time went on. A new preliminary calibration for the offset positions was used (Kuin et al. 2012, in prep.), which has an accuracy of 15 Å and is reliable to within 20% below 1800 Å and 10% for the UV region between 1800 - 4900 Å. The spectra were extracted following the same procedure as for SN 2011ht (Roming et~al., 2012), using version 0.9.6 of the Python software for UVOT grism analysis 222http://www.mssl.ucl.ac.uk/{. The last spectrum was observed at the central default position because the UV-emission was greatly reduced already, meaning that the blue part of the second order gives minimal contamination to the first order. The first five spectra have second order contamination starting at $∼$ 4900 Å which is responsible for the upward jump in the flux. The last two spectra have some contamination by a zeroth order between 2030 - 2167 Å, which was removed, producing the gap in Figure 2. The background noise level in the spectra is $6 ×10^-16$ ergs cm$^-2$ s$^-1$ Å$^-1$. The last spectrum blueward of 2940 Å is below this noise level.
To check the calibrations we produced spectrophotometric Swift magnitudes from the spectra in Figure 2, which are tabulated in Table 1. The UV grism does not completely cover the uvw2 and the v-band and therefore these are only limits. The UV colors from the last spectra are also only limits because of the noise level. This spectrophotometry is consistent with the photometry to within the errors on the spectra of $∼5-10%$. Because of this and that the UVOT photometry is will studied, we are confident that the UV plateau is a real feature of the SN 2012aw lightcurve.
3. Discussion
3.1. UV Light Curve
The UV light curve fell rapidly and then flattened out approximately one month after the explosion. Unlike many UV filters used, uvm2 has effectively no red leak and therefore we can be confident that the UV plateau is a real feature of the SN. There is a red leak in uvw1 and uvw2, but applying red leak correction (Brown et~al., 2010) still shows the plateau, just $∼2.5$ mag fainter in both filters. The red leak does not contribute at all to the early time lightcurve up to $∼$ Day 21.
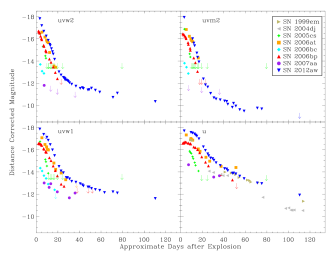
Figure 3 shows the UV and u-band lightcurve of SN 2012aw along with other Type~II-P SNe corrected for distance, but not extinction since the extinction in the host galaxy for several of these is unknown. The worst case scenario is likely SN 2006bc, which has a total $E(B-V)=0.52$, corresponding to $∼4.3$ mag change in uvw2 and uvm2, $∼3.5$ mag change in uvw1, and $∼2.6$ mag change in u-band, assuming the extinction of Cardelli et~al. (1989). This flattening to the UV slope at late times is suggested, but not well observed in the prior UV studies of Type~II-P SNe, as the UV flux fell below detection levels within a few weeks. We also show the ground-based U-band for SN 1999em and 2004dj, which do extend past 100 days. Both of these also show a flat U-band slope, like SN 2012aw. SN 2012aw's UV light curve appears similar in shape to that of SN 2006at, SN 2006bp and possibly SN 2006bc, although the latter has very few observations. The UV light curves of SN 2005cs also appear similar if the lightcurves are shifted forward by a few days.
3.2. UV Spectral Evolution
In Figure 2 the Swift UV spectra are plotted. Since the UVOT is a photon-counting instrument, the flux errors are well understood. They are smallest around 3000 Å, where the sensitivity is highest, and largest below 1800 Å and above 4000 Å. The brightness of the SN is low enough that effects of coincidence loss Poole et~al., 2008; Kuin & Rosen, 2008; Kuin et al. 2012, in prep. are small and dominated by the coincidence loss in the background (Breeveld et~al., 2010). These UV spectra are the most detailed UV spectra of an early Type~II-P SNe. The final spectrum taken two weeks after explosion still shows some near-UV emission.
In Figure 2, the main spectral features are identified. The main spectral absorption minima are blue-shifted by 6000-8000 km/s, while the edge velocities in H$β$ and H$γ$ P-Cygni profiles are $∼$15,000 and $∼$13,000 km/s. The UV end of the spectrum decreases in brightness rapidly over the course of the month. This decrease is likely due to iron line blanketing with the addition of nickel after $∼$ 10 days
Figure 4 shows the SN 2012aw observed spectra along with two spectral models for nearly the same post-explosion time. The models are from Dessart et~al. (2008) and were originally created from the analysis of Swift UVOT data of SN 2005cs and SN 2006bp. The model parameters of SN 2006bp and 2005cs (given in Table 6 and Table 7 of Dessart et~al. 2008) have been extinction corrected from the empirical extinction formula of Cardelli et~al. (1989) using the same Milky Way reddening for SN 2012aw of $E(B-V)=0.025$ mag (Schlafly & Finkbeiner, 2011). Van Dyk et~al. (2012) has shown that the reddening of the host galaxy is $E(B-V)=0.08$, but Kochanek et~al. (2012) suggest that it is even less.
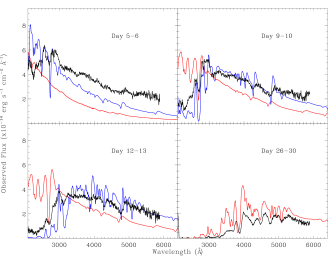
Gal-Yam et~al. (2008) suggest that all SNe Type~II-P should be very similar, which is seen here with the SN 2012aw spectrum falling largely in between the two models. According to Dessart et~al. (2008), the main difference between SN 2006bp and SN 2005cs is that SN 2005cs may be intrinsically faint with low kinetic energy in the ejecta. However, it is not surprising that there some are discrepancies between the models and the observations of SN 2012aw. The best UV spectral models are based on early time spectra and late time photometry, including these. Now that there are late time UV spectral observations of a normal Type II-P (versus the peculiar SN 1987A), improvements to the spectral models can be made.
4. Conclusions
SN 2012aw shows the same optical light curve behavior as other Type~II-P SNe, namely an optical plateau due to the reprocessing of hydrogen recombination emission. This SN was also UV bright early on and faded rapidly in the same manner as other observed Type~II-P SNe. However, at late epochs, after Day 27, the light curve slope flattened to a much slower decline. At these later times, the UV lightcurve uniquely gives information on temperature changes. Thus, the UV flattening indicates that the temperature is remaining constant, which requires a source of heating to maintain the photosphereic temperature. Some possible sources of late-time heating are continued recombination, radioactive decay, or a combination of these.
Past Day 27, as the UV slope flattens, the $uvm2-v$ color flattens and the temperature flattens. The bolometric temperature as calculated from the UVOT filters uvw1 and uvw2 and ground-based UBVRIJHK (Dall'Ora et al., in prep) becomes constant at $∼$ 4500~K. A blackbody temperature of 4500~K would have a color of $uvm2-v = 4.1$ mag including the Van Dyk et~al. (2012) reddening, but we observe $uvm2-v ∼6$ mag. The difference in color is likely due to line blanketing. We note, however, that there have been some indications of a higher reddening value from Dall'Ora et al. (in prep) if there is significant dust present after the explosion. They suggest an $E(B-V)=0.27$, which would produce a 4500~K blackbody color of $uvm2-v = 5.3$. If this is so, then line blanketing may be less significant and the SN was intrinsically brighter.
The UV plateau in SN 2012aw is not seen in the other UV observed SNe because most were either too extincted (SN 2006bc: $E(B-V)=0.19$ -- line of sight Schlafly & Finkbeiner 2011; $E(B-V)=0.33$ -- host Otsuka et~al. 2012) or too far away (SN 2007aa: 20.5 Mpc, Smartt et~al. 2009; SN 2006at: 64 Mpc, Blondin et~al. 2006). SN 2005cs was nearby (in M51) and not very extincted, but Dessart et~al. (2008) suggest that it was sub-luminous. SN 2006bp is the best comparison and has indications that the lightcurve was beginning to flatten, but it too was fairly distant and extincted (17.5 Mpc, $E(B-V)=0.37$ host; Dessart et~al. 2008) and was not detected in the UV approximately a month after explosion. Thus, we have lengthy observations of a normal Type II-P SNe that is nearby allowing us to observe the UV plateau for the first time.
Because of SN 2012aw seeming similarity to SN 2006bp and at least the initial data of the other SNe, this UV plateau phase could be ubiquitous.333We note that galactic template subtractions are sometimes done with post-explosion data. We caution that there may be SN UV flux even at late times in low-extinction SNe. However, as SN 2012aw is the first we can only confirm this with additional observations of nearby Type II-P SNe.
References
- Baron et~al. (2000) Baron, E., Branch, D., Hauschildt, P.~H., et~al. 2000, ApJ, 545, 444
- Blondin et~al. (2006) Blondin, S., Modjaz, M., Kirshner, R., et~al. 2006, Central Bureau Electronic Telegrams, 441, 1
- Breeveld et~al. (2011) Breeveld, A.~A., Landsman, W., Holland, S.~T., et~al. 2011, in American Institute of Physics Conference Series, Vol. 1358, American Institute of Physics Conference Series, ed. J.~E. McEnery, J.~L. Racusin, & N.~Gehrels, 373--376
- Breeveld et~al. (2010) Breeveld, A.~A., Curran, P.~A., Hoversten, E.~A., et~al. 2010, MNRAS, 406, 1687
- Brown et~al. (2007) Brown, P.~J., Dessart, L., Holland, S.~T., et~al. 2007, ApJ, 659, 1488
- Brown et~al. (2009) Brown, P.~J., Holland, S.~T., Immler, S., et~al. 2009, AJ, 137, 4517
- Brown et~al. (2010) Brown, P.~J., Roming, P.~W.~A., Milne, P., et~al. 2010, ApJ, 721, 1608
- Cardelli et~al. (1989) Cardelli, J.~A., Clayton, G.~C., & Mathis, J.~S. 1989, ApJ, 345, 245
- Cassatella et~al. (1987) Cassatella, A., Fransson, C., vant Santvoort, J., et~al. 1987, A&A, 177, L29
- Dessart et~al. (2008) Dessart, L., Blondin, S., Brown, P.~J., et~al. 2008, ApJ, 675, 644
- Elmhamdi et~al. (2003) Elmhamdi, A., Danziger, I.~J., Chugai, N., et~al. 2003, MNRAS, 338, 939
- Fagotti (2012) Fagotti, P. 2012, CBET, 3054, 1
- Fraser et~al. (2012) Fraser, M., Maund, J.~R., Smartt, S.~J., et~al. 2012, ApJ, 759, L13
- Freedman et~al. (2001) Freedman, W.~L., Madore, B.~F., Gibson, B.~K., et~al. 2001, ApJ, 553, 47
- Gal-Yam et~al. (2008) Gal-Yam, A., Bufano, F., Barlow, T.~A., et~al. 2008, ApJ, 685, L117
- Gehrels et~al. (2004) Gehrels, N., Chincarini, G., Giommi, P., et~al. 2004, ApJ, 611, 1005
- Itoh et~al. (2012) Itoh, R., Ui, T., & Yamanaka, M. 2012, CBET, 3054, 2
- Kirshner & Kwan (1975) Kirshner, R.~P., & Kwan, J. 1975, ApJ, 197, 415
- Kirshner et~al. (1973) Kirshner, R.~P., Oke, J.~B., Penston, M.~V., & Searle, L. 1973, ApJ, 185, 303
- Kochanek et~al. (2012) Kochanek, C.~S., Khan, R., & Dai, X. 2012, ApJ, 759, 20
- Kuin & Rosen (2008) Kuin, N.~P.~M., & Rosen, S.~R. 2008, MNRAS, 383, 383
- Leonard et~al. (2002) Leonard, D.~C., Filippenko, A.~V., Li, W., et~al. 2002, AJ, 124, 2490
- Li et~al. (2011) Li, W., Leaman, J., Chornock, R., et~al. 2011, MNRAS, 412, 1441
- Mitchell et~al. (2002) Mitchell, R.~C., Baron, E., Branch, D., et~al. 2002, ApJ, 574, 293
- Munari (2012) Munari, U. 2012, CBET, 3054, 3
- Otsuka et~al. (2012) Otsuka, M., Meixner, M., Panagia, N., et~al. 2012, ApJ, 744, 26
- Poole et~al. (2008) Poole, T.~S., Breeveld, A.~A., Page, M.~J., et~al. 2008, MNRAS, 383, 627
- Poznanski et~al. (2012) Poznanski, D., Nugent, P.~E., Ofek, E.~O., Gal-Yam, A., & Kasliwal, M.~M. 2012, The Astronomer's Telegram, 3996, 1
- Pun et~al. (1995) Pun, C.~S.~J., Kirshner, R.~P., Sonneborn, G., et~al. 1995, ApJS, 99, 223
- Roming et~al. (2000) Roming, P.~W., Townsley, L.~K., Nousek, J.~A., et~al. 2000, in Society of Photo-Optical Instrumentation Engineers (SPIE) Conference Series, Vol. 4140, Society of Photo-Optical Instrumentation Engineers (SPIE) Conference Series, ed. K.~A. Flanagan & O.~H. Siegmund, 76--86
- Roming et~al. (2004) Roming, P.~W.~A., Hunsberger, S.~D., Mason, K.~O., et~al. 2004, in Society of Photo-Optical Instrumentation Engineers (SPIE) Conference Series, Vol. 5165, Society of Photo-Optical Instrumentation Engineers (SPIE) Conference Series, ed. K.~A. Flanagan & O.~H.~W. Siegmund, 262--276
- Roming et~al. (2005) Roming, P.~W.~A., Kennedy, T.~E., Mason, K.~O., et~al. 2005, Space Sci. Rev., 120, 95
- Roming et~al. (2012) Roming, P.~W.~A., Pritchard, T.~A., Prieto, J.~L., et~al. 2012, ApJ, 751, 92
- Schlafly & Finkbeiner (2011) Schlafly, E.~F., & Finkbeiner, D.~P. 2011, ApJ, 737, 103
- Siviero et~al. (2012) Siviero, A., Tomasella, L., Pastorello, A., Benetti, S., & Munari, U. 2012, CBET, 3054, 4
- Smartt et~al. (2009) Smartt, S.~J., Eldridge, J.~J., Crockett, R.~M., & Maund, J.~R. 2009, MNRAS, 395, 1409
- Tsvetkov et~al. (2008) Tsvetkov, D.~Y., Goranskij, V., & Pavlyuk, N. 2008, Peremennye Zvezdy, 28, 8
- Van Dyk et~al. (2012) Van Dyk, S.~D., Cenko, S.~B., Poznanski, D., et~al. 2012, ApJ, 756, 131