Stuck in Traffic (SiT) Attacks:
A Framework for Identifying Stealthy
Attacks that Cause Traffic Congestion
Abstract
Recent advances in wireless technologies have enabled many new applications in Intelligent Transportation Systems (ITS) such as collision avoidance, cooperative driving, congestion avoidance, and traffic optimization. Due to the vulnerable nature of wireless communication against interference and intentional jamming, ITS face new challenges to ensure the reliability and the safety of the overall system. In this paper, we expose a class of stealthy attacks – Stuck in Traffic (SiT) attacks – that aim to cause congestion by exploiting how drivers make decisions based on smart traffic signs. An attacker mounting a SiT attack solves a Markov Decision Process problem to find optimal/suboptimal attack policies in which he/she interferes with a well-chosen subset of signals that are based on the state of the system. We apply Approximate Policy Iteration (API) algorithms to derive potent attack policies. We evaluate their performance on a number of systems and compare them to other attack policies including random, myopic and DoS attack policies. The generated policies, albeit suboptimal, are shown to significantly outperform other attack policies as they maximize the expected cumulative reward from the standpoint of the attacker.
I Introduction
In the area of Intelligent Transportation Systems (ITS), vehicle-to-vehicle and vehicle-to-infrastructure communications enable many potential applications such as collision avoidance, cooperative driving, congestion avoidance, and traffic optimization [1, 2, 3, 4, 5]. With recent advances in wireless technologies, the FCC has allocated a frequency band of about 75MHz in the 5.9 GHz band for Dedicated Short Range Communications (DSRC) for public safety services [6]. The associated MAC layer can be based on WLAN (IEEE 802.11p) or 3G cellular extended with TDMA and CDMA for decentralized access when no infrastructure is present [7, 8].
Due to the shared nature of the wireless channels used, the overall safety of the ITS is affected by interference and intentional jamming by adversaries. Jamming has been shown to cause severe effects that may cripple the whole system [9, 10, 11, 12, 13, 14]. Previous incidents indicate the possibility of interfering with these communication mediums [15]. By placing jamming devices in vehicles and at critical transportation points (bridges, tunnels, cellular towers, etc…), an adversary can impact the overall traffic flow, exploit the adaptation of the drivers to make abrupt decisions causing accidents, or attempt to maximize their gain by preventing critical information from reaching a neighboring subset of vehicles [16, 17]. A much worse scenario may occur if a terrorist can create severe congestion in an area before detonating a bomb.
As drivers increase their reliance on wireless signals in making decisions, the absence or even the delay of these signals may have catastrophic effects due to the real-time constraints present in the system. Although it may be still years for autonomous vehicles to become the main stream (with all the challenges currently present), nowadays, we rely on real-time traffic information to make driving decisions. Moreover, many vehicles are already equipped with wireless connections to invoke traffic services.
Paper scope: Drivers are typically faced with a decision making process whenever they encounter alternatives in choosing their routes. For example, should a driver use the upper or lower level when driving across George Washington Bridge? Should a driver use a highway or a local access road for a given short trip? The decisions made are not random, but are typically aided by traffic signs (e.g., reflecting the delay or the expected time to reach a particular point) and/or online map services (e.g., Google maps with traffic information). The goal is to reduce congestion as much as possible. It is known that traffic congestion is a significant problem that costs the US billions of dollars. In 2010, and across 439 urban areas, traffic congestion came at the price of 4.8 billion hours of extra driving time and 1.9 billion gallons of fuel. The cost to the average commuter was $713 in 2010 [18].
When wireless signals are used to communicate important information to drivers – perhaps through smart traffic signs and wireless transceivers in vehicles – jamming a subset of the signals may impact the overall traffic flow leading to unchecked safety conditions. In this paper, we expose a class of stealthy attacks – that we term Stuck in Traffic (SiT) attacks – that aim to cause congestion. Through solving a Markov Decision Process (MDP) problem, an attacker mounting a SiT attack selects a subset of signals to interfere with. The choice of signals is based on the current state conditions of the system, taking into account the exposure risk the attacker is willing to take. Due to the exponential nature of the state space that describes the system, solving the MDP exactly is computationally prohibitive. Thus, we apply approximate policy iteration methods to solve the MDP problem to identify suboptimal, yet efficient, attack policies.
Contributions: The use of wireless technologies in various traffic safety applications is becoming the norm. Thus, it is important to expose potential security issues before deployment. In particular, we make the following contributions:
-
•
We provide a general framework for identifying stealthy attacks that reflect the best interest for an attacker: minimizing the cost while maximizing the damage.
-
•
We expose SiT attacks that aim to cause traffic congestion through a proper choice of which signals to interfere with and when.
-
•
In almost all the cases studied, we were able to identify attack policies that are more potent than traditional DoS attacks and random attacks, among other policies. Furthermore, the generated policies are shown to significantly outperform myopic and random attack policies.
II Related Work
The work in this paper relates to two main areas of research: (1) safety applications through V2V and V2I wireless communication and (2) security in vehicular networks.
Traffic safety and management applications: There has been a large body of work in the area of ITS that utilizes wireless signals for various safety and congestion management applications. In [2], the authors relied on wireless communication to develop different cooperative collision warning assistants for forward collision warning, intersection collision and lane changes. In [1] the authors investigate the impact of DSRC on the latency and the success probability in Forward Collision Warning applications. The work in [19] proposes a safety application in which each vehicle is aware of its nearest neighbors through V2V communication. The architecture is envisioned for various safety scenarios, such as collision avoidance, pre-crash sensing, traffic optimization and lane changes warning. In [20], Dresner et al. devised a scheme in which vehicles can avoid congestion in intersections by not stoping at all. The idea is that vehicles, through wireless communications, reserve slots in space and time at the intersection managers.
Security in vehicular networks: There has also been a large number of research studies that focused on the security of vehicular networks. Leinmüller et al. studied the effects of false-position data on geographic routing in VANETs [21]. It was shown that malfunctioning and/or malicious nodes broadcasting false position information can lead to packet losses, routing delays and traffic interception, and hence can drastically affect the performance, reliability and security of position-based routing networks.
A model for attacks on inter-vehicle communication systems was proposed in [17] wherein the goals and logistics of various attacks are expressed in terms of attack trees. These trees, which help understand and classify attacks, are used to expose weaknesses and identify potential threats facing such systems.
Stealth attacks whereby an attacker partitions an ad-hoc network or hijacks traffic were studied in [22]. A key idea is to keep a low exposure and to minimize the cost of the attack through manipulation of the routing information of well-behaving nodes.
Other attacks on vehicular networks include Sybil attacks used to inject false messages into a vehicular network through use of false identities [23], DoS attacks through jamming the communication channels, impersonation by using fake identities, and bogus information attacks wherein wrong data could be diffused in the network, for example to divert traffic from a given road. In the SiT attack we consider herein, the propagation of false information about traffic conditions is indirectly inflicted by the attacker when the latter interferes with some of the signals from the vehicles to their neighboring access points leading to global traffic congestion. For a summary of various potential attacks on vehicular networks we refer the reader to [24] and references therein.
III A General Framework
In this section we present a framework that enables the identification of stealthy SiT attack policies that aim to create traffic congestion.
III-A The Model
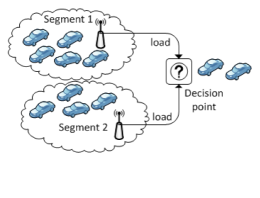
We consider a vehicular network that is composed of a set of segments and a decision point. A segment is a portion of an infrastructure (e.g., highway, bridge or a tunnel) that is controlled by one access point. As vehicles utilize a segment, they send wireless signals to the access point for the segment to get an estimate of its current load (e.g., number of vehicles). The access point reports its measurement back to a decision point to influence future incoming traffic. Each segment presents an alterative route to the driver. A decision point is a location at which drivers must make an “educated” decision on which segment to use (e.g., at highway entrance points and intersections). At each decision point, the load on each segment is presented to the driver. Figure 1 shows a diagram describing the setup.
We consider a discrete-time model in which at each time step, new vehicles arrive at a decision point based on some arrival process. For simplicity, we assume an infinite population of vehicles for the arrival process. Based on the loads displayed, a driver picks an appropriate segment. Vehicles exit each segment based on its service rate.
Let denote the arrival rate at the decision point at time , , denotes the admission ratio of vehicles on segment at time , and , denotes the service rate for segment at time , where is the total number of segments. Then the number of vehicles, on segment at time is given by:
| (1) |
Throughout the paper, we assume that the service rates are known and fixed.
Depending on the traffic optimization policies, the admission ratio for each segment is determined based on the number of vehicles on all segments according to the following equation:
| (2) |
where is a traffic optimization function and is the estimate of the queue length of segment at time . For example, the admission ratios can be chosen proportionally based on the number of vehicles on each segment, weighted by the service rate of each segment, or simply by picking the least loaded segment.
III-B SiT Attacks
The goal of SiT attacks is to cause traffic congestion by jamming a subset of the wireless signals from the vehicles to the access points leading to incorrect estimates displayed for drivers, and consequently wrong decisions made by the drivers (e.g., choosing a congested segment). To reflect their stealthy nature, an attacker pays a price whenever he/she decides to jam a wireless signal. Clearly, if the cost of jamming is very high, SiT attacks would not jam any signal and if the cost of jamming is very low, SiT attacks would jam all the time (i.e., DoS attack). We are interested in identifying attacks policies that tradeoff damage and cost. In particular, we are interested in identifying attack policies that can decide the proper attack action based on the current state of the system.
Let denote the state of the system at time , where is the state space at time . The state of the system is the combination of the queue lengths and . Based on the number of new arrivals and the admission ratios, the state is updated at the next time step.
The goal of the attacks is to unbalance the incoming traffic across segments by selectively choosing what signal(s) to attack at any state, if any. Let denote the control action of the attacker at time and the control space at time , which depends on the actual state . Note that the estimates , of the queue lengths are function of the attacker’s control action and the true queue lengths , i.e.,
| (3) |
where is some function, which for simplicity is assumed to be known to the attacker. Equations (1), (2) and (3) define the state dynamics. Note that from the attacker’s standpoint, the state consists not only of the queue lengths , but also the admission ratios , since even for given values of the queue lengths, the attacker’s course of action will change depending on the advertised admission ratios for the various segments.
The attacker’s action at time is obtained through a policy , which is defined as a mapping from the state space to the control space, i.e., .
Let denote the reward obtained when the system evolves from state to state , under attack action . The reward can be described by the following equation:
| (4) |
where is the damage function and is the cost function of the attack action . An attack action becomes more appealing if it can cause higher damage with less cost.
The infinite horizon expected reward is given by
| (5) |
where is the initial system state and is a discount factor. Since the function is bounded and , the reward function (5) is well defined.
The attacker is interested in maximizing the total expected discounted rewards over the choice of attack policies. Hence, the goal is to compute the solution to
| (6) |
In other words, the adversary aims to maximize the cumulative expected discounted reward over time by choosing attack policies , as shown in (6). The problem now falls within the class of infinite horizon problems with discounted reward. Hence, a stationary policy , i.e., which does not depend on , is optimal. The optimal attack policy can be obtained by solving the following Bellman equation [25]:
| (7) |
where is the optimal value function. The first term on the R.H.S. represents the immediate stage reward in (4) and the second term is the future reward. The conditional probability is the probability of a transition of the system to future state from state under attack action , and hence the summation in the second term is over all possible future states, from . Solving the fixed point equation above gives the optimal tradeoff between damage and cost from the standpoint of the adversary.
Due to the large state space, solving the above equation may not be computationally feasible. Thus, we propose an approximate policy iteration method [26, 27, 28]. Before we describe the approximate policy iteration methodology, we provide some brief background on exact policy iteration.
Exact Policy iteration consists of 2 steps: policy evaluation and policy improvement. In the policy evaluation step, we start with an initial policy . Then, we solve a system of linear equations to evaluate the cost function starting from state and using policy :
| (8) |
where the summation is over the set of states that can be reached from state and is the reward obtained from the transition from to every state in under policy . In the policy improvement step, an improved policy is generated according to the following equation:
| (9) |
The improved policy is the one that maximizes the reward through selecting the best attack action , from the set of actions available from state . The improved policy is then used as the new policy and a new iteration starts.
One of the main challenges with exact policy iteration is the size of the state space. Even for a small system with 2 segments with each potentially holding up to 100 vehicles, the size of the state space is , without accounting for the which has a similar order of magnitude.
In the approximate policy iteration variant, we run Monte Carlo simulations to evaluate the current policy rather than solving the system of linear equations. We approximate with a parametric representation :
| (10) |
where is a column of features, is a row of weights (one for each feature), and is the number of those features. The idea is to extract features that characterize state and approximate by selecting that solves a least square problem between the rewards obtained from the Monte Carlo simulations and the cross product of . It is known that the linear combination of well chosen features can capture essential nonlinearities in the reward function [29, 30, 31].
III-C Feature Selection
Due to the approximate nature of our proposed methodology, we must rely on a set of representative features to capture the fundamental characteristics of the state. We used the following features to approximate the value function for state with:
-
1.
The number of vehicles on each segment.
-
2.
The degree of imbalance between the number of vehicles on each segment (weighted by their departure rates when segments have different service rates).
-
3.
The segment that is the least occupied.
-
4.
The admission ratios reported to the drivers.
-
5.
Difference between the true admission ratio (that is based on the true occupancy of vehicles) and the one utilized by drivers at the decision point.
-
6.
How far the admission ratio is from the ideal one (e.g., 0.5 in case of two identical segments).
-
7.
A flag to indicate whether the two segments are empty or not.
III-D Performance Metrics
Throughout this work, we focus on different metrics/functions for assessing damage and cost. The damage function due to a SiT attack can be instantiated as the imbalance between different segments, weighted by their service rates. Another possible instantiation is the gap between the admission ratios reported to the drivers and the “true” admission ratios that should have been reported. Our model can also be easily extended to account for other forms of damage such as queueing delays and other factors that typically occur under congestion. For example, it is expected that the service rates of segments decrease as the number of vehicles increase. Similarly, different instantiation for the cost function are possible. The motivation behind the ones we consider in this paper is that as the number of attacked vehicles increases, the attack can be more exposed and thus the cost of the attack should reflect such a greater risk of exposure.
Since the attacker must select an attack cost, it is not clear what would be a reasonable choice for a given problem. By varying the attack cost, however, an attacker can discover different polices. In this paper, we are interested in stealthy attacks, thus we focus on a smaller region of the attack cost values where the resulting policy is not a complete DoS-like attack nor a no-attack policy. This is obtained through trial and error until the interesting region is found.
IV Performance Evaluation
In this section we report on our evaluation of the approximate policy iteration (API) methods on a number of systems that are instantiated from the model described in Section III. In this paper we limit our evaluation to systems with two alternate segments. We fix the discount factor to 0.99.
IV-A System One
Consider a system composed of 2 segments and 1 decision point. Vehicles arrive to the decision point per unit time based on the following probability distribution: 3 vehicles with probability 0.3, 8 vehicles with probability 0.6 and 30 vehicles with probability 0.1. Thus the average arrival rate is 8.7. We assume the two segments are identical and each one has a maximum service rate of 5 vehicles per unit time. Based on the reported number of vehicles on each segment, the decision point reflects the admission ratio for each segment to balance traffic between the segments. In this system we assume that all the drivers follow the information displayed.
An attacker mounting a SiT attack jams a subset of the signals from vehicles to the access point. We assume that a SiT attack only affects 50% of the vehicles. Thus, the estimate in (3) becomes whenever the attacker decides to attack. We take the cost function, , to be a constant value, , multiplied by the number of vehicles affected.
In this system, the attacker aims to unbalance the traffic between the two segments. We instantiate the damage function, , to be the absolute difference between the number of vehicles on each segment:
| (11) |
At any state, the attacker can choose between the following actions:
-
1.
Not attack with cost 0.
-
2.
Attack half the vehicles on segment 1 with cost .
-
3.
Attack half the vehicles on segment 2 with cost .
We start our approximate policy iteration method from 32 representative states that are chosen at 25 increments to give good coverage of the state space. Moreover, half those states reflect the true admission ratio while the other half have admission ratios chosen at random. We start with a random policy as a roll-out one. From each representative state, we run 50 independent trajectories and we compute the average reward across them. In each trajectory, we simulate the attack policy for 100 steps. In each iteration, a new policy is generated and we keep track of the weight vector that produces the policy with the maximum reward.
Once the weight vector is obtained, we compare between policies based on a completely different set of states that are generated at random. In other words, there is no intentional overlap between our training data and the ones we use for evaluation.
It is important to note that with approximate policy iteration methods, there are no guarantees that the system will converge (i.e., no guarantee that the resulting policy is an improvement of the previous one) as with exact policy iteration. Thus, we do not have a termination method except to run for a large number of iterations and to choose the best policy. We typically use between 100 and 1000 iterations.
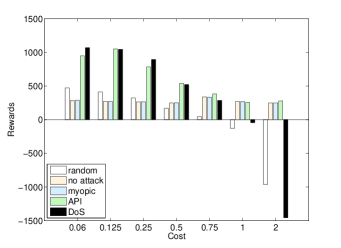
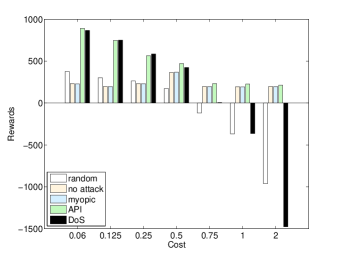
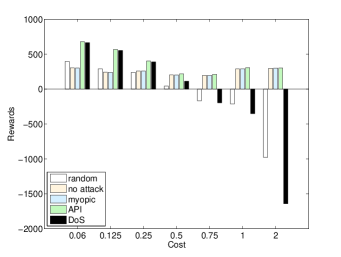
Figure 2 shows the rewards obtained for different cost values under different policies. Figure 2 (top) is for attack success rate 100%, Figure 2 (center) is for attack success rate 75%, and Figure 2 (bottom) is for attack success rate 50%. We compare our Approximate Policy Iteration (API) to a no-attack policy, a random attack, a DoS attack on one of the segments, and a myopic attack (in which only the immediate reward is used to select an action without regard to the future reward). We only show the interesting region based on the attack costs. If the cost of the attack is very low, API matches a DoS attack and if the cost of the attack is very high, API matches a no-attack policy. One can see that API tracks the best policies very well and in the majority of the cases it provides the policy with the highest reward.
Notice also that the performance of the API method appears to improve as the degree of certainty in the attack success rate decreases. With an attack success rate of 50%, the API method was consistently better than all policies across all costs, whereas with higher attack success rates, the performance may be slightly less than some policies. This is the case because the API method takes the success rate into account which choosing actions that achieve a balance between the immediate and the future rewards.
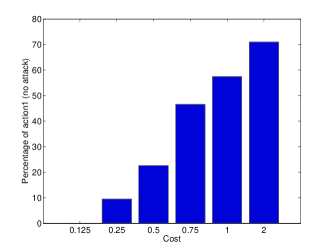
Figure 3 shows the percentage of time the no-attack action was selected as we vary the cost of the attack. The results are shown for System one with 75% attack success rate. One can see that our proposed policy smoothly adjusts the level of aggression based on the cost of the attack.
| Attack Cost | 0.06 | 0.125 | 0.25 | 0.5 | 0.75 | 1 | 2 |
|---|---|---|---|---|---|---|---|
| 50% (500 iter) | 473 | 357 | 238 | 248 | 318 | 378 | 375 |
| 75% (100 iter) | 98 | 32 | 2 | 79 | 76 | 65 | 62 |
| 100% (1000 iter) | 812 | 970 | 659 | 328 | 460 | 284 | 669 |
Table I shows the number of iterations it took to reach the best policy for System One under different attack costs and for different attack success probabilities. Throughout our evaluation, we limited the number of iterations below 1000. Finding the best policy changes from a system to another and depends on our choice of roll-out policies and on the randomization within the framework. We listed those values here as a mean to share our experience with the API methods.
IV-B System Two
Our second system is a variant of the first system, but covers a wider attack scope. In particular, we assume that an attacker can decide between different SiT attack intensities by choosing between the following actions:
-
1.
Not attack with cost 0
-
2.
Attack 25% of vehicles on segment 1 with cost
-
3.
Attack 50% of vehicles on segment 1 with cost
-
4.
Attack 75% of vehicles on segment 1 with cost
-
5.
Attack 25% of vehicles on segment 2 with cost
-
6.
Attack 50% of vehicles on segment 2 with cost
-
7.
Attack 75% of vehicles on segment 2 with cost .
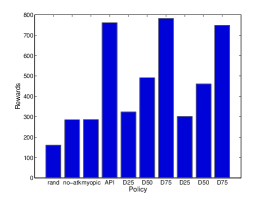
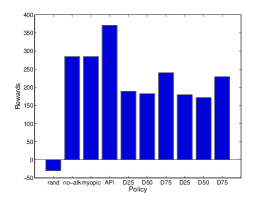
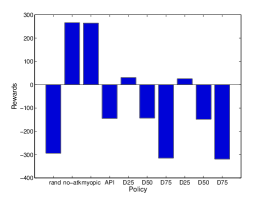
Figure 4 shows results for System Two under three different attack costs (0.5, 0.75 and 1). We compare between random, no attack, myopic, API, and DoS attacks at various levels on both segments (D25, D50 and D75 indicate attacking 25%, 50% and 75% of the vehicles on a segment, respectively). When the cost of the attack is low (left), API matches the most aggressive DoS attack. When the cost is 0.75 (center), API outperforms all the policies. Note, however, that under attack cost, 1, we failed to find a good policy, since API does worse than some of other policies. As noted above, this can happen with approximation methods. The algorithm can get stuck in local maxima or needs more iterations to find better policies. One approach to tackle this issue is to force different roll-out policies or introduce randomization within the obtained policy (e.g., choose a subset of actions at random regardless of the policy) [32]. We leave this issue for future investigation.
(a)
(b)
(c)
(d)
IV-C System Three
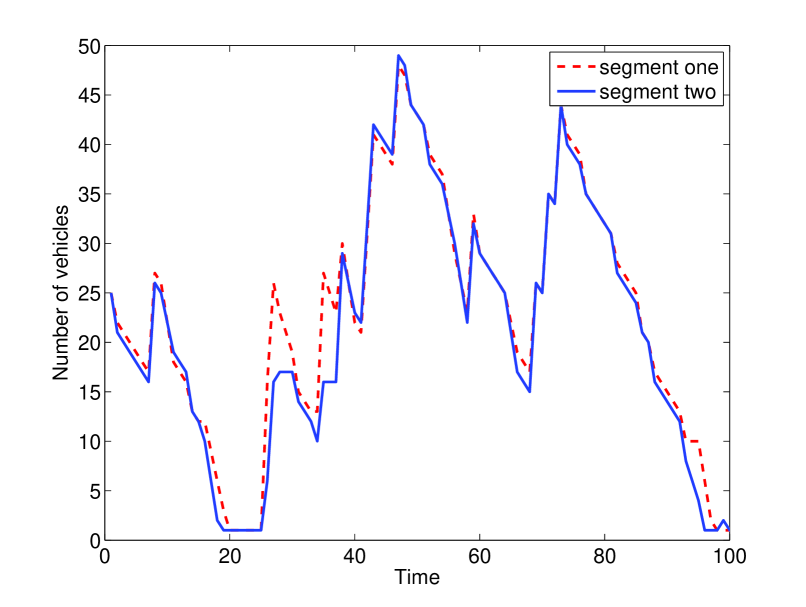
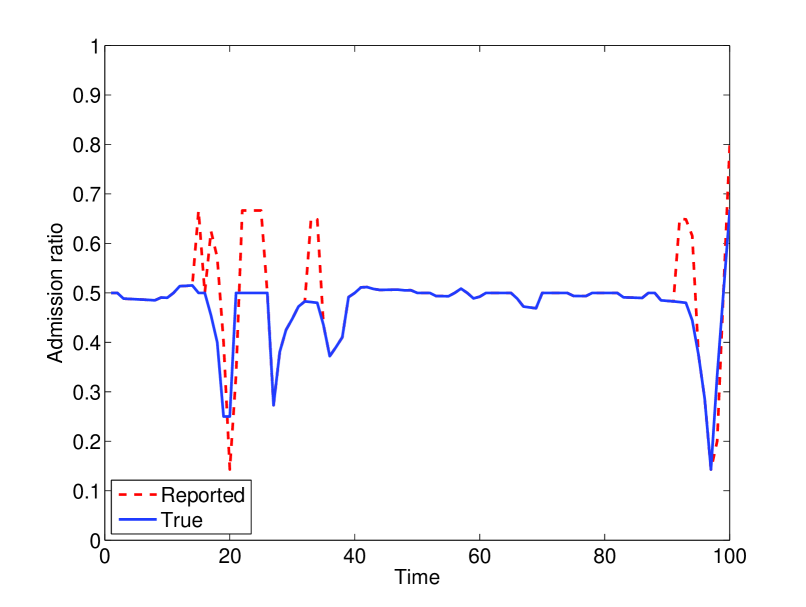
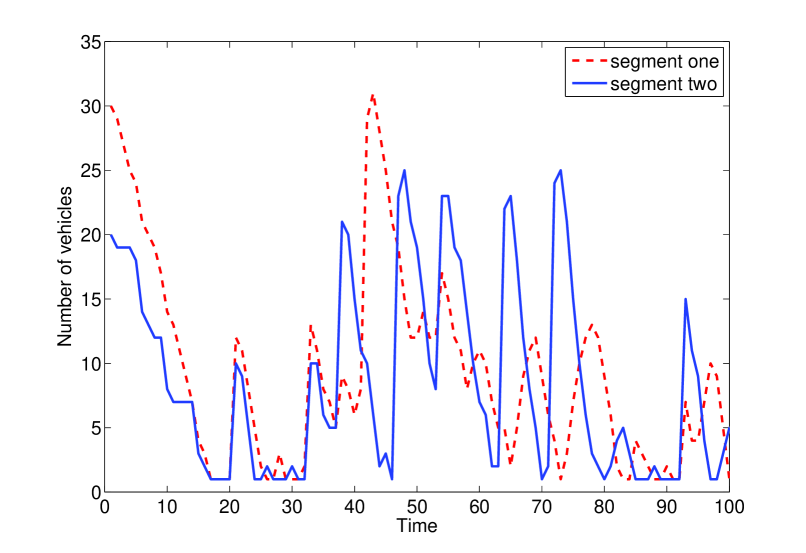
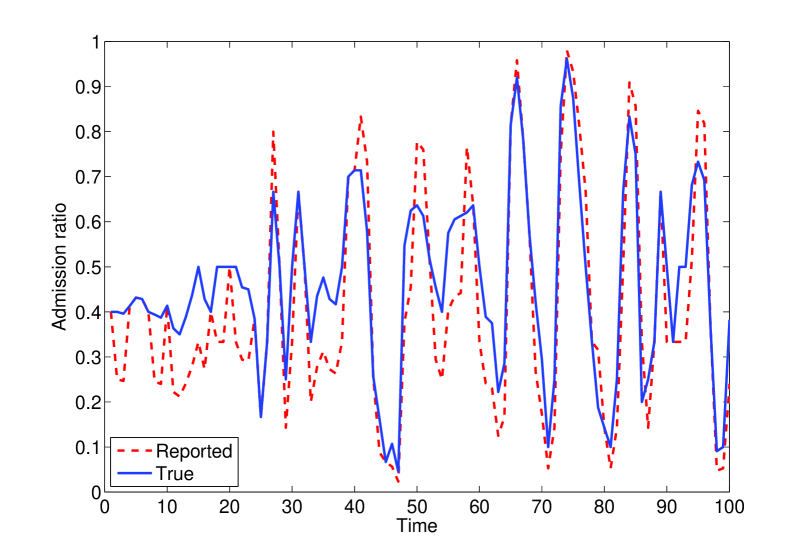
In this system, we consider the case when segments have different service rates. To make valid comparisons, we use the exact system as System One except that the maximum service rate for segment 1 is 4 vehicles per unit time and for segment 2 is 6 vehicles per unit time. Both systems started with the same total number of vehicles weighted by their service rates. The initial admission ratio reflected the true admission ratio. Figure 5 shows the number vehicles on each segment and the admission ratio for System One (top row) and those for System Three (bottom row). Results are presented for Cost 2. When the attacker decides not to attack, the admission ratio reported matches the true admission ratio.
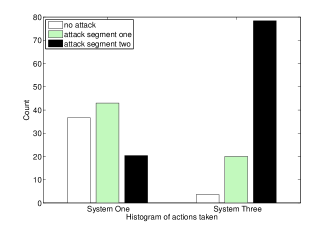
We have found that, under the same cost, attacks on systems that have segments with different service rates lead to higher attack reward than attacks on systems that have segments with identical service rates. Figure 6 shows the average number of different actions taken by the attacker under cost 2, for both systems. One can see that for system three, the best attack policy attacks either one of the segments more than 90% of the time when compared to system one in which the best attack policy attacks either one the segments only around 65% of the time.
V Conclusions
Traffic safety applications are increasingly relying on wireless technologies in transforming our transportation system through empowering drivers to make good decisions, improving their safety and reducing the overall cost. Currently, the development of many ITS applications and standards are underway. Thus, it is crucial to expose vulnerabilities at this early phase before deployment and to have the appropriate defense mechanisms in place once these systems become operational. In this paper, we developed a framework that is capable of exposing stealthy SiT attacks that aim to cause traffic congestion by selectively interfering with a subset of the signals from vehicles to the infrastructure. We have evaluated the generated attack policies and demonstrated their potency when compared to other policies such as myopic, random and DoS attacks. Unlike other policies, the proposed policy judiciously adapts to the system parameters (e.g., queue lengths, costs, and service rates) to select attack actions that balance between the current stage and future rewards. Moreover, we have shown that our proposed policy performs better as the degree of uncertainty in the system increases, making it appealing to adversaries that may not be confident of the exact impact of the attack. Furthermore, through our evaluation we have demonstrated that systems that employ segments with different service rates are more susceptible to attacks than those employing segments with similar service rates. To the best of our knowledge, this work is the first to look at the effect of jamming attacks through an MDP framework and to apply approximation techniques to identify optimal/suboptimal stealthy policies.
We are currently investigating the impact of feature selection on the resulting policies and what constitutes a good set. We are also looking at systems in which the service rates for the different segments changes based on the number of vehicles present. Another direction we are working on is the development of defense techniques against SiT attacks. In particular, we are looking at the use of randomization techniques to prevent an attacker from implicitly adjusting the admission ratios.
Acknowledgment
This work is supported by the CNS NSF grant #1149397.
References
- [1] T. Elbatt, S. Goel, G. Holl, H. Krishnan, and J. Parikh, “Cooperative Collision Warning Using Dedicated Short Range Wireless Communications,” in Proceedings of the 3rd international workshop on Vehicular Ad-hoc Networks (VANET), Los Angeles, CA, September 2006.
- [2] J. Misener, R. Sengupta, and H. Krishnan, “Cooperative Collision Warning: Enabling Crash Avoidance with Wireless Technology,” in Proceedings of 12th World Congress on ITS, San Francisco, CA, 2005.
- [3] G. Yan, W. Yang, M.C. Weigle, S. Olariu, and D. Rawat, “Cooperative Collision Warning through Mobility and Probability Prediction,” in IEEE Intelligent Vehicles Symposium (IV), San Diego, CA, June 2010.
- [4] R. Tatchikou, S. Biswas, and F. Dion, “Cooperative Vehicle Collision Avoidance using Inter-vehicle Packet Forwarding,” in Proceedings of IEEE Globecom, St. Louis, MO, December 2005.
- [5] S. Biswas, R. Tatchikou, and F. Dion, “Vehicle-to-Vehicle Wireless Communication Protocols for Enhancing Highway Traffic Safety,” IEEE Communications Magazine, vol. 44, no. 1, pp. 74–82, 2006.
- [6] Federal Communications Commission, “Dedicated Short Range Communications (DSRC) Service,” http://wireless.fcc.gov/services/index.htm?job=about&id=dedicated_src.
- [7] J. Luo and J.P. Hubaux, “A survey of Research in Inter-Vehicle Communications,” Embedded Security in Cars-Securing Current and Future Automotive IT Applications, pp. 111–122, 2006.
- [8] M. Sichitiu and M. Kihl, “Inter-vehicle Communication Systems: A Survey,” IEEE Communications Surveys & Tutorials, vol. 10, no. 2, pp. 88–105, 2008.
- [9] W. Xu, K. Ma, T. Wade, and Y. Zhang, “Jamming Sensor Networks: Attacks and Defense Strategies,” IEEE Network, 2006.
- [10] D. Thuente and M. Acharya, “Intelligent Jamming in Wireless Networks with Applications to 802.11b and other Networks,” in Proceedings of IEEE MILCOM, Washington, DC, October 2006.
- [11] L. Sang and A. Arora, “Capabilities of Low-power Wireless Jammers,” in Proceedings of INFOCOM, Rio de Janeiro, Brazil, April 2009.
- [12] M. Wilhelm, I. Martinovic, J. Schmitt, and V. Lenders, “Short Paper: Reactive Jamming in Wireless Networks: How Realistic is the Threat?,” in Proceedings of the fourth ACM conference on Wireless network security, 2011.
- [13] K. Pelechrinis, M. Iliofotou, and V. Krishnamurthy, “Denial of Service Attacks in Wireless Networks: The Case of Jammers,” IEEE Communications Surveys & Tutorials, vol. 13, no. 2, 2011.
- [14] Y. Law, M. Palaniswami, L. Hoesel, J. Doumen, P. Hartel, and P. Havinga, “Energy-Efficient Link-Layer Jamming Attacks gainst Wireless Sensor Network MAC Protocols,” ACM Transactions on Sensor Networks (TOSN), vol. 5, no. 1, pp. 1–38, 2009.
- [15] Diymedia, “FCC Enforcement News,” http://www.diymedia.net/fccwatch/enfnews.htm.
- [16] M. Raya and J. Hubaux, “Securing Vehicular Ad Hoc Networks,” Journal of Computer Security, vol. 15, no. 1, pp. 39–68, 2007.
- [17] A. Aijaz, B. Bochow, F. Dötzer, A. Festag, M. Gerlach, R. Kroh, and T. Leinmüller, “Attacks on Inter Vehicle Communication Systems- An Analysis,” in Proceedings of the International Workshop on Intelligent Transportation (WIT), Hamburg, Germany, March 2006.
- [18] Texas Transportation Institute, “2011 urban mobility report,” http://tti.tamu.edu/documents/mobility-report-2011.pdf.
- [19] O. Wolfson B. Xu and H. Ju Cho, “Monitoring neighboring vehicles for safety via v2v communication,” in IEEE International Conference on Vehicular Electronics and Safety (ICVES), 2011.
- [20] K. Dresner and P. Stone, “Multiagent traffic management: An improved intersection control mechanism,” in In The Fourth International Joint Conference on Autonomous Agents and Multiagent Systems, Utrecht, The Netherlands, July 2005.
- [21] T. Leinmüller, E. Schoch, F. Kargl, and C. Maihöfer, “Influence of Falsified Position Data on Geographic Ad-hoc Eouting,” in Proceedings of the Second European conference on Security and Privacy in Ad-Hoc and Sensor Networks, Berlin, Heidelberg, 2005, ESAS’05, pp. 102–112, Springer-Verlag.
- [22] M. Jakobsson, S. Wetzel, and B. Yener, “Stealth Attacks on Ad-hoc Wireless Networks,” in IEEE 58th Vehicular Technology Conference, October 2003, vol. 3.
- [23] Tong Z., R. Choudhury, Peng N., and K. Chakrabarty, “P2DAP-Sybil Attacks Detection in Vehicular Ad Hoc Networks,” IEEE Journal on Selected Areas in Communications, vol. 29, no. 3, pp. 582 –594, march 2011.
- [24] M. Raya, P. Papadimitratos, and J.-P. Hubaux, “Securing vehicular communications,” IEEE Wireless Communications, vol. 13, no. 5, pp. 8 –15, october 2006.
- [25] R. Bellman, “A Markovian Decision Process,” Journal of Mathematics and Mechanics, vol. 6, no. 4, 1957.
- [26] L. Getoor and B. Taskar, “Introduction to Statistical Relational Learning,” The MIT Press, 2007.
- [27] D. Bertsekas, “Approximate Policy Iteration: A Survey and Some New Methods,” Journal of Control Theory and Applications, 2011.
- [28] R. Sutton and A. Barto, “Reinforcement Learning,” MIT Press, Volume 18, 1988.
- [29] L. Busoniu, D. Ernst, B. De Schutter, and R. Babuska, “Cross-Entropy Optimization of Control Policies with Adaptive Basis Functions,” IEEE Transactions on Systems, Man, and Cybernetics, vol. 41, no. 1, pp. 196–209, 2011.
- [30] D. Di Castro and S. Mannor, “Adaptive Bases for Reinforcement Learning,” Machine Learning and Knowledge Discovery in Databases, pp. 312–327, 2010.
- [31] H. Yu and D. Bertsekas, “Basis function adaptation methods for cost approximation in mdp,” in IEEE Symposium on Adaptive Dynamic Programming and Reinforcement Learning, Nashville, TN, April 2009.
- [32] D. Bertsekas and J. Tsitsiklis, Neuro-Dynamic Programming, Athena Scientific, 1996.