119–126
225 GHz Atmospheric Opacity Measurements from Two Arctic Sites
Abstract
We report the latest results of 225 GHz atmospheric opacity measurements from two arctic sites; one on high coastal terrain near the Eureka weather station, on Ellesmere Island, Canada, and the other at the Summit Station near the peak of the Greenland icecap. This is a campaign to search for a site to deploy a new telescope for submillimeter Very Long Baseline Interferometry and THz astronomy in the northern hemisphere. Since 2011, we have obtained 3 months of winter data near Eureka, and about one year of data at the Summit Station. The results indicate that these sites offer a highly transparent atmosphere for observations in submillimeter wavelengths. The Summit Station is particularly excellent, and its zenith opacity at 225 GHz is statistically similar to the Atacama Large Milllimeter/submillimeter Array in Chile. In winter, the opacity at the Summit Station is even comparable to that observed at the South Pole.
keywords:
Arctic sites, 225 GHz opacity, site testing1 Introduction
The success of [Doeleman et al. (2008), Doeleman et al. (2008)] in obtaining a scatter-free size estimate of submillimeter emission in Sagittarius A∗ (Sgr A∗) using Very Long Baseline Interferometry (VLBI) promises a new window for direct imaging of supermassive black holes (SMBHs). Although Sgr A∗ is the nearest known and biggest (in apparent size), its mass is relatively small among SMBH. This means a short timescale of variability, leading to undesirable smoothing of that signal during integration. On the other hand, the second largest source in apparent size is the SMBH in M87 (Virgo A), which has a large mass. A further scientifically interesting point is that M87 has a strong jet activity. But to image the SMBH in M87 with submm-VLBI requires a longer baseline in the northern hemisphere than currently available (see [Inoue et al. (2012), Inoue et al. 2012] in this proceeding) and so we began a search for a new submm telescope site.
2 Site Selection
For the site selection, we set criteria as follows: (1) Annual precipitable water vapor (PWV) of less than 3 mm for good submm opacity. (2) Longest-possible baseline with existing telescopes, for best imaging resolution. (3) Observable sky together with the Atacama Large Millimeter/submillimeter Array (ALMA) to achieve highest possible sensitivity. (4) Accessibility to the site.
Based on the first two criteria, there are three potential broad regions of interest; western China and Tibet, the highest mountains of southern Alaska, or the High Arctic polar desert, including northern Canada and Greenland. The Western China and Tibet region does not have common sky with ALMA, so it does not meet criterion (3), and the tallest peaks in Alaska (e.g., Mount McKinley) are excluded due to criterion (4). The Eureka research base on Ellesmere Island, Canada, and Summit on the Greenland icecap meet all four criteria, and we considered these two sites for further study.
3 225 GHz Tipping Radiometer
For the site survey, we purchased a 225 GHz tipping radiometer from the Radiometer Physics GmbH. The reason for the choice of this frequency is that there are many site survey results from all over the world, including the summit of Mauna Kea, the ALMA (Chajnantor) site, and South Pole.
For the opacity measurements, we use the tipping method; we observe five angles (, , , , and , which corresponds to of 1.0, 1.5, 2.0, 2.5, and 3.0) with 4 second integration at each angle, for a duration of 75 second per tipping measurement. And for each, the opacity is derived from the instrument output voltage as a function of zenith angle. Measurements were obtained every 10 minute.
We first tested at the Academia Sinica, Institute of Astronomy and Astrophysics (ASIAA) in Taipei, Taiwan, and then repeated on Mauna Kea, Hawaii to check the consistency of our measurements with the 225 GHz tipping radiometer at the Caltech Submillimeter Observatory (CSO). Simultaneous opacity measurements were performed between 31 December 2010 and 11 January 2011, and are consistent with each other (linear regression coefficient = 1.04).
4 Results
Identical observations were then carried out at the High Arctic sites, allowing direct comparison to those worldwide.
4.1 Eureka, Ellesmere Island, Canada
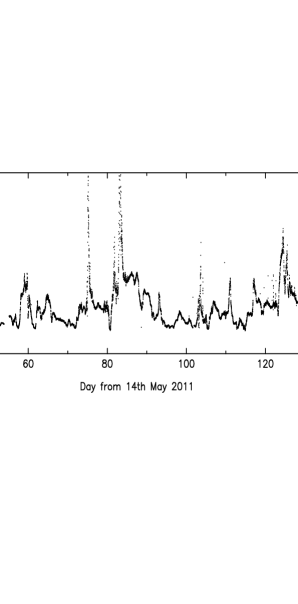
Eureka is a manned weather station on Ellesmere Island, Canada. It has a 5000 foot all-season airstrip. Yearly resupply by ship occurs in late summer. A road allows access to the Polar Environment Atmospheric Research Laboratory (PEARL), located on a 610 m-high ridge at N, W. Although this site is not as high as other good submm sites, it is expected to have low opacity conditions based on low temperatures, typically between C and C in winter ([ste00, Steinbring et al. 2010]). The radiometer was deployed on the rooftop observing platform of PEARL, and measured the 225 GHz opacity between 14 February and 10 May 2011. Tipping direction was south, providing 10,522 data points.
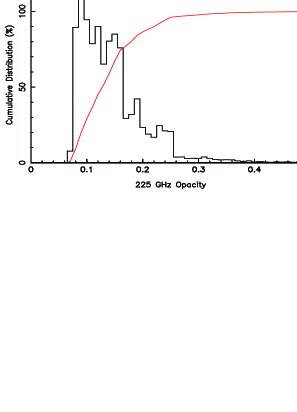
Fig. 1 shows the time variation, histogram, and cumulative plots. The lowest 225 GHz opacity measured was 0.07, the 25% quartile was 0.11, the median (50% quartile) was 0.14, and the most frequent opacity was 0.09 during our measurements. These statistics indicate that submm-VLBI at this frequency is feasible at this site.
4.2 Summit Camp on Greenland
Summit Camp is a research station near the peak of the Greenland ice sheet, located at N, W, with an elevation of 3200 m. Access is by C-130 air transport in summer and by Twin Otter in winter, or traverse from Thule. Very good opacity conditions are expected for this site, based on low winter temperature between C and C with the lowest temperature of C ([Vaarby-Laursen (2010), Vaarby-Laursen 2010]) and the high altitude. We put our radiometer on the roof of the Mobile Science Facility (MSF), and started measuring the opacity on 17 August 2011 (and still continue to do so). Here we show data up to 31 July 2012. Tipping directions were both south and north, that is in two directions, and provide 36,555 data points.
Fig. 2 shows the time variation, histogram, and cumulative plots. The lowest 225 GHz opacity measured was 0.027, the 25% quartile was 0.056, the median was 0.083, and the most frequent opacity was 0.04 during our measurements. These statistics are excellent, strong indication that submm-VLBI at these frequencies or even higher are feasible at this site. The THz astronomy is also worth to consider.


4.3 Comparison with Other Sites
To illustrate how a High Arctic submm site can compare to the best worldwide, we compared Summit Camp statistics with those of the ALMA site (elevation = 5050 m) and South Pole (2800 m). The opacity data for the ALMA site has been taken from [Radford & Chamberlin (2000), Radford & Chamberlin (2000)] and [Radford (2011), Radford (2011)], which has been measured between April 1995 and April 2006, and that for South Pole from [Chamberlin & Bally (1994), Chamberlin & Bally (1994)] and [Chamberlin & Bally (1995), Chamberlin & Bally (1995)], which has been measured between January and December 1992.
Winter in the northern hemisphere is defined as between the beginning of November and the end of April, with summer May through October. The opposite is taken to be the case for the southern hemisphere; winter May through October, summer November through April. We put the quartiles for the three sites on the cumulative plots of the Summit Camp in Fig. 3.
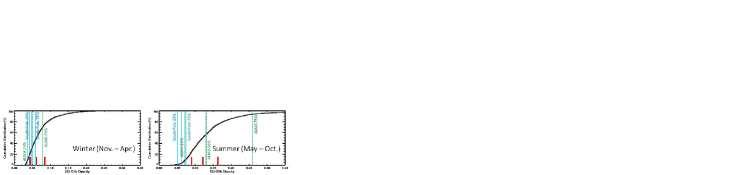
In winter season, 225 GHz opacities of all three sites are less than 0.1 even at 75% quartile. There is small difference between the sites, but the opacity statistic of the Summit Camp is rather similar to that of the ALMA site. The opacity statistics of South Pole do not vary much winter to summer, but the ALMA site shows much greater variation. Summit Camp falls somewhere in between. It is worth noting, however, that 2011/12 represents a record warm period for Greenland, which may have affected opacity statistics. Long-term monitoring is needed to carefully judge the quality of Summit Camp as a submm site.
5 Summary
We have presented a program of site testing for a submm telescope site in the northern hemisphere. Both Eureka, Ellesmere Island, and Summit Camp, Greenland offer the potential for new submm VLBI observations. Based on the best 225 GHz opacity measurements, we selected Summit Camp, and current efforts are underway on retrofitting an antenna for the extremes of the site. The opacity measurements are still ongoing to collect long-term opacity variation data. It will reveal whether the record warmth in Greenland has affected the opacity statistics or not, and the true fraction of time that Summit Camp reaches the quality of South Pole. In addition, atmospheric characteristics using various instrumentations (cloud radars and lidars, radiosondes, microwave radiometers, precipitation measurements) are ongoing at Summit Camp by atmospheric researchers (e.g., [Shupe et al. (2012), Shupe et al. 2012]). We are closely collaborating with them to estimate the atmospheric conditions more accurately, and to construct accurate atmospheric models for the coming submm/THz astronomy at this site.
References
- [Chamberlin & Bally (1994)] Chamberlin, R.A. & Bally, J. 1994, App. Opt. 33, 1095
- [Chamberlin & Bally (1995)] Chamberlin, R.A. & Bally, J. 1995, Int. J. IR MM Waves 16, 907
- [Doeleman et al. (2008)] Doeleman, S.S., et al. 2008, Nature 455, 78
- [Inoue et al. (2012)] Inoue, M., et al. 2012, this proceeding
- [Radford (2011)] Radford, S.J.E. 2011, RevMexAA (SC) 41, 87
- [Radford & Chamberlin (2000)] Radford, S.J.E. & Chamberlin, R.A. 2000, ALMA Memo 334
- [Shupe et al. (2012)] Shupe, M.D., et al. 2012, Bull. Amer. Meteo. Soc. in press
- [Steinbring et al. (2010)] Steinbring, E., Carlberg, R., Croll, B., Fahlman, G., Hickson, P., Ivanescu, L., Leckie, B., Pfrommer, T. & Schoeck, M. 2010, PASP 122, 1092
- [Vaarby-Laursen (2010)] Vaarby-Laursen, E., DMI Tech. Rep. 10-09